Ophthalmology and Visual Sciences, University of Iowa Hospitals and Clinics, Iowa City, USA. â ... Prevention of Visual Loss and Blindness, Iowa City, USA.
SPLAT FEATURE CLASSIFICATION: DETECTION OF THE PRESENCE OF LARGE RETINAL HEMORRHAGES Li Tang� �
Meindert Niemeijer�
Michael D. Abr`amoff�†
Ophthalmology and Visual Sciences, University of Iowa Hospitals and Clinics, Iowa City, USA † Biomedical Engineering, University of Iowa, Iowa City, USA † Electrical and Computer Engineering, University of Iowa, Iowa City, USA † Department of Veterans Affairs, Center of Excellence for Prevention of Visual Loss and Blindness, Iowa City, USA ABSTRACT
Reliable detection of large retinal hemorrhages is important in the development of automated screening systems which can be translated into practice. In this study, we propose a novel large retinal hemorrhages detection method based on splat feature classification. Fundus photographs are partitioned into a number of splats covering the entire image. Each splat contains pixels with similar color and close spatial location. A set of distinct features is extracted within each splat. By learning properties of splats formed from blood vessels, a classifier was trained so that it can distinguish blood splats from non-blood splats. Once the blood splats, i.e. vasculature and hemorrhages, are separated from the background, the connected vasculature was removed and the remaining objects considered hemorrhage candidates. Our approach had a satisfactory performance on a test set composed of 1200 images compared to a human expert. Index Terms— Retinal hemorrhage, splat classification, fundus image, computer-aided detection or diagnosis
1. INTRODUCTION Large retinal hemorrhages are primarily caused by abnormally fragile retinal blood vessels in disease such as high blood pressure and diabetes, and their presence is a sign of advanced disease - their presence is usually asymptomatic. Automated detection of diabetic retinopathy including large hemorrhages provide possibilities for timely treatment and hence prevent visual loss and blindness (1). The most common lesions in diabetic retinopathy are microaneurysms, small hemorrhages, exudates, and cottonwool spots and systems have been design to detect these automatically (1). Large hemorrhages occur only in rare cases, indicate more sever disease, and may occur in isolation - i.e. without accompanying other signs, such as microaneurysms or exudates - and will thus be missed by systems designed to detect microaneurysms etc. (2). Therefore, it is highly relevant to detect large hemorrhages, but this is complicated for the following reasons: a) This work was supported in part by the National Institutes of Health (EY017066) and the U.S. Department of Veterans Affairs.
978-1-4244-4128-0/11/$25.00 ©2011 IEEE
681
(a)
(b)
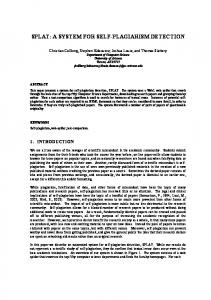
Fig. 1. Examples of retinal hemorrhages with different shapes and appearances.
They are rare, so few examples are available for example to train a supervised system, or even generalize from instances. In fact, designing such a system requires close collaboration with clinicians to describe the general features (3); b) They are irregular, so straightforwardly using other detectors at different scales will miss most lesions. Two examples of large retinal hemorrhages can be found in Figure 1. Even though both of them fall in the category of large retinal hemorrhage, their shapes and appearances show great variability. Previously published methods for the detection of hemorrhages in fundus photographs have focused on detecting normal-sized red lesions (4; 5). A system may miss cases with isolated large hemorrhages. Because those hemorrhages only occur in a very small number of patients, it is not easy to find enough cases for training a lesion/non-lesion classification. However, large hemorrhages such as those shown in Figure 1 are definitely not to be missed by screening systems. The purpose of this study is to develop a large retinal hemorrhage detection algorithm (1). We propose a supervised classification algorithm to the large hemorrhage detection problem by training a classifier on fundus photographs without manually segmented target objects. This is achieved by designing a blood detector, which is a classifier trained with features extracted from blood vessels. Instead of focusing on pixel level features, we address
ISBI 2011
the problem using a higher level entity - splat, which is a collection of pixels with similar color and spatial location. Because hemorrhages are caused by abnormal bleeding on the retina, they have a similar appearance as vasculature, such as color. By making use of those common features shared by blood vessels and hemorrhages, the splat-based classifier achieves good performance for accurate large hemorrhage detection, even though the targets are previously unseen objects at the learning stage. In experiments, the proposed system is trained on a set of 20 photographs, and tested on another, completely independent set of 1200 photographs. Based on the hemorrhagelikeness map produced by classification, a hemorrhage index is calculated as outcome to indicate the image level detection result. We sorted testing images according to this index by descending order and verified the detection performance by referring the first 20 positives to an ophthalmologist for further review. 2. SPLAT SEGMENTATION Based on the assumption that pixels that are part of the same structure in fundus photographs have similar colors and spatial locations, the image plane is split into splats of homogeneous color using image over-segmentation (6) with two steps. We first compute gradient magnitudes of the input image at scales optimal for localization of vessel boundaries. Next, the maximum of these gradients over scales is used in performing a watershed segmentation (7). Assuming that we establish a scale-space representation of image I(x, y; s) with Gaussian kernels Gs at scale-ofinterest s ∈ s1 , · · · , sn , the gradient magnitude |∇I(x, y; s)| is computed from its horizontal and vertical derivatives: � |∇I(x, y; s)| = Ix (x, y; s)2 + Iy (x, y; s)2 �� �2 � �2 ∂ ∂ (Gs ∗ I(x, y)) + (Gs ∗ I(x, y)) = ∂x ∂y �� �2 � �2 ∂Gs ∂Gs ∗ I(x, y) + ∗ I(x, y) = (1) ∂x ∂y ∂Gs s where symbol ∗ represents convolution and ∂G ∂x , ∂y are the first order derivatives of Gaussian along horizontal and vertical directions. The maximum of the gradient magnitudes aggregated over the scales is used to produce splats by application of the watershed (7): G(x, y) = maxi |∇I(x, y; si )|.
3. SPLAT FEATURE SPACE ANALYSIS To train a learning algorithm to detect hemorrhages, the mean color within splat p is extracted in RGB color space and color opponency images for dark-bright, red-green and blue-yellow (8), comprising 6 color components fpc in the splat feature space:
682
fpc =
1 ap
�
Ic (x, y).
(2)
(x,y)∈Ωp
where Ic (x, y) is the image in one color plane and Ωp represents the set of pixels within splat p. Its area ap = � (x,y)∈Ωp 1. Besides the absolute mean color, intensity variations across the fundus image have to be taken into consideration as well, because it can deteriorate the performance of color-based classification. Therefore differences between Gaussian smoothed images and the original one are computed at a number of scales (σ = 0.5, 1, 2, 4, 8, 16), which is expected to cover potential bandwidth of retinal hemorrhage boundaries. The mean difference along each splat boundary comprises additional features fps of that splat: � 1 [Gs ∗ I(x, y) − I(x, y)]d(x, y). (3) fps = lp Ωp where Ωp represents the boundary of splat p with length lp . Feature fps is also computed from all 6 color channels. Augmented with the mean color, the splat feature set has a total of 42 dimensions. The example labels used in the learning stage are labels of blood vessel splats derived from manual segmention. A feature vector is extracted for each of the training samples (splats). All splats in the training images are thus assigned a label and a feature vector. Each feature is normalized for all samples to have zero mean and unit variance. A classifier can now establish a decision boundary in the splat feature space which will optimally separate the two classes - blood and nonblood regions. Using the trained classifier, splats in a testing image are assigned a label based on the set of feature values extracted from the test sample. Once the blood splats including vasculature and hemorrhages are separated from the rest of the retina, the connected vasculature can be removed using automated vessel segmentation (9) and the remaining objects are considered possible hemorrhages. A kNN classifier allows for soft-classification in which each splat is assigned a probability of it being a blood region. Preliminary studies showed that k = 101 gave satisfactory results (10). After the training stage, we use the sequential forward feature selection (SFS) to find a subset of most relevant features. The area under the receiver operating characteristic (ROC) curves is taken as the criterion function. Seven of the 42 features were selected. They are features fps derived from green channel (σ=2,4,8,16) and blue channel (σ=4,16) in the RGB color space and features derived from dark-bright opponency image (σ=1). These 7 features all need to be extracted from the testing dataset for splat-based feature classification. The training of the splat classification procedure needs to be completed only once, after it has finished the system is ready to process unseen images as a blood detector. Note that at the testing stage, the system is fully automatic.
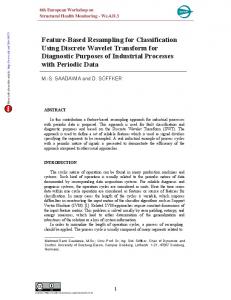
4. IMAGE LEVEL HEMORRHAGE INDEX The goal of the splat feature classification is to develop a large retinal hemorrhage detector, indicating whether or not an image is normal, i.e. free of hemorrhages, or abnormal, i.e. containing one or more hemorrhages. When the posterior probability of each splat being blood regions is determined, a hemorrhage-likeness map pblood can be created for each testing image. To upgrade this hemorrhage-likeness map to image level decision of the existence of retinal hemorrhages, pblood has to be turned into a single index which indicates the likelihood that the corresponding fundus image contains hemorrhages. To extract possible candidate hemorrhage locations, pblood was first thresholded to produce a binary image. In order to determine an appropriate threshold, the mean hemorrhage-likeness of blood vessel splats labeled by the vessel probability map pvessel was examined. This gave an indication of the mean probability value of blood splats that could be detected at a certain threshold. Further experimentation showed that 0.88 gave a good separability of blood splats and the rest of the retina. After thresholding, a binary image containing hemorrhages (if any) and the vascular tree was obtained. By removing vessel splats, the remaining responses indicate the presence of hemorrhages. Neighboring hemorrhage splats are merged together to form one object. The hemorrhage index is computed as the mean probability of the hemorrhage splats, weighted by the area of the largest hemorrhage among them. 5. EXPERIMENTS AND RESULTS A set of 20 fundus photographs from the publicly available DRIVE (Digital Retinal Images for Vessel Extraction) database was used to train the kNN classifier as described above. The vasculature has been manually segmented. A complete description of the database can be found in (9). The algorithm is tested on the MESSIDOR dataset, a publicly available dataset collected to evaluate segmentation and indexing techniques (http://messidor.crihan.fr/descriptionen.php). The dataset contains 1200 fundus photographs and was used to test the presented system. The vessel trees have been segmented by an automatic algorithm (9). As a hemorrhage detector, the developed algorithm is expected to assign high index number while not generating an excessive number of false positives (FPs). Four hemorrhagelikeness maps are shown in Figure 2 with their hemorrhage indices, as an quantitive indication of the actual hemorrhage detection performance. The results show that most of the blood regions, including blood vessels with different width, hemorrhages with different sizes, even those small red lesions, get high responses in the hemorrhage-likeness maps. The shapes of these hemorrhages are well described by the splat-based
683
representation. These hemorrhage-likeness maps, even without thresholding, have a good separability between blood and non-blood regions. The hemorrhage index reflects the likelihood of existence of retinal hemorrhages as desired. We sorted the 1200 testing images according to the hemorrhage index in descending order. The 20 with the highest hemorrhage index were reviewed by a retinal specialist (MDA) in masked fashion, and 18/20 were found to display profilerative diabetic retinopathy manifested as large extensive hemorrhages, retinal membranes, extensive exudates and extensive atrophic laser scars, these 18 were also labeled as abnormal by the original annotators of the messidor dataset. 6. DISCUSSION AND CONCLUSION Our results show that our splat-based feature classification approach can detect the presence of large retinal hemorrhages in fundus photographs with performance comparable to a retinal specialist. To have a better description of the shape of hemorrhages, the image is segmented into non-overlapping splats which cover the entire FOV. A set of features are extracted from each splat. These splats are employed as samples to perform a supervised classification. Aggregating features within splats improves the robustness of the system, as it is resistant to pixel level noise. Moreover, the sample size is decreased substantially with more balanced distributions for the two classes. These factors are beneficial for improved classification performances in term of both efficiency and accuracy. In training the classifier, we make use of the fact that hemorrhages are caused by abnormal bleeding on the retina, so they share some appearance features with the vasculature. Therefore we designed a blood detector, which is trained with a set of easily obtainable features extracted from blood vessels. The fundus photographs used at the learning stage do not necessarily contain manually segmented target objects, i.e. large retinal hemorrhages which are rarely seen in datasets collected in a screening program. In this manner the splat-based classifier can be trained for the purpose of detecting blood regions, i.e. separating the vasculature and hemorrhages from the rest of the retina. After removing the connected vasculature by automated vessel segmentation, the remaining objects are considered possible hemorrhages. In experiments, the proposed system is trained on a set of 20 photographs representative of those used in a screening setting, and tested on another, completely independent set of 1200 photographs. Based on the resulting hemorrhagelikeness map, a hemorrhage index is produced as outcome to indicate the likelihood that the fundus image contains hemorrhages. The hemorrhage-likeness maps show good separabilities between blood/non-blood regions. Not only those large hemorrhages, but also small red lesions get high responses. The retinal specialist flagged 18 of the first 20 images with the highest hemorrhage indices in the testing set as disease positives with severe profilerative diabetic retinopathy, which
(a) Fundus image
(b) Hemorrhage index: 193.04
(c) Fundus image
(d) Hemorrhage index: 14.56
(e) Fundus image
(f) Hemorrhage index: 6.32
(g) Fundus image
(h) Hemorrhage index: 2.77
Fig. 2. Fundus images and their hemorrhage-likeness maps from splat-based feature classification. verified the satisfactory performances of the system. A limitation of the current study is that we only extracted features shared by the vasculature and hemorrhages. More distinct features that belong exclusively to hemorrhages remain to be explored. In addition, our evaluation was based on that of a single expert, reviewing only part of the dataset. Initial evaluations by combining the hemorrhage index with other image-level disease features, in order to see how the detection of large hemorrhages affects overall system performance, were encouraging, but more extensive testing is required. The hemorrhage index can be easily integrated into a comprehensive diabetic retinopathy screening system, such as the one presented in (11). Our work on evaluating existing computer-aided detection or diagnosis (CAD) systems (11) shows that the main causes of false negatives, as high as 50%, are images that contain only one or two large hemorrhages. Improved detection of such lesions should lead to the elimination of a large part of those false negatives. One of the difficulties in detection of large retinal hemorrhages lie in the problem of appropriate shape modelling, which was handled efficiently with the splat-based sample representation.
References [1] Michael D Abr`amoff, Joseph M Reinhardt, Stephen R Russell, James C Folk, Vinit B Mahajan, Meindert Niemeijer, and Gw´enol´e Quellec, “Automated Early Detection of Diabetic Retinopathy.,” Ophthalmology, vol. 117, no. 6, pp. 1147–1154, Apr. 2010. [2] M. D. Abr`amoff, M. Niemeijer, M. S. A. Suttorp-Schulten, M. A. Viergever, S. R. Russell, and B. van Ginneken, “Evaluation of a system for automatic detection of diabetic retinopathy from color fundus photographs in a large population of patients with diabetes,” Diabetes Care, vol. 31, no. 2, pp. 193–198, February 2008.
684
[3] G. Quellec, S.R. Russell, and M.D. Abr`amoff, “Optimal filter framework for automated, instantaneous detection of lesions in retinal images,” IEEE Trans Med Imag, p. in press, 2010. [4] M Niemeijer, B van Ginneken, J Staal, M S A SuttorpSchulten, and M D Abr`amoff, “Automatic Detection of Red Lesions in Digital Color Fundus Photographs,” IEEE Trans Med Imag, vol. 24, no. 5, pp. 584–592, 2005. [5] Jang Pyo Bae, Kwang Gi Kim, Ho Chul Kang, Chang Bu Jeong, Kyu Hyung Park, and Jeong-Min Hwang, “A Study on Hemorrhage Detection Using Hybrid Method in Fundus Images.,” Journal of digital imaging, Feb. 2010. [6] C. Lawrence Zitnick and Sing Bing Kang, “Stereo for ImageBased Rendering using Image Over-Segmentation,” International Journal of Computer Vision, vol. 75, no. 1, pp. 49–65, Feb. 2007. [7] Yung-Chieh Lin, Yu-Pao Tsai, Yi-Ping Hung, and Zen-Chung Shih, “Comparison between immersion-based and tobogganbased watershed image segmentation.,” IEEE trans image processing, vol. 15, no. 3, pp. 632–40, 2006. [8] M. D. Abr`amoff, W. L. M. Alward, E. C. Greenlee, L. Shuba, C. Y. Kim, J. H. Fingert, and Y. H. Kwon, “Automated segmentation of the optic disc from stereo color photographs using physiologically plausible features,” Invest. Ophthalmol. Vis. Sci., vol. 48, no. 4, pp. 1665–1673, April 2007. [9] Meindert Niemeijer, Joes Staal, Bram van Ginneken, Marco Loog, and Michael D. Abramoff, “Comparative study of retinal vessel segmentation methods on a new publicly available database,” Proceedings of SPIE, pp. 648–656, 2004. [10] Joes Staal, M.D. Abr`amoff, Meindert Niemeijer, M.A. Viergever, and Bram van Ginneken, “Ridge-based vessel segmentation in color images of the retina,” IEEE Transactions on Medical Imaging, vol. 23, no. 4, pp. 501–509, Apr. 2004. [11] Meindert Niemeijer, Michael D Abramoff, and Bram van Ginneken, “Information fusion for diabetic retinopathy CAD in digital color fundus photographs.,” IEEE Trans Med Imag, vol. 28, no. 5, pp. 775–85, 2009.