Support Vector Machine in Novelty Detection for Multi-channel Combustion Data Lei A. Clifton1 , Hujun Yin1 , and Yang Zhang2 1
School of Electrical and Electronic Engineering,
[email protected];
[email protected] 2 School of Mechanical, Aerospace and Civil Engineering,
[email protected] The University of Manchester, Manchester, M60 1QD, UK
Abstract. Multi-channel combustion data, consisting of gas pressure and two combustion chamber luminosity measurements, are investigated in the prediction of combustion instability. Wavelet analysis is used for feature extraction. A SVM approach is applied for novelty detection and the construction of a model of normal system operation. Novelty scores generated by classifiers from different channels are combined to give a final decision of data novelty. Comparisons between the proposed SVM method and a GMM approach show that earlier identification of combustion instability, and greater distinction between stable and unstable data classes, are achieved with the proposed SVM approach.
1
Introduction
Combustion instability, caused by the resonant coupling between heat (generated by combustion) and acoustic pressure, is a major problem in the operation of jet engines and power generators. Early warning of combustion instability is required in order to prevent catastrophic failure. Combustion image data from a high-speed camera have been investigated to predict instability in [13], in which a Gaussian mixture model (GMM) was constructed to identify novel data. Two data sets generated by a Typhoon G30 combustor are investigated in this paper. The combustor was operated at atmospheric pressure, providing data in stable and deliberately unstable modes of combustion. Unstable combustion is achieved by increasing fuel flow rates above some threshold, with constant air flow rate. Both data sets represent measurements taken as the combustor moves from stable to unstable combustion modes. Each data set consists of three channels (with sampling frequency of 1 KHz), the first of which is the gas pressure of the fuel propane (C3 H8 ) in the pilot burner. For stable combustion, the swirl air flow rate was 0.039 Kgs−1 , the fuel supplied to the main and the pilot burners were fixed at flow rate 22.61 × 10⁻⁴ Kgs−1 and 10.20 × 10⁻⁴ Kgs−1 respectively. In order to initiate combustion instabilities, the flow rates of fuel supplied to the main and pilot burners were increased to 26.18 × 10⁻⁴ Kgs−1 . The second and third channels are luminosity measurements recorded within the combustion chamber. A bundle of fine optical
2
fibres were mounted at the rear focal point of a Nikon 35 mm camera, such that all light passing through the front lens was collected. The flame luminosity from the combustion chamber was measured using this system. The fibre optic bundle was bifurcated, each channel connected to a photomultiplier (ORIEL model 70704). This allowed the measurement of chemiluminescent emitters of C2 radicals (visible at light wavelength 513 nm), and the global intensity of unfiltered light, corresponding to the second and third channels in the data sets. Support Vector Machines (SVMs) have been applied to many novelty detection problems, such as jet engine vibration testing [5], image retrieval [1], signal segmentation [3] and fMRI analysis [4]. The optical measurement methods described above have been applied to study flame dynamics of unstable combustion [9]. On similar data, we apply one-class SVMs to multi-channel combustion data; an averaging fusion method is then applied to combine SVM classifications from different channels. The whole system is applied in an on-line fashion.
2
Wavelet Analysis for Feature Extraction
For combustion data, frequency domain features alone are not suitable for on-line novelty detection [13]. Features from wavelet analysis are used in the proposed method. Wavelet analysis represents a function in terms of basis functions, localised in both location and scale [2]. It is capable of revealing behavioural trends or transient periods within the data. Wavelet decomposition can be regarded as a multi-level or multi-resolution representation of a function f (x), where each level of resolution j (except the initial level) consists of wavelets ΨIj or waveletfamilies ΨIµ,j , with the same scale but differing locations. Wavelet decomposition of a function f (x), can be written f (x) =
X k∈K 0
c0k φ0k (x) +
+∞ X X X
µ,j dµ,j I ΨI (x),
(1)
j=1 µ I∈ζ µ,j
where φ0k and ΨIµ,j are respectively n-dimensional scaling functions and wavelets of different families and levels of resolution; c0k and dµ,j I are corresponding scaling coefficients and wavelet coefficients. Mallat [8] developed a filtering algorithm for Discrete Wavelet Transforms. Given a signal S of length N , wavelet decomposition of the first level produces two sets of coefficients: approximation coefficients cA1 and detail cD1 , by convolving S with a low-pass filter for approximation, and with a high-pass filter for detail, followed by dyadic decimation (down-sampling). Wavelet decomposition of the next level splits the approximation coefficients cA1 in two parts using the same scheme, replacing S by cA1 , and producing cA2 and cD2 , and so on. We investigate two three-channel combustion data sets in this paper, which contain 5800 and 7500 data points respectively in each channel. These data points are divided into 75 and 58 sections respectively, with 100 data points in each section. Wavelet analysis with the Harr wavelet is applied to each section.
3
The mean values of approximation and detail coefficients extracted on the first level are used as two dimensional features in the input space.
3
Support Vector Machines for Novelty Detection
Novelty detection, defined as detecting departures in behaviour from a model of system normality, is applicable to combusiton systems in which often only “normal” data are available. The training data available are “normal” data in the feature domain X : X = {x1 , . . . , xm }, where m is the number of observations. The training data can be mapped into another feature space through a kernel function which satisfies Mercer conditions [12]. The kernel function performs a feature mapping Φ: X → F , which maps the original space into a dot product space F k(xi , xj ) = (Φ(xi ) · Φ(xj )).
(2)
A Gaussian kernel function is used here to suppress the growing distances for larger feature spaces [11] k(xi , xj ) = exp (−kxi − xj k2 /2σ 2 ),
(3)
where σ is the width parameter associated with the kernel function. The strategy developed in [10] maps the data into the feature space corresponding to the kernel function, and separates them from the origin with maximum margin. The decision function is found by minimising the weighted sum of a support vector type regulariser and an empirical error term depending on an overall margin variable ρ and individual errors ξi minm
w∈F,ξ∈R ,ρ∈R
subject to
1 1 X ξi − ρ kwk2 + 2 νm i
(w · Φ(xi )) ≥ ρ − ξi ,
ξ ≥ 0.
(4) (5)
Constructing a Lagrangian, and setting the derivatives with respect to w equal to zero, leads to w=
m X
(αi Φ(xi ))
(6)
i=1
1 1 αi = − βi ≤ , νm νm
m X
αi = 1,
(7)
i=1
where ν serves as an upper bound on the proportion of outliers (defined to be those data which lie outside the estimated region of normality). In (6), all patterns {xi : i = 1, . . . , m; αi > 0} are called Support Vectors. The dual formulation is X minm αi αj k(xi , xj ) (8) α ∈R
ij
4
subject to
X
αi = 1,
0 ≤ αi ≤
i
1 . νm
(9)
The overall margin variable ρ can be calculated by ρ = (w · Φ(xi )) =
m X
αj k(xi , xj ).
(10)
i=1
Typically, the use of SVMs for novelty detection includes investigation of the effect of varying parameter ν [10, 5] for particular data sets. Combustion data may have differing lengths and sampling frequencies, so that the number 1 of observations m varies. We define a smoothing parameter P = νm , observing that ν and m vary together and may be considered a single variable. We use the function g(x) = 1 − (w · Φ(x)) + ρ
(11)
to assign novelty values to data, such that abnormal data (i.e. those outside the one training class) take values close to one.
4
Combination of Classifiers
Novelty values g(x), computed using (11), from each of the three channels are combined. Each data set is considered independently. Different classifier combination strategies have been studied in [6] and [7]. In this investigation, novelty scores generated by different classifiers are combined according to the mean rule [7]: L
gˆ(x) =
1X gi (x), L i=1
(12)
where gi (x) is the novelty score generated by the ith classifier, i = 1, . . . , L, and L is the number of classifiers.
5 5.1
Results and Comparisons Comparison of SVM classifiers with GMM classifers
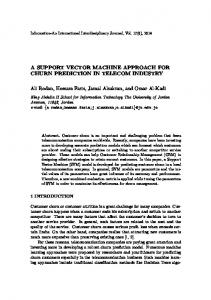
The series of wavelet features generated for the two data sets are two dimensional for each channel, containing 58 and 75 data points respectively. The combustor operated in stable combustion mode until data point 27 and 37, for data sets 1 and 2 respectively. This corresponds to a time of approximately 2.8 s, as shown in Figure 1(a), in which the three channels of data set 1 are plotted. After this period of stable combustion, a period of transient behaviour is seen, prior to operation in unstable combustion mode for the remainder of both data sets. 80% of these stable data points (21 for data set 1, and 29 for data set 2) are
5
used as training data. The remaining 20% stable data, and all of the transient and unstable data, are used as test data. A zero-mean, unit-variance transformation is applied to all data, for normalisation prior to the feature extraction. For each SVM classifier, Gaussian kernel width parameter σ = 0.9 is used, and smoothing parameter P is set to 100. A threshold Hs = 0.1 is used, such that all data with novelty score gi (x) > Hs are classified “abnormal” with respect to the one-class model, generated from the ith classifier. In order to compare the proposed SVM approach with other methods such as GMM approaches [13], we replace SVM classifers with equivalent GMM classifiers. The estimated probilities generated by Gaussian classifers in each channel are also combined PL according to the mean rule to give final estimated probability pˆ(x) = L1 i=1 pˆi (x), where pˆi (x) is the estimated probability of normality generated by the ith GMM classifier. Each Gaussian classifier has two mixture components, with a probability threshold Hg = 0.02. Data with pˆ(x) < Hg are regarded “abnormal”. 5.2
Results and discussions
Figure 1 shows time-domain signals and results of novelty detection applied to data set 1. Two types of test data are considered here: unseen stable (normal) data and unseen unstable (novel) data. Figure 1(b) illustrates the use of novelty threshold Hs to separate the novelty scores of stable and unstable data for the combined SVM classifier. It can be seen that, as the transient period from stable to unstable combustion is reached, novelty scores increase above Hs , and are thus classified as “abnormal” with respect to the SVM model of normality. Figure 1(c) shows the estimated probablities genearated by the combined GMM classifier. At data index 31, the probability dropped sharply to almost zero, indicating that these data are novel with respect to the GMM model of normality. In Figure 1(b) and (c), test (unseen) stable data show similar results to training stable data, indicating both combined SVM and combined GMM classifications are correct for stable data. However, the combined SVM classifier gives more stable results than the combined GMM classifer, assigning novelty scores of approximately zero for all stable data, while estimated probabilities from the combined GMM classifier fluctuate greatly on the same data. Figure 1(d)-(f) show contour plots of gi (x) generated by SVM classifiers in each of the three channels of data set 1. It can be seen that the modelled regions corresponding to normality, in which novelty scores are close to zero, closely correspond to the distribution of training stable data, while unseen unstable data are considerably separated from stable data. Table 1 shows the first data index for which gi (x) > Hs ; i.e. when data are first deemed “abnormal” by the SVM classifier trained for each channel, and for the combined SVM classifier. Novel data are identified during transient periods by every classifier in all three channels of both data sets. The final decision is made by the combined classifier. Note that for data set 2, the combined classifier first identifies novel data at index 31, which is the earliest novelty detection of all three individual SVM classifiers for that data set, occurring within the third
6 Table 1. Data index of the first novel classification, according to each SVM or GMM classifier and combined efforts
Data set 1 Data set 2
Channel 1
Channel 2
Channel 3
Combined classifier
SVM GMM 31 17 38 4
SVM GMM 29 16 37 34
SVM GMM 30 30 31 31
SVM GMM 30 31 31 40
channel. This indicates the comparatively high novelty of data from the transient period in the third channel. Table 1 also shows the first data index for which pˆi (x) > Hg in GMM approach. Note that the first novel classifications using the GMM approach can be false positive detections, occurring within the period of stable combustion (e.g. indices 16 and 17 within data set 1, and index 4 within data set 2), indicating an over-sensitivity of the individual GMM classifiers in comparison to the SVM equivalents. When classifications are combined, the combined SVM classifer detects novel data at data index 30 and 31 for data set 1 and data set 2 respectively, while the combined GMM classifier detects novel data at data index 31 and data index 40. Although the over-sensitivity of the GMM classifiers has been reduced by combining their outputs, the result is worse than the combined SVM classifiers. This is caused by the great fluctuations of pˆi (x) within the GMM approach, in which the combination of highly variant and inaccurate probability estimates leads to poorer performance than the SVM approach. There are three critical parameters for SVM classifiers: the smoothing parameter P , the width parameter σ for the Gaussian kernel and the threshold Hs for novelty scores. Variation of these parameters causes dramatic differences in novelty detection results. The parameters used within this investigation are empirical values which generally work well for multi-channel combustion data.
6
Conclusion
SVM classifiers for each of the three channels perform well in the classification of unseen multi-channel combustion data, including unseen stable data and unseen unstable data. Novel data are identified by the combined classifier at an early stage of unstable combustion, i.e. the transient stage, for both data sets examined within this investigation. Novelty scores are assigned such that unstable combustion data are easily separated from stable combustion data. This method of novelty detection provides good results when combined with the use of wavelet techniques for feature extraction of combustion data. This investigation emphasises the value of the SVM classification approach to on-line novelty detection in gaining early warning of possibly catastrophic combustion instabilities, such that preventative maintenance action may be taken to avoid equipment failure.
7 Time domain data
Average output of SVM classifiers 1.2
0 −5
1 0
1
2
3 4 Channel 1, Time (s)
5
6
Amplitude
5 0 −5
0
1
2
3 4 Channel 2, Time (s)
5
6
Amplitude
0.6
0.4
0.2
5
0
0 −5
0.8 Average output
Amplitude
5
0
1
2
3 4 Channel 3, Time (s)
5
6
−0.2
0
10
20
30 Sections
(a)
40
50
60
(b)
Average output of GMM classifiers 0.7
2
0.1
1
0.1
0
0.5
0.5
−0.5
0.5
0.5
0
0.4
0 0.1
0.3 −1 0.2
0.1
0
Average output
0.5
0
0.5
0.1
1.5
0.6
−1.5 −2
0.1
0. 5
5
0.
−2.5 0
0
10
20
30 Sections
40
50
60
−2.5
−2
−1.5
−1
−0.5
(c)
0
0.5
1
1.5
2
(d) 0.1
0.5
0.1
0
0.5
2
0
1.5
1
0.1
0
1 0
0.5
0.5
0
0.1
1.5
0.5
0.1
0.5
2.5 2
0.1
0.5
0
0.5
0.5
−0.5
0.5
0.1
0
0
0
−1 −0.5
0.1
−1.5
0 −1
0
0
0.5
0.5
0.1
0.5
−1.5
0.5
0.1
0.5
−2.5
0.1
0
−2
−3 −3
−2
−1
0
(e)
1
2
−1.5
−1
−0.5
1
1.5
2
2.5
(f)
Fig. 1. Time-domain signals and SVM results for data set 1. (a) Three channel data in time-domain: gas pressure of the first channel in the upper figure, C2 radical luminosity of the second channel in the middle figure, and global intensity of unfiltered light in the third channel in the lower figure. (b) Novelty scores generated by the combined SVM classifier. Threshold Hs = 0.1 is marked by the horizontal line. (c) Probabilities generated by the combined GMM classifier. Threshold Hg = 0.02 is marked by the horizontal line. (d)(e)(f) Contour plots of novelty scores generated by SVM classifers in the first, second and third channels respectively; support vectors are circled. In (b)(f), stable data for training, stable data for test, transient and unstable data for test, are shown by {× + ·} respectively.
8
In comparison to results obtained through application of a GMM-based approach, the SVM approach is shown to provide a robust early warning indication of unstable combustion, for both stable and unstable data.
7
Acknowledgement
The first author would like to thank David Clifton for his valuable discussions and comments.
References 1. Chen, Y., Zhou X.S., Huang, T.: One-class SVM for learning in image retrieval. IEEE ICIP, Thessaloniki, Greece (2001) (1) 34-37. 2. Daubechies, I.: Orthonormal bases of compactly supported wavelets. Comm. Pure and Appl. Math., 41 (1988) 909-996. 3. Gretton, A., Desobry, F.: On-line one-class support vector machines. An application to signal segmentation. IEEE ICASSP, Hong-Kong, China (April 2003). 4. Hardoon, D.R., Manevitz, L.M.: fMRI Analysis via One-class Machine Learning Techniques. 19th IJCAI, Edinburgh, UK (2005) 1604-1605. 5. Hayton, P., Tarassenko, L., Sch¨ olkopf, B., Anuzis, P.: Support Vector Novelty Detection Applied to Jet Engine Vibration Spectra. NIPS, London (2000) 946-952. 6. Kittler, J., Hatef, M., Duin, R., Matas, J.: On Combining Classifiers. IEEE Transactions on Pattern Analysis and Machine Intelligence, 20 (3) (1998) 226-239. 7. Kuncheva, L.I.: A theoretical study on six classifier fusion stragies. IEEE Transactions on Pattern Analysis and Machine Intelligence, 24 (2) (2002) 281-286. 8. Mallat, S.: A theory for multiresolution signal decomposition: the wavelet representation. IEEE Pattern Anal. and Machine Intell., 11 (1989) 674-693. 9. Ng, W.B., Clough, E., Syed, K.J., Zhang Y.: The combined investigation of the flame dynamics of an industrial gas turbine combustor using high-speed imaging and an optically integrated data collection method. Measurement Science and Tachnology, 15 (2004) 2303-2309. 10. Sch¨ olkopf, B., Platt, J., Shawe-Taylor, J., Smola A.J., Williamson R.C.: Estimating the support of a high-dimensional distribution. Neural Computation 13 (2001) 14431471. 11. Tax, D.M.J. and Duin, R.P.W.: Data domain description using support vectors. ESAN99, Brussels (1999) 251-256. 12. Vapnik, V.: The nature of Statistical Learning Theory. Second edition. Springer, NY (2000). 13. Wang, L., Yin, H.: Wavelet analysis in novelty detection for combustion image data. The 10th CACSC, Liverpool (2004) 79-82.