Technical Market Indicators Optimization using Evolutionary Algorithms P.Fernández-Blanco1, D.Bodas-Sagi1, F.Soltero1, J.I.Hidalgo1, 2
1
Ingeniería Técnica de Informática de Sistemas CES Felipe II de Aranjuez, UCM Capitán 39, 28300 Madrid, Spain +34918099200
2
Departamento de Arquitectura de Computadores Universidad Complutense de Madrid Calle del Profesor García Santesmases s/n 28040 Madrid, Spain +34913947537
[email protected],
[email protected],
[email protected],
[email protected]
ABSTRACT Real world stock markets predictions such as stock prices, unpredictability, and stock selection for portfolios, are challenging problems. Technical indicators are applied to interpret stock market trending and investing decision. The main difficulty of an indicator usage is deciding its appropriate parameter values, as number of days of the periods or quantity and kind of indicators. Each stock index, price or volatility series is different among the rest. In this work, Evolutionary Algorithms are proposed to discover correct indicator parameters in trading. In order to check this proposal the Moving Average ConvergenceDivergence (MACD) technical indicator has been selected. Preliminary results show that this technique could work well on stock index trending. Indexes are smoother and easier to predict than stock prices. Required future works should include several indicators and additional parameters.
Categories and Subject Descriptors J.4 [Social and behavioral Sciences]: Economics.
General Terms Design, Economics, Experimentation.
Keywords Finance, Optimization, Evolutionary Algorithms, Decision making, Stock market Data mining; Technical trading rules.
1. INTRODUCTION Within stock market, there are two approaches for stock price evolution analysis. In one hand it is the Fundamental Analysis. This form consists on bringing future prices through accountable and financial information of the company. Other data can be also considered, as company operation sector [15]. Permission to make digital or hard copies of all or part of this work for personal or classroom use is granted without fee provided that copies are not made or distributed for profit or commercial advantage and that copies bear this notice and the full citation on the first page. To copy otherwise, or republish, to post on servers or to redistribute to lists, requires prior specific permission and/or a fee. GECCO’08, July 12–16, 2008, Atlanta, Georgia, USA. Copyright 2008 ACM 978-1-60558-131-6/08/07 ...$5.00.
In the other hand, it is the Technical Analysis. Simplifying, this analysis will try to bring future stock price through technical indicators [16]. From the point of view of designing an automated system to stock market prediction and analysis, the most common solution is to turn to technical indicators, as the information needed is limited to stock price history of the value to be studied, while Fundamental Analysis requires, not only a better training from the user (it could be defined as an expert system), but also a wider data set, including accountable and financial information harder to obtain, with a reliability generally lower, due to different interpretations caused by self-interest of company policies. A technical indicator is a series of data points derived by applying a formula to the price data series. Price data includes any composition of the opening, high, low or closing values over a period of time. Some indicators require only the closing prices; others include volume, or any other kind of information into their formulae. Price data are included into the formula and every data point is produced by using the selected information. Any single data point does not offer much information and it is not enough to make an indicator. It is required to have a series of data points over a period of time to create valid reference points to allow analysis. By creating a series of data points along the time, a comparison can be made between present and past levels. For analysis purposes, technical indicators are usually shown in a graphical way above or below a price chart. Once graphically shown, an indicator can be compared with the corresponding price chart. A technical indicator offers a different perspective from which to analyze stock price evolution. It tries to capture the behavior, and sometimes, investor psychology. Some indicators, such as moving averages, are derived from simple formulae and their mechanics are not difficult to understand. Others, such as Stochastic, have more complex formulae and require a deeper study to obtain a good understanding of them. Regardless of the complexity of the formula, technical indicators can provide some clue to discover the future trending of price activity. Many investors and traders use indicators to predict the direction of future prices. Usually, indicators are classified in two big classes [3, 12]: oscillators or leading indicators, and lagging indicators. Leading indicators are designed to lead price movements. They represent a form of price momentum over a fixed look-back period, which is
the time lapse used to calculate the indicator. For example, a 20day Stochastic Oscillator would use the past 20 days of price action (about a month) in its calculation. All prior price action would be ignored. Some of the most popular leading indicators include Commodity Channel Index (CCI), Momentum, Relative Strength Index (RSI), Stochastic Oscillator and Williams %R [15]. The lagging indicators follow the price action and are commonly referred to as trend-following indicators. Trend-following indicators work best when markets develop strong trends. They are designed to get traders in and keep them in as long as the trend is intact. These indicators are not effective in neither trading nor sideways markets. If used in exchange markets, trendfollowing indicators will likely lead to many false signals and whipsaws. Some popular trend-following indicators include moving averages (exponential, simple, weighted, variable) and Moving Average Convergence-Divergence (MACD), the indicator picked in this paper to prove the proposed technique. Some Evolutionary Algorithms (EAs) have been previously used to discover new technical indicators [1] [2] [16], but in this work we will try to analyze the capability of EAs for tuning the indicator parameters. In this sense, we propose the use of an EA to obtain the set of indicators and their parameters, which should be used to predict a daily market value. Initially we have applied EAs to find the more suitable parameters of the MACD indicator for daily trading.
calculated in the 26-week and 12-week cycles of the stock market [16]. Commodity traders often use daily data with MACD but still use 26-period and 12-period exponential moving averages (EMA) in the analysis. Implications are that there are 26- and 12-day cycles in commodity markets. The market is in constant changing and nevertheless, the trading strategy and indicator parameters must change to fit the current market conditions. The use of the MACD indicator can be applied to almost any market at any time interval. Using this method is easy and straightforward. It can work well for any time lapse, both for long and middle terms and intraday trading systems.
2.1.1 Calculation of the MACD The MACD calculation is usually based on exponential moving averages, meaning that earlier points have less weight than latest ones (the investors usually remember better the last days and forget fast the past). This approach takes one more step - two MAs are subtracted, so that it is produced an oscillator-like indicator. "Like" means that it is oscillating around zero, however, it is not confined in the 0:1, or -1:1 corridor. It means that it can be used to generate signals, but not to find overbought or oversold conditions. A 26-day EMA is the first moving average and a 12-day EMA is the second one in a traditional MACD. The MACD line is formed by subtracting the long (first) moving average from the short (second) moving average. So, MACD = EMA (12) – EMA (26).
The rest of the paper is organized as follows. First of all, indicator MACD is explained. Second, there is an evolutionary algorithm description, followed by the experimental results. Finally the conclusions and future work are exposed.
A signal line is formed by smoothing the MACD line with a third EMA. The third moving average is usually a 9-day EMA. These three parameters define the MACD indicator and they will be three of the genes of chromosomes in the first implementation of the Evolutionary Algorithms.
2. TECHNICAL INDICATORS
The main buying and selling signals take place when the short curve of the MACD intersects with its moving average. The buying signals are generated when the short line of the MACD intersects in ascending form with the line of its moving average. While the line of the MACD is over its moving average it will be a buying position.
There are two main classes of indicators: trend indicators and oscillators. An oscillator is an indicator that fluctuates above and below a centerline or between set levels, as its value changes over time. Oscillators can be kept at extreme levels (overbought or oversold) for extended periods, but they cannot trend for a sustained period. In contrast, a security or a cumulative indicator like On-BalanceVolume (OBV) can trend indefinitely as it continually increases or decreases its value over a sustained period of time A simple moving average is an indicator that calculates the average stock price over a specified number of periods. If a security is exceptionally volatile, then a moving average will help data smoothness. A moving average filters out random noise and offers a smoother perspective of price activity. Veritas Software Corp., whose stock symbol is VRTS, displays a lot of volatility and an analyst may have difficulties in discerning a trend. By applying a 10-day simple moving average to the price action, random fluctuations are smoothed to make easier identifying a trend.
2.1 MACD indicator In this work it will be employed the moving average convergence-divergence MACD indicator, because it is one of the most often used indicators by the different stock trending simulator software. The MACD is usually conceived to be
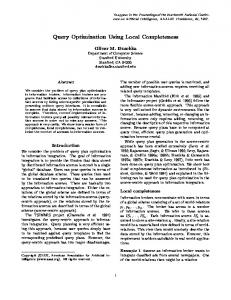
On the contrary a selling signal takes place when the short line of the MACD intersects in descending sense to its moving average. While the line of the MACD is below its moving average the selling position will be kept. In Figure 1, it is possible to see a chart constructed according to these instructions.
2.1.2Parameters of the MACD There are many trading systems that are using different periods for the fast and slow moving averages. 26 and 9 days is one of the most frequently used combinations as mentioned above, but usually people would perform an optimization trying to find the numbers that are the best for a particular stock. There are few ways of using MACD. First know-signals are generated when the line exceeds zero. Crossing from negative into the positive is considered a buying signal, while crossing from the positive to negative is considered a selling signal.
3. SELECTING INDICATORS AND THEIR PARAMETERS USING EAs. As an alternative to conventional optimization methods, Evolutionary Algorithms (EAs) offer the opportunity of getting satisfactory results with less computational cost and simple programming. A great number of EAs variants have been developed, during the last years for different problems [5, 8]. Their multiobjective variants, Multiobjective Evolutionary Algorithms (MOEAs) can be used to deal with the multiobjective nature of many real-life problems [16]. They are very useful in research that concern several indicators, including oscillators and trending simultaneously.
3.1 Genetic encoding
Figure 1. MACD sample in Merrill Lynch stock prices.
In this paper we propose the use of EAs for selecting the parameters of several indicators, although the initial experimentation has been made for an only indicator as is explained on the following sections. In order to explain the genetic encoding let us suppose we are going to use four indicators:
It can be also used indicator divergence. When the stock price is rising and MACD is falling (negative divergence), or vice versa, it can be considered a sign and can be used to predict changes within trend. That's right, the lagging indicator that is supposed to follow the price, is predicting the stock behavior. The main disadvantage of the MA and MACD indicators is the fact that they are following the price, rather than predicting it. This is correct if stock market is not changing fast (low volatility). When choosing the intervals for the fast and slow MAs, we are usually testing them against existing historical data for the stock. Now, if the stock behavior suddenly changes, the previous testing becomes useless. The indicator is useful if the price follows a trend [15]. In order to use buying and selling signals successfully, it is necessary to apply them when the trend is changing. In order to achieve it, it is necessary to have a trend to reverse. The indicators based on moving averages (MA) are not very useful in a situation when the price is moving sideways, or when the trend is not established yet. MA's (as many other tools of technical analysis) could be used not only with the prices of stocks, but also combine together with other indicators. The longer a moving average is, the slower it will react and fewer signals will be generated. As the moving average is shortened, it becomes faster and more volatile, increasing the number of false signals. It is up to each investor to select a time frame that suits his trading style and objectives. In stock market or other financial market systems, the technical trading rules are used widely to generate buying and selling alert signals. In each rule, there are many parameters. The users often would like to get the best signal series from the in-sample sets, (Here, the best means they can get the most profit, return or Sharpe Ratio, etc), but the best one will not be the best in the outof-sample sets. Sometimes, it does not work anymore. In this paper, the parameters set a sub-range value instead of a single value. In the sub-range, every value will give a better prediction in the out-of-sample sets. The improved result is robust, a very important feature [16] and has a better performance in experience.
•
Relative Strength Index (RSI)
•
Exponential Moving Averages (EMA)
•
Moving Average Convergence-Divergence (MACD)
•
Weighted Moving Average (WMA)
Then, the investor should select the number of parameters that must be set on each indicator. As an example, 3 parameters for MACD there will be used, 1 parameter for RSI, 2 parameters for EMA, and 3 for WMA. With this figures, our chromosome would be composed of four blocks of genes with a total number of 3+1+2+3=9 genes for representing an individual. The first block of genes would use 3 genes to represent the 3 parameters of MACD, the second block 1 for RSI parameter and so on. Also an additional gene named N has been included to represent the size of the time window, in other words, it is the amount of historical data of the analyzed stock price that will be considered in order to apply the indicators to that part of the data set. Any empiric test indicates, accordingly with everyday work, that results (profit strategy provides) of MACD indicator, even preserving the same parameters, are not the same if it is chosen a 100-day or a 300-day history. Sector professionals based on their experience, choose data size to consider according to the value studied, even to the macroeconomic or social ruling at the time when making the prediction. Consequently, it seems justified to include this gene (time window) within the subject, labeled as “amount of data considered”, in order to let the system itself try the most appropriate value for it. Table 1 represents an example of a chromosome. Table 1. Gene’s representation MACD Gen
12
26
RSI 9
14
EMA 20
50
5
WMA
N
20
20
100
3.2 Features of the EAs In this work, as a first approach, the EAs have represented only MACD parameter, so in this preliminary experimentation only 4 genes are considered. The first three correspond to MACD indicator own parameters, associated to mobile average lengths to consider. The last one will be the one explained above, in the previous section, and indicates the amount of historical data to consider. They have been implemented with Matlab. It has been chosen a panmitic, elitist, with tight linkage EA. They use selection, crossover and mutation operators, whose probabilities have been chosen following the results obtained in previous research [4, 6, 13]. It includes a local search operator to improve the solutions cyclically, avoiding local optima and providing diversity in the population [16]. Population size can be variable and immigrants could be admitted (some new individuals created randomly every generation), but usually it is fixed in a constant number of 10 individuals, preserving the best one at least. This small size is chosen based on previous works [1, 11], as appropriate to make fast the calculation but enough to maintain the diversity. Population is prevented from converging entirely. Such behavior is needed to adapt to dynamic fitness. The main features of the EAs are included in Table 2. Table 2. Evolutionary Algorithm Parameters Number of genes
4
Population size
10
Mutation probability
0.09
Crossover probability
0.8
Local search
Every 100 generations
3.3 Why EAs? The fitness of a technical indicator over a particular stock or index is dynamic. That is, it modifies when it is moved forward in time while maintaining a window of fixed length. Stocks show different trends at different times. Usually, an instance of a technical indicator that works well on a particular trend may fail when the fitness landscape changes. Thus, the optimization of technical indicators for trading must be adaptive to changes of the fitness, and create new instances of the indicator as needed. It could even be possible to be able to choose between different indicators, although the experiments conducted in this work do not take into account different indicators. To reach the adaptive behavior, the algorithm must be able to continue the search with its current states as the underlying fitness landscape changes to eliminate delays caused by restarts. First of all, the number of possible combinations for a single indicator may turn out not too high. From this point, it could be conclude that EAs application could not be necessary, as other exhaustive technique may be used. However, if trading is to be done for different time windows and in a very short time interval (a minute or smaller) and consult not a single, but several indicators, then EAs application makes sense.
A chart market tracking tool, which any financial organization provides, is able to operate at least with 20 indicators simultaneously. However, the parameters for these indicators must be manually chosen. Should the time window be at minute level or lesser, it is understood the inability to optimize all the indicators manually. Even for longer periods, any increase as short it could be, will be valuable, as it could be spent in data study and decision-making. While working in real-time, each time a new data is added to the series, the algorithm must recalculate the optimum parameter values for the indicator. In other words in MACD case, algorithm calculates how many data passed must be taken into account to calculate MACD own values in small periods (e.g. about 1 minute), meaning that the EA must be executed each minute to obtain both MACD graphs in order to make a choice In this first work, we have conducted the test with daily closing data, since they are free and most easily to obtain.
4. EXPERIMENTAL RESULTS The experiments have employed closing price data (From January 1, 2000 to December 31, 2005) of Dow Jones Industrial Average (DJIA) downloaded from [15]. As is well known, DJIA is one of the most important indexes of New York Stock Exchange (NYSE). It reflects the behavior of the price of the share of the 30 most important industrial and recognized companies of the United States. An index benefits from the diversification of the underlying stocks and is therefore smoother and easier to predict than stock prices. We have chosen this stock index, because its chart is smoother than others (this is because it groups 30 stock prices). In the current research stage, this last aspect must not constitute a problem. As the test should be improved the profit due to traders common strategies, its results will be extrapolated to studies of stock price evolution of any company. In addition, some banks are offering products based on the buying and selling of call and put options on the DJ, generating an equivalent product to the sale of shares of any company. These financial companies must analyze the value to minimize risk. The description of the test is as follows: in the first stage, a simplified version of the structure represented on Table 1 has been chosen. In this structure, the subject is composed of four elements. The first three pertains to typical MACD indicator parameters, mentioned in section 2.1, and the last one pertains to time window or period length (N). All the parameters are natural numbers. As mentioned, the aim is to optimize these parameters, in other words, finding which values achieve higher profits. There is a whole feasibility condition set (boundary conditions) that has been added to the algorithm. The first of them demands that historic length will be greater than 30. Day to day experience shows that applying MACD indicator strategy over a shorter period lead us at middle and long term to poor results. Only on values where ups and downs are scarce, and price trending is clear, the procedure could obtain more satisfactory results by using a period lesser than 30 data (equivalent to 30 day quotation in this example) Otherwise, indicator general theory, specifically MACD, establishes that from the three parameters second must be the greatest and the least the third. As expressed previously, MACD
pertains to the difference between moving averages of a closing stock data number equal to the first parameter and the moving averages of closing stock data number equal to the second. Subsequently, in order to get the cutline, calculate over the previous difference, another moving average from data number of the third parameter. Program coding discards any subject failing to comply with the detailed restrictions, as they are considered out of the feasible region. Fitness is calculated taking into account the maximum achievable profit. For example, there will be analyzed a period among January 1st, 2000 to December 31th 2000. In order to know the maximum achievable profit, it is obtained by buying at each minimum and selling at each maximum, this method must be lightly corrected. If a maximum is obtained before (i.e. a selling point), then a buying must be discounted to the first day closing price. Otherwise, if a minimum appears at the end (i.e. a buying point), a selling must be added to the last day closing price. Since it is impossible that two maxima or two minima are consecutive, this strategy assures that the number of sellings and buyings will be the same, and therefore the value obtained will be a reliable maximum profit. A defined strategy by represented parameters in a subject will provide a profit that will be, at best, similar to maximum profit, although usually smaller. Fitness associated to subject is maximum profit percentage which follows MACD. Supposing that maximum profit is 300 monetary units, and when constructing and interpreting MACD with subject reflected parameter, a 150 monetary unit profit is obtained, and fitness value will be 50%. Figure 2 is an example of MACD application.
MACD guides stock buying and selling, so provides an investment strategy. There are two ways of checking work quality. On one hand, we could compare parameters and profits from the best subjects and profits provided by MACD execution with usual parameters (12 and 26 for the two first mobile averages, and 9 for the last). However, this is not real, as professional and successful traders have, thanks to a long experience, a different parameter set for each value they operate. In fact, some of them jealously protect their “investment secrets”. The second choice is to compare MACD strategy results which mark a specific subject with any other accepted strategy. In this first stage of the research Buy & Hold strategy has been chosen because of its simplicity. This strategy implies to buy at the start of the period and sell at its end. Certainly, making comparisons against more evolved strategies is required. This work is part of the future research. Table 3 shows a summary of the best subject obtained, with their parameters and a profit percentage which provide the maximum profit. The last value pertains with the profit which would obtained by applying Buy & Hold strategy. Table 3 shows only the 15 best individuals. For statistical results, all obtained best individuals in a hundred iterations and their respective profits are analyzed. An average value near 50% is obtained with the MACD parameter optimization by using EAs (a 50% of the maximum obtainable profit is achieved).
Figure 2. Stock price example and MACD application for a set of 100 days data. From observation/day 34 to 100.
Table 4. Significance of the experiments
Table 3. Experimental results Number Parameter Parameter Parameter of data 1 2 3 336
10
47
5
% Profit MACD
% Profit Buy and Hold
91,36
68,69
Mean profit
Standard deviation
Random
21,79%
14,71
50%
14,15
30%
25
434
24
32
19
90,26
56,256
EAs
343
21
28
11
87,16
15,397
Buy&Hold
154
17
43
8
80,42
81,198
319
22
49
19
79,57
77,913
325
7
21
3
75,34
49,146
422
22
46
14
74,94
-0,23734
309
17
47
4
73,09
88,703
312
7
22
6
71,27
47,299
307
21
29
13
71,16
9,7056
228
22
33
12
70,97
80,283
424
21
35
15
70,7
49,176
382
20
38
5
70,60
42,269
231
20
39
17
68,02
75,29
439
22
50
8
67,08
47,984
Figure 3. Means and standard deviations of MACD optimized with EAs, Buy and hold Strategy and random parameter generation.
Standard deviation of the results is 14,15%. Buy & Hold strategy does not provide, in average, a profit greater than 30%. Standard deviation exceeds 25%. Consequently with the data, we can say that a strategy based on MACD parameters optimization by EAs provide greater profits than MACD strategy. In addition and in every case, typical MACD strategy based in parameters 12, 26, 9 was analyzed, as it was explained above. It can be concluded that MACD parameter optimization by using EA’s improves typical MACD strategy.
Results obtained through both procedures are subject to a Student test to check statistical relevance, obtaining a test value of 6,45071 x 10⁻²⁴. This shows that there is statistical relevance and consequently, EAs application improves the results significantly against random parameter generation.
The next step is to determine evolutionary process importance. Are EAs decisive in the process? In other words, it will be supposed that during x iterations, the four parameters which are required to calculate MACD strategy results are generated according a uniform distribution. If the four values randomly generated are within feasible region, they meet previously explained restrictions. We calculate the percentage among maximum profit MACD provides, and the one among maximum profit Buy & Hold provides in the same period. This procedure is repeated until a hundred vectors is obtained, each of one containing four parameters which meet restrictions, the percentage profit among maximum MACD strategy profit, and the percentage profit among maximum Buy & Hold one. If EAs are decisive in the process, in other words, if the results obtained by them are not random, parameter set statistical relevance obtained through EAs must be greater than parameter set statistical relevance randomly obtained. As expected, random parameter generation produces, in average, a percentage profit among maximum profit of 21,79% and a standard deviation of 14,71%. We are far beyond the 50% over maximum profit achieved by applying EAs. Study summary about relevance is shown in Table 4 and in Figure 3.
5. CONCLUSIONS AND FUTURE WORK
To confirm results, the procedure described for random parameter generation and t-Student contrast, a 15 time execution has been carried out, obtaining similar results on each one.
Several statistic works justify use of technical indicators for stock trading. One of the best, according to statistical results is Moving Average Convergence Divergence (MACD). However and as we have proved, parameters of technical indicators can be improved with Evolutionary Algorithms. Good profit (compared against Buy and Hold) gained by the instances of technical indicator produced by Evolutionary Algorithms suggests that it is a good approximation to the ideal solutions for daily trading. While the framework proposed for technical indicator construction using Evolutionary Algorithm was introduced in the context of the MACD indicator, it may be conveniently used for constructing other technical indicators by introducing appropriate chromosome representations for the intended indicators. There are two main tasks to be undertaken in successive project stages. First, encouraged by experimentation success expound in this article, more technical indicators will be added to the subject, facing full experimentation with the structure reflected in Table 1. Secondly, some of the authors [15], suggest that results can be improved by applying the same procedure, but carrying out a prior data association, so optimization will not be uniformly distributed among the whole history available, but prior
classification will be made according to trending, volume, etc., and the algorithm will not mix historical data from two different associations in the same execution. The viability and usefulness of this changing is something to be proven within the exposed context.
6.ACKNOWLEDGMENTS This work has been partially supported by INTERLIGARE Institute for Innovation in Intelligence (I4), by Spanish Government Research Grants. CICYT TIN2005-5619 and MEC Consolider Ingenio 2010 2007/2011 of the Spanish Council of Science and Technology, and by Logos4you Company. We also thank Dr. Christopher D. Clack and the anonymous reviewers for all their helpful and constructive comments.
7. REFERENCES [1] Allen F., Karjalainen R. Using Genetic Algorithms to Find Technical Trading Rules. Journal of Financial Economics. Vol 5. Pp. 245-275. 1999 [2] Arifovic J., Evolutionary Algorithms in Macroeconomic Models. Macroeconomic Dynamics, Cambridge University Press, vol. 4(3), pags. 373-414, September 2000. [3] Cvetkovic, D. Evolutionary Multi-Objective Decision Support Systems for Conceptual Design. Ph.D. Thesis. University of Plymouth, 2000. [4] Coello Coello, C.A. (1999). An Updated Survey of GABased Multiobjective Optimization Techniques. ACM Computing Surveys. Vol. 32. n 2. June 2000, 109-143. [5] Elder, Alexander. Trading for a Living: Psychology, Trading Tactics, Money Management. Publisher: John Wiley & Sons Inc, April 1993. [6] Fernández-Blanco, P. Study of Evolutionary Algorithms as Heuristic for Industrial Processes optimization (in Spanish). PhD, Thesis, Universidad Complutense de Madrid, 2004.
[7] Goldberg, D.E. (1989). Genetic Algorithms in Search, Optimization and Machine Learning. Addison-Wesley Publishing Co., Inc., Redwood City, Ca. [8] Harik, G. Cantú-Paz, E., Goldberg, D.E. y Miller, B. The gambler’s ruin problem, genetic algorithms, and the sizing of populations. Evolutionary Computation vol.7, n 3, 1999. [9] http://finance.yahoo.com [10] Michalewicz, Z. (1999). Genetic Algorithm + Data Structures = Evolution Programs. 3rd Edition. [11] Murphy, John. Technical Analysis of the Financial Markets. New York Institute of Finance. 1999. [12] Reilly, Frank K., Investment Analysis and Portfolio Management. Driden Ed. Chicago, III. USA, 1989. [13] Schaffer, J.D. ed. Proceedings of the Third International Conference on Genetic Algorithms, Morgan Kaufmann, 1989. [14] Schwager, J. D. Technical Analysis on Futures. John Wiley & Sons, 1996. [15] Spears, W.M. The Role of Mutation and Recombination in Evolutionary Algorithms. PhD, Thesis, George Mason University, Fairfax, Virginia, 1998. [16] Yan, W. and Clack, C.D. Evolving Robust Solutions for Hedge Fund Stock Selection in Emerging Markets. GECCO’07, London, England, United Kingdom, ACM 9781-59593-697-3/07/0007. [17] Yap, B. et al. Technical Indication Generation = Trend Classification + Genetic Algorithm. TRC1/05. University of Singapore, January 2005.