University of South Florida
Scholar Commons @USF Theses and Dissertations
6-1-2008
Temporal and spatial patterns in optical properties of colored dissolved organic matter on florida's gulf coast: Shelf to stream to aquifer Robyn Nicole Conmy University of South Florida
Scholar Commons Citation Conmy, Robyn Nicole, "Temporal and spatial patterns in optical properties of colored dissolved organic matter on florida's gulf coast: Shelf to stream to aquifer" (2008). Theses and Dissertations. Paper 187. http://scholarcommons.usf.edu/etd/187
This Dissertation is brought to you for free and open access by Scholar Commons @USF. It has been accepted for inclusion in Theses and Dissertations by an authorized administrator of Scholar Commons @USF. For more information, please contact
[email protected].
Temporal and Spatial Patterns in Optical Properties of Colored Dissolved Organic Matter on Florida’s Gulf Coast: Shelf to Stream to Aquifer
by
Robyn Nicole Conmy
A dissertation in partial fulfillment of the requirements for the degree of Doctor of Philosophy College of Marine Science University of South Florida
Major Professor: Paula G. Coble, Ph.D. Kendall L. Carder, Ph.D. Cynthia A. Heil, Ph.D. Mark E. Luther, Ph.D. Ashanti J. Pyrtle, Ph.D.
Date of Approval March 31, 2008
Keywords: Dissolved Organic Carbon, fluorescence, West Florida Shelf, groundwater © Copyright 2008, Robyn Conmy
TABLE OF CONTENTS
List of Tables ...................................................................................................................... ii List of Figures .................................................................................................................... iii List of Acronyms ............................................................................................................... ix Abstract ............................................................................................................................... x Preface............................................................................................................................... xii General Introduction ............................................................................................................1 Part I. Spatial distribution of CDOM on the southern West Florida Shelf Introduction..............................................................................................................5 Methodology ............................................................................................................9 Results and Discussion ..........................................................................................14 Conclusions............................................................................................................48 Part II. CDOM optical properties in Florida’s Gulf Coast riversheds: A regional comparison Introduction............................................................................................................51 Methodology ..........................................................................................................53 Results and Discussion ..........................................................................................56 Conclusions............................................................................................................75 Part III. Characterization of subsurface terrestrial CDOM sources to Tampa Bay, Florida Introduction............................................................................................................77 Methodology ..........................................................................................................81 Results and Discussion ..........................................................................................88 Conclusions..........................................................................................................101 General Conclusions ........................................................................................................102 Literature Cited ................................................................................................................104 Appendices Appendix I ...........................................................................................................113 Appendix II ..........................................................................................................117
i
LIST OF TABLES
Table 1.1. Date of WFS field experiments along with USGS and CHNEP discharge and flow classifications .................................................................15
Table 1.2. Absorption data for the water types shown in Figure 1.10 ..............................34
Table 1.3. Table 1.3. Peak positions and intensities for EEMs shown in Figure 1.17 ...................................................................................................................40
Table 1.4. EEM peak positions previously found by Coble, 1996 ....................................41
Table 2.1. Locations (GPS positions and landmarks) of river samples. ............................55
Table 3.1. Location and environmental data for groundwater wells in the Tampa Bay region..................................................................................................84
Table 3.2. Location and environmental data for surface samples in the Tampa Bay Estuary............................................................................................89
ii
LIST OF FIGURES
Figure 1.1. Map of West Florida Shelf in the Gulf of Mexico ...........................................7
Figure 1.2. Results of freezing experiment to determine if a loss of chromophores were apparent in absorption spectra ................................................10
Figure 1.3. CDOM fluorescence at Ex/Em 300/430 nm for seasonal cruises on the West Florida Shelf. ...............................................................................14
Figure 1.4. River discharge data from the Bartow Station (Source: USGS) ....................15
Figure 1.5. COM Spatial distributions on the West Florida Shelf....................................18
Figure 1.6. Salinity spatial distributions for seasonal cruises on the West Florida Shelf .................................................................................................19
Figure 1.7. Maps of currents and wind data from buoys operated by USF - Ocean Circulation Group (http://ocg7.marine.usf.edu/~liu) ........................20
Figure 1.8A. Enhanced RGB (R: 551,G: 488,B: 443nm) (top panels) for three days in August 2004 around the time of the passing of Hurricane Charley........................................................................................................21
Figure 1.8B. Imagery of CHL with the removal of gelbstoff (top panels) and adg443 (bottom panels) for three days in August 2004 around the iii
time of the passing of Hurricane Charley ....................................................................23
Figure 1.9. Maps of currents and wind data from buoys operated by USF - Ocean Circulation Group (http://ocg7.marine.usf.edu/~liu) .............................24
Figure 1.10A. Enhanced RGB (R: 551, G: 488, B: 443nm) (top panels) for two days in December 2004. ..................................................................................25
Figure 1.10B. Imagery of CHL with the removal of gelbstoff (top panels) and adg443 (bottom panels) for two days in December 2004 .....................................26
Figure 1.11. Karenia brevis cell concentrations from FL-FWCC plotted on top of the COM fluorescence spatial maps shown previously................................27
Figure 1.12. Maps of currents and wind data from buoys operated by USF - Ocean Circulation Group (http://ocg7.marine.usf.edu/~liu). ............................29
Figure 1.13A. Enhanced RGB (R: 551,G: 488,B: 443nm) (top panels) for two days pre and post-Hurricane Wilma................................................................30
Figure 1.13B. Imagery of CHL with the removal of gelbstoff (top panels) and adg443 (bottom panels) for two days pre and post-hurricane Wilma...................................................................................................31
Figure 1.14. Relationship of CDOM fluorescence to absorption at 312 and 440 nm for all cruises on the West Florida Shelf...........................................32
Figure 1.15. Absorption spectra for different water types sampled during cruises to the West Florida Shelf......................................................................33
iv
Figure 1.16. Spectral slope values for seasonal cruises on the West Florida Shelf.................................................................................................................35
Figure 1.17A. Excitation Emission Matrices (EMS) for three water types on the West Florida Shelf.. .......................................................................37
Figure 1.17B. EEMS for water after the passage of Hurricanes Wilma (top) and Charley (bottom) ..............................................................................38
Figure 1.17C. EEMS for water before (top) and after (bottom) the passage of the December 2004 storm event...........................................................39
Figure 1.18. Position of fluorescence maxima for Humic Peak M for West Florida Shelf waters.. .......................................................................42
Figure 1.19. Spatial distributions of Humic Peak M position for seasonal cruises on the West Florida Shelf..................................................................44
Figure 1.20. Ratio of Humic Peaks A and C/M as a function of CDOM fluorescence intensity and salinity for all field experiments. .........................45
Figure 1.21. The relationship between Dissolved Organic Carbon (DOC) and CDOM fluorescence on the West Florida Shelf. ............................................................................................................................46
Figure 1.22. Spatial distributions of DOC on the West Florida Shelf.................................................................................................................47
Figure 2.1. Map showing locations of the rivers sampled in Florida (top) and in Louisiana & Mississippi (right) ...................................................54 v
Figure 2.2. CDOM fluorescence at Ex/Em 300/430 nm for ten rivers that supply the Eastern Gulf of Mexico .............................................................56
Figure 2.3. CDOM fluorescence at Ex/Em 300/430 nm for Tampa Bay rivers .....................................................................................................................57
Figure 2.4A. Histograms of fluorescence intensity, absorption coefficient and fluorescence efficiencies for all rivers ................................................59
Figure 2.4B. Histograms of DOC concentration, position of Humic Peak C maximum and fluorescence ratios for all rivers. .................................60
Figure 2.5. CDOM fluorescence at Ex/Em 300/430 nm as a function of absorption coefficient at 312 nm...............................................................61
Figure 2.6. CDOM fluorescence at Ex/Em 300/430 nm as a function of absorption coefficient at 312 nm for Charlotte Harbor Rivers and Manatee River in Tampa Bay ....................................................................62
Figure 2.7. The relationship between CDOM fluorescence and DOC for river and West Florida Shelf waters for all seasons sampled.................................64
Figure 2.8. The relationship between CDOM fluorescence and DOC for Tampa Bay (top), Charlotte Harbor and Shark Rivers (bottom)............................65
Figure 2.9A. EEMs contours for rivers taken at zero salinity during dry season .........................................................................................................67
Figure 2.9B. EEMs contours for rivers taken at zero salinity during dry season .............68 vi
Figure 2.10. Position of Humic Peak C maximum as a function of salinity for river and West Florida Shelf waters for all seasons sampled. .......................................................................................................................69
Figure 2.11. Normalized emission spectra at Ex = 300nm for all rivers ..........................70
Figure 2.12. Spatial distribution of COM in an urban locale (left) and natural locale (right) in the Hillsborough River...........................................................72
Figure 2.13. Historical time series of color at the mouth of the Alafia River in Tampa Bay (top) .................................................................................74
Figure 3.1. Map of Tampa Bay showing calcium carbonate content (left), total organic carbon content (middle), and major sediment facies (right) in bottom sediments......................................................80
Figure 3.2. Hydrogeologic framework of Florida depicting the three main zones of the Florida aquifer system ...........................................................81
Figure 3.3. Map of Tampa Bay denoting sampling locations within the estuary (closed circles) and well locations surrounding Tampa Bay (closed triangles are aquifers deeper than 130 ft, open triangles are aquifers shallower than130 ft) ........................................................82
Figure 3.4. Uranium-Thorium decay series .......................................................................87
Figure 3.5. CDOM fluorescence intensity as a function of salinity for estuary, river, and groundwater samples in Tampa Bay during March-April 2006 .....................................................................................88
vii
Figure 3.6. Spatial distributions of salinity, CDOM, and Ra-226 in Tampa Bay ..................................................................................................93
Figure 3.7. Relationship between Dissolved Organic Carbon concentration and CDOM fluorescence intensity ........................................................94
Figure 3.8. EEMS of CDOM in the Manatee River, Tampa Bay estuary, Gulf of Mexico, surficial aquifer and deep Floridan aquifer ..........................................................................................................................95
Figure 3.9. Position of Humic Peak C/M for groundwater, river water and estuary water.......................................................................................96
Figure 3.10. Normalized emission scans at Excitation = 300 nm.....................................97
Figure 3.11. CDOM fluorescence ratio for groundwater, river water and estuary water.......................................................................................98
Figure 3.12. Fluorescence ratio as indicator of groundwater. Red contours suggest CDOM derived from surface terrestrial environments. ..................................99
viii
LIST OF ACRONYMS
Adg443
Absorption due to gelbstoff and detritus at 443 nm
CDOM
Colored Dissolved Organic Matter
CHL
Chlorophyll a concentrations
COM
Colored Organic Matter
DOC
Dissolved Organic Carbon
EEM
Excitation Emission Matrix
ERGB
Enhanced Red / Green / Blue True Color Imagery
Ex/Em
Excitation / Emission Wavelength Pair
FDOM
Fluorescent Dissolved Organic Matter
FLH
Fluorescence Line Height
QSE
Quinine Sulfate Equivalents
PCU
Platinum Cobalt Units
USGS
United States Geological Survey
WFS
West Florida Shelf
NEP
National Estuary Program
ix
Temporal and Spatial Patterns in Optical Properties of Colored Dissolved Organic Matter on Florida’s Gulf Coast: Shelf to Stream to Aquifer
Robyn Nicole Conmy
ABSTRACT
Characterization of Colored Dissolved Organic Matter (CDOM) in surface and ground waters in South Florida was conducted using fluorescence and absorption spectroscopy. Waters of the West Florida Shelf are heavily influenced by many river systems on Florida’s Gulf Coast that, to the first order control CDOM distributions on the shelf. Seasonal surveys revealed that changes in the underwater light field as a result of major hurricanes and resuspension events are linked closely with a number of factors prior to a storm’s passing such as the presence of persistant blooms, rainfall and discharge. Additionally, storm track and wind direction were found to play a significant role in CDOM signatures.
A study of ten riversheds located between the Mississippi / Atchafalya River system and the Shark River in the Everglades revealed a wide range in CDOM seasonality. A regional dependence of CDOM was also found, where highest aromaticity and concentration of organic material was found for the southernmost watersheds. Basin characteristics, vegetation differences, land use and climatic patterns are implicated in the cause for regional differences. In addition to surface flow, organic material in groundwater was measured in deep and shallow aquifers surrounding the Tampa Bay Estuary. As a result of strong hydrologic links between shallow aquifers and the overlying surface waters, CDOM in both reservoirs were found to be quite similar. Deep x
aquifers (> 150 ft) however are less concentrated and have CDOM signatures more similar to marine waters. This suggests similar biogeochemical pathways of the material, including the influence of the aquatic microbial community. Furthermore, multi-spectral CDOM fluorescence measurements were shown to be a potential indicator of groundwater presence in Tampa Bay during times of low surficial discharge to the bay, and when some rivers are almost entirely spring-fed.
Investigating CDOM distribution and signatures is vital to carbon budget and cycling questions. The amount and quality of organic material has significant implications for ecosystems, thereby affecting organisms that use CDOM as a food source, light availability for photosynthesis, UV shading provided to biota, satellite estimates of chlorophyll a, metal binding, materials transport and overall water quality.
xi
PREFACE
I am forever indebted to a great many people who helped make this dissertation possible. Completion of this work would not have occurred if it weren’t for the financial support of the USGS-USF Cooperative Agreement and NASA Earth Systems Science Fellowships. I would like to thank the crew of R/V Suncoaster and F.G. Walton Smith, staff of Keys Marine Lab, HAB researchers at FWCC, and the lab group of Peter Ortner at NOAA / AOML for the complementary ship time, assistance with sample collection and the wonderful times at sea. I owe a great deal of gratitude to SWFWMD for not only access to ground water wells, but who also provided an amazing field technician, Bob Brady, to go sampling and lift equipment for a very pregnant student. I am especially grateful to Roxanne Hastings for being there every step of the way: road trips, sample collection, sample analysis, data processing, being a sounding board and a wonderful labmate.
For providing data and/or images that supported the findings of this work, I would like to thank Jennifer Cannizzaro, Barnali Dixon, Inia Soto, Chuanmin Hu and Steve Meyers. I am grateful to Eric Steimle, Andy Casper, Mike Hall and Tim Elliott for the opportunity to use the GSV in the Hillsborough River. Greta Klungness, I can’t thank you enough for making GIS maps, substituting on cruise and being a trusted colleague and friend. Thanks to Jim Krest, Donny Smoak, Charlotte Clayton, and Erik Oij for analyses, use of facilities, insightful conversations and answering so many questions regarding radionuclides. To the College of Marine Science administrative staff, thank you for keeping the science running smoothly. Thank you, St. Francis of Assisi for a quiet library to prepare for my comprehensive exams.
xii
To my advisor, Paula Coble, you have made my journey through graduate school better than any of my expectations. Your endless support, your confidence and your trust in me means a great deal. Special gratitude is extended to my graduate committee, Ken Carder, Cindy Heil, Mark Luther and Ashanti Pyrtle for their insight and guidance. And to my chair, David Hastings, thank you for agreeing to last minute requests. To my friends and family at the College of Marine Science, you were always there to discuss science and life –you have made me and this project all that more complete.
To my family and friends, thank you for believing in me and helping me to achieve my goals. Especially to my father who even came out on the boat in the Everglades and helped with groundwater sampling. As always, thank you Maddy and Ebby for resting at my feet during the writing of this dissertation. Thank you to my daughters, Sage Macy and Aris Sofia for tolerating all the field sampling (in or out of the womb) and for keeping me company while analyzing samples. My dearest Drew, I can’t begin to thank you for all that you do for me. Your love and support means the world and I am so appreciative of the time we have had, and will have together. It is to you that this work is dedicated.
Finally, thank you Arth Guinness for your beautiful creation and your inspiring philanthropic ways.
xiii
GENERAL INTRODUCTION
Dissolved Organic Matter (DOM) is the largest fraction of organic carbon in oceanic and estuarine waters (Williams and Druffel, 1988), therefore an important reservoir and an integral component of the global carbon cycle. Much of the DOM in the coastal environment originates from the breakdown of terrestrial plants, which is transported to the ocean via rivers (Duursma, 1974; Laane, 1981; Berger et al., 1984; Hayase et al., 1987). Due to the chemical complexity of this material, this pool even today is approximately 80% uncharacterized at the molecular level (Hilf and Tuszynski, 1990).
Many studies have been dedicated to deciphering the sources and biogeochemical pathways of organic carbon in aquatic environments (Chen and Gardner, 2004; Del Castillo, 2005 and refs. therein). The quality and quantity of the material reflects information about its sources, affect on water quality and clarity, and ability to transport other dissolved materials through watersheds. Of particular interest is the study of Colored Dissolved Organic Matter (CDOM). This is the portion of the DOM pool that is chromophoric, absorbing radiation in the ultraviolet and visible portions of the spectrum. A significant fraction of DOM is photoreactive, and therefore can be easily measured with optical techniques, as compared to the remainder of the DOM pool, which requires labor intensive practices.
There have been many names used to describe CDOM. Kalle (1966) first coined the phrase ‘gelbstoff’ to describe the organic matter that gave waters a yellow-brown color. Other names used in the literature include yellow matter, humics, fulvics or gilvin (Kirk, 1994). The abundance of terms to describe the material is an indication of the complex mixture of compounds that comprise the pool. CDOM also has distinctive optical 1
properties, a multitude of sources and undergoes a variety of chemical, biological and physical processes in estuaries and ocean waters (Cabaniss and Shuman, 1987; Donard et al., 1989; Cauwet et al., 1990; Coble et al., 1990; Blough et al., 1993; Coble, 1996).
These optical properties may be used to distinguish possible sources, as well as to determine the composition of the material. The major source to coastal waters is from river runoff of humic substances from soils, such as humic acids and fulvic acids. This allochthonous gelbstoff dominates DOM composition in nearshore waters (Duursma, 1974; Laane, 1981; Berger et al., 1984; Hayase et al., 1987). Away from the coast, however, CDOM is of marine origin from biological processes such as autotrophic productivity, zooplankton feeding and bacterial interactions. Biological productivity is an autochthonous source of CDOM, a crucial component of new dissolved material in the oceans (Yentsch and Reichert, 1961; Traganza, 1969; Carlson and Mayer, 1983; Chen, 1992; Coble, 1996). Changes in the spectral properties have also been observed during the transition of early to late phytoplankton bloom periods (Carder et al., 1989), where protein signatures are found in the water column and underlying sediments in regions of recent biological production.
The major destructive pathway for gelbstoff has been shown to be degradation by sunlight (Kieber et al., 1990; Mopper et al., 1991), which is also known to cause alteration of Dissolved Organic Carbon (DOC) composition. Several studies have demonstrated that exposure to sunlight degrades larger molecules into smaller photoproducts that are removed from the DOM pool. The removal is via two routes; through direct volatilization of carbon gases, such as CO and CO2, and through rapid microbial consumption of labile photoproducts (Kieber et al., 1990; Mopper et al., 1991; Valentine and Zepp, 1993; Miller and Zepp, 1995, Miller and Moran, 1997). Photodegradation has been shown to alter the optical properties of CDOM by reducing color, resulting in new spectral signatures.
2
In the coastal environments, CDOM measurements are used for many purposes. It is conservative with respect to salinity (Cabaniss and Shuman, 1987) and can be used to track water masses (Del Castillo et al., 1999,2001; Kowalczuk et al.,2003; Stedmon et al., 2003; Chen et al., 2004; Conmy et al., 2004b; Nelson et al., 2007). Color is routinely measured by monitoring and management agencies as it is a measure of ecosystem health and CDOM fluorescence intensity has been shown to be a reliable proxy for Dissolved Organic Carbon (DOC) in some regions (Ferrari et al., 1996; Vodacek et al., 1997; Del Castillo et al.,1999, Baker and Spencer, 2004, Del Castillo 2005). Furthermore, CDOM can be measured remotely, and its presence interferes with remotely sensed determinations of chlorophyll a in the surface ocean (Carder et al., 1989; Muller-Karger et al., 1989). CDOM spectra have been shown to vary widely by region due to differences in chemical composition (Blough et al., 1993) and a better understanding of its optical properties and chemical characteristics is needed for the improvement of bio-optical algorithms, especially in coastal waters.
Presented in this dissertation are the results of a study examining CDOM characterization and distribution on the WFS, in coastal riversheds, the Tampa Bay Estuary and the Florida Aquifer system. The optical properties of CDOM, such as absorption coefficients, fluorescence intensities and ratios (Del Castillo et al., 2001), position of the emission maxima at varying excitation wavelengths (Coble, 1996), spectral slopes (Blough et al., 1993), and apparent fluorescence efficiencies were used to distinguish sources, establish seasonality and infer composition of the organic material in these aquatic environments. Findings were subsequently compared to discharge patterns and specific watershed basin characteristics to explain patterns.
3
PART I:
Spatial distribution of CDOM on the southern West Florida Shelf.
4
INTRODUCTION Dissolved Organic Matter (DOM) in seawater is the largest reactive reservoir of carbon on earth (Hedges, 1992). Contained within it is the photochemically active fraction, CDOM, which mediates the sunlit-induced reactions of non-living systems. This material plays important roles in the marine environment, affecting primary productivity by determining the quality and quantity of sunlight available for photosynthesis. CDOM also provides UV shading and nutrients to marine biota, and scavenges pollutants and metals, all of which influence biological production (Aiken, 2002; Hansell, 2002 and the refs. therein). Additionally, interference by CDOM with remotely sensed ocean color measurements, make it challenging to retrieve accurate chlorophyll a (CHL) concentrations in the world’s oceans (Carder et al., 1989; Muller-Karger et al., 1989; Hu et al., 2003; Del Castillo, 2005).
In addition to being an important factor controlling light penetration in coastal waters, CDOM is also important for the study of global ocean carbon budgets because it is the only component of DOM that can be measured with in situ and remote sensors. This has significant implications, because establishing regional relationships between DOC and CDOM allows for making estimates of the larger organic carbon pool, based on a smaller, easier to measure component. Furthermore, because CDOM appears to have longer residence times than time scales of most estuarine and coastal mixing processes, it represents a significant portion of DOM that is exported to the open ocean.
Longer time scales also mean that CDOM is an ideal water mass tracer and can be used to examine circulation in coastal and open ocean environments (Del Castillo et al., 1999,2001; Kowalczuk et al.,2003; Stedmon et al., 2003; Chen et al., 2004; Conmy et al., 2004b; Nelson et al., 2007). In particular, this is important in regions with complex mixing of marine and terrestrial organic material, where strong gradients exist in chemical and optical properties of CDOM (Del Castillo, 2005). This is the case on the West Florida Shelf (WFS), where the dominant source is terrestrial in nature, which originates from the many rivers on the eastern margin of the Gulf of Mexico, but ever 5
present is also the organic material of a marine source. There is a critical need not only to identify the source of CDOM in the coastal ocean, but also, to understand how its optical properties are changing as mixing occurs on the shelf. Linking the primary factors that determine the distribution of CDOM on river-dominated margins (seasonal currents, precipitation, river discharge, winds, storms, etc.) with the properties themselves will allow for untangling the ambiguities regarding the cycling and fate of organic material in the ocean. This in turn could make possible predictive capabilities of DOM concentrations in coastal environments.
Investigated in this chapter are the spatial distributions of CDOM in the southern portion of the West Florida Shelf (WFS) between Tampa Bay and Florida Bay over a three year period. Seasonal differences were observed using discrete and in situ sampling techniques (a WetLabs’ SAFIre-Spectral Absorption and Fluorescence Instrument for underway mapping) to generate spatial maps. Differences in the optical properties of CDOM were used to infer differences in the composition of organic material.
Results from this project advance the study of CDOM in coastal environments by (1) providing valuable in field measurements of spectral slopes and fluorescence to absorption relationships for ocean color bio-optical algorithms. This information helps to retrieve more accurate regional estimates of seasonal primary productivity. (2) Assessing variability in the relationship between CDOM and DOC in shelf environments during periods of high and low river discharge. (3) Demonstrating the manner in which CDOM is affected by local forcing of winds, currents, storms, discharge.
Geographic Setting The West Florida Shelf (Figure 1.1) is located in the eastern portion of the Gulf of Mexico. It is marked by a large shelf width as a result of the gentle sloping of the inner shelf. The WFS is a river-dominated environment, where freshwater enters from various river sources along the northern and eastern margins of the Gulf. Seasonality of riverine discharge, where northern rivers peak in spring and the southern Everglades rivers peak 6
Figure 1.1. Map of West Florida Shelf in the Gulf of Mexico. The black square highlights the study location between Tampa Bay and the Florida Keys. in summer, gives rise to temporal and spatial differences in the contribution of freshwater and materials (ie. metals, nutrients, organic matter, suspended sediments) throughout the year on the shelf. In addition, unique environments of the head waters result in compositional differences amongst rivers, including rivers that are controlled by dams or gates (Mississippi, Hillsborough, Calooshatchee) or ones that are swamp-fed (Atchafalaya, Suwannee, Shark) or ones that traverse agricultural lands (Peace). These are just some of the factors that influence the amount and type of freshwater making it to the WFS.
Once on the shelf, materials originating from freshwater environments are mixed with those from marine waters. Seasonal patterns in winds and currents then impact the distribution of said material in these coastal waters, where dominant forcing is to the south from October-April and to the north in summer months (Weisberg et al., 2005). Additionally, intermittent weather phenomena, such as hurricanes, tropical storms and 7
winter storm events also influence substances in shelf waters, and can result in the resuspension of sediments and dissolved material into the water column. Distributions of productivity-critical substances such as nutrients, metals, organics and particles are also affected by weather phenomena. It is these distributions that are key in determining if, what type, and where phytoplankton blooms occur on the shelf. This is particularly important on the WFS, where Karenia brevis, a toxic dinoflagellate, blooms nearly annually (late fall to winter) causing red tides that affect the coastal ecosystem. Two of the field experiments (December 2004 and November 2005) presented in Part I of this dissertation were conducted during times of Harmful Algal Blooms (HABs) of K. brevis. The active 2004 hurricane season has been proposed as a contributing factor to the persistent blooms that initiated in Fall 2004 (Hu et al., 2006). The bloom moved south from the Charlotte Harbor region in October to the Florida Bay and Keys region, where high cell concentrations were observed in November 2004. In January 2005, high counts were also observed 30 mi offshore of Florida’s west coast. In April-May 2005, field measurements showed diminished cell concentrations, satellite imagery using a K. brevisclassification criteria (Cannizzaro et al., 2008) showed the bloom moved north and was never sampled. The bloom reappeared between Tampa Bay and Charlotte Harbor in July-August 2005 and cell concentrations continued to increase through November 2005. The bloom finally diminished in December 2005.
8
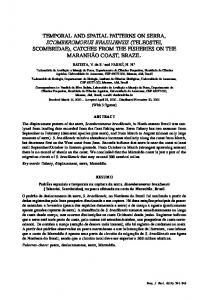
METHODOLOGY Sample Collection Discrete water samples were collected during seasonal field experiments on the West Florida Shelf as part of the Florida Bay Circulation and Exchange Study (NOAA/AOML) and the Florida Red Tide Program (Florida Fish and Wildlife Conservation Commission) on board the R/V F.G. Walton Smith and the R/V Suncoaster, respectively (Figure 1.1). The months sampled are as follows: December 2003, August 2004, December 2004, April 2005, August 2005 and November 2005. Surface and subsurface samples were collected via Niskin bottles for all field experiments. During the Florida Bay Circulation and Exchange Study, whole water was collected in amber glass bottles and filtered through pre-combusted GF/F filters (up to 24 hours at 450oC) on board using glass filtration apparatus and a pump. During the Florida Red Tide Program cruises, water was gravity filtered through pre-combusted GF/F filters mounted in stainless steel in-line filtration apparatus. All filtered water was then stored frozen in pre-combusted, amber glass bottles until slowly thawed for absorption, fluorescence and Dissolved Organic Carbon (DOC) analysis. To verify that the freezing process did not result in any loss of chromophores, absorption spectra were collected prior-to and after freezing (Figure 1.2).
Absorbance Spectroscopy Absorbance spectra were obtained using a Hitachi U-3300 double-beam spectrophotometer with matching one and ten centimeter quartz cells. Measurements were made at 1 nm intervals between 200 and 750 nm with Milli-Q deionized water in the reference cell. Samples were scanned three times and then averaged to reduce noise and yield a more robust spectrum. Data were corrected for scattering and baseline fluctuations by subtraction from each wavelength, the measured absorption at 700 nm (Bricaud et al., 1981). Absorbance values were converted to absorption coefficients using the following equation, a(λ ) = 2.303A(λ )/r,
9
where A is the absorbance (Log Io/I) and r is the pathlength in meters. Spectral slopes were then calculated for a variety of wavelength ranges between 250 and 440 nm using linear least squares regression.
Figure 1.2. Results of freezing experiment to determine if a loss of chromophores were apparent in absorption spectra. The findings show no significant change was observed using this method.
Fluorescence Spectroscopy High-resolution fluorescence spectroscopy was performed on the discrete samples according to the method of Coble (1996) using a Horiba Jobin Yvon Inc. Fluoromax II spectrofluorometer with a 450 Watt xenon lamp and single excitation and emission monochromators. Samples with absorbance values above 0.02 at 300 nm using a 1 cm 10
cell were diluted prior to fluorescence analysis to avoid self-shading of the material (Green and Blough, 1994). Samples were analyzed in ratio mode with 5 nm bandwidths for excitation and emission. Forty-eight emission scans were collected at excitation wavelengths five nanometers apart between 220 and 455 nm. Emission wavelengths spanned between 250 and 700 nm, with data collected every 2 nm over an interval of 0.5 seconds (Coble, 1996). Three-dimensional excitation-emission matrices (EEMs) were generated by conjoining the individual spectra. The EEMs were normalized to a fixed value for Raman scatter at Ex/Em = 275/303 nm based on a single emission scan from the Milli-Q water daily blank and then corrected for scatter at all wavelengths by subtracting a Milli-Q EEM (determined weekly). This procedure has been found to improve removal of first and second-order Raman scattering peaks. Blank-subtracted EEMs were corrected for instrument configuration using both emission and excitation correction factors (Coble et al., 1993). Excitation correction factors were determined every two weeks using a fresh solution of saturated Rhodamine in ethylene glycol (0.8g / 100 mL). Emission correction factors were provided by the manufacturer. Finally, corrected fluorescence intensities were converted to units of quinine sulfate equivalents (QSE) in ppb using the fluorescence of a dilution series of quinine sulfate dihydrate in 0.05M sulfuric acid at Ex/Em = 350/450 nm (Velapoldi and Mielenz, 1980), where 1 QSE = 1 ppb quinine sulfate dehydrate. All processing was conducted using Galactic Industries’ Grams 32 software.
Dissolved Organic Carbon Dissolved Organic Carbon concentrations were determined by thermal catalysis using a Shimadzu TOC 5000 equipped with an ASI-5000 autosampler. Prior to analysis, approximately 20-40 ml of sample were transferred from amber glass bottles into preashed, foil wrapped glass vials. For every milliliter of sample, 1 µl of concentrated hydrochloric acid (12.1N) was added to the vial and subsequently capped with foil. Samples were sparged for ten minutes with low-carbon air to remove inorganic carbon from the sample water (Del Castillo, 1998). The injection volume was selected as 100 µl, where samples were injected up to ten times. The best three of ten peaks, with a standard 11
deviation of 200 or less or a coefficient of variance of 2.0 % or less, were then averaged. DOC concentrations were calculated using a standard dilution of phthalic acid, where the range of the dilution series depended on the origin of the samples (up to 5ppm). Concentration of DOC in a MilliQ water blank was also determined and subtracted from the samples. To assure instrument stability, standards were randomly run with samples and MilliQ water was injected between samples to verify baseline levels. Standard curves were performed weekly, with daily one-point calibrations conducted.
High-Resolution Spatial Mapping Continuous, underway mapping of organic matter fluorescence in surface waters was performed using a SAFIre (Spectral Absorption and Fluorescence Instrument manufactured by WET Labs). Fluorescence output was stored with salinity and temperature (Seabird Electronics SBE-45 thermosalinograph) and GPS information (Garmin, Inc) using a WET Labs Data Handler (DH-4). Data streams were merged and processed using the WAP (WET Labs Archive Processing) program which extracted time-stamped raw data from archived files and applied calibration coefficients for all instruments. A Matlab binning routine was used on extracted data to yield data points every 0.3 km. Spatial maps of underway data were generated by kriging and blanking methods in Surfer mapping software, version 8.1.
Underway data were unfiltered and represent COM (Colored Organic Matter). The SAFIre measures fluorescence at six excitation and sixteen emission wavelengths, configured for optimum organic matter detection (excitation range: 228-436 nm and emission range: 228-687 nm). Discrete filtered seawater samples were used to intercalibrate the SAFIre to the benchtop fluorometer (Conmy et al., 2004a).
Satellite Data Level-1A MODIS (Aqua) data were retrieved from the NASA Goddard Space Flight Center (GSFC) website (http://oceancolor.gsfc.nasa.gov) and processed to Level-2 using SeaDAS (version 5.0) software. CHL concentrations and CDOM absorption coefficients 12
at 443nm were estimated using the Carder et al. (1999) semi-analytical algorithm which can differentiate between phytoplankton and CDOM absorption. Fluorescence line height (FLH) data were calculated according to Abbott and Letelier (1999), where FLH is based on calibrated, normal water-leaving radiances. This height is the intensity of upwelled radiance at 676.7 nm above the baseline created from 665.1 and 746.3 nm. Overestimations associated with FLH are attributed to the presence of suspended particles and differences in chlorophyll-a fluorescence efficiency of plankton. Waterleaving radiance data in three MODIS bands (551, 488 and 443 nm) were used to derive, composite enhanced RGB (ERGB) images. All images were stretched to the same scale in accordance with code from Chuanmin Hu and the USF- Institute of Marine Remote Sensing. Atmospheric affects have been removed from imagery. All processing was conducted by the USF – Optical Oceanography Laboratory.
13
RESULTS & DISCUSSION The coastal waters of the West Florida Shelf are heavily influenced by the multiple rivers to the north and the east. As a result, the CDOM pool on the shelf is mainly due to the mixing of fresh water and seawater. For the field experiments on the shelf between 2003 and 2005, this mixing line, essentially the relationship between CDOM fluorescence and salinity, was found to be relatively constant, with a slope of ~- 4 (Figure 1.3). Separating data by the amount of river discharge, denoted here as high-flow and low-flow conditions (relates to classifications and values in Table 1.1 and Figure 1.4), showed no distinct difference in the mixing line, therefore the regression reported in the figure is for both conditions.
Figure 1.3. CDOM fluorescence at Ex/Em 300/430 nm for seasonal cruises on the West Florida Shelf. Both dry and wet seasons fall on the same mixing line, with the exception of hypersaline waters during August 2005.
14
Table 1.1 Date of WFS field experiments along with USGS and CHNEP discharge and flow classifications. Flows represent monthly averages. Data from www.chnep.org.
Month and Year of Field Experiments
USGS Discharge in Peace River at Bartow Station (cfs)
Charlotte Harbor NEP Flow Classification
December 2003
45
Normal
August 2004
667.2
Low, then High after Hurricane
December 2004
186.5
Normal to High
April 2005
188
Normal to High
August 2005
756.5
High
November 2005
371.8
Normal
Figure 1.4. Peace River discharge data from the Bartow Station (Source: USGS).
15
This inverse relationship was found for all samples with salinities less than 36. Above this salinity, however, the trend reverses and CDOM was found to vary proportionately with salinity for a subset of samples taken during August 2005. This positive correlation has been previously observed on the southern portions of the shelf (Coble, 2004) during the rainy months of the summer season. The productive, shallow sediments of this portion of the shelf produce large concentrations of CDOM, which enter the water column. Coincident evaporative processes result in high salinity water masses that in turn contain this newly produced organic matter (Coble, pers. commun.).
Spatial Distribution of COM Fluorescence The fact that CDOM follows a quasi-conservative mixing line (de Souza Sierra et al., 1997; Del Castillo et al., 2000), isn’t necessarily worthy of note in this region, but how the spatial distributions vary by season is. Generally, during the South Florida rainy season (summer months) there is a higher concentration of CDOM on the shelf as a result of increased contribution of rivers. Conversely, during times of little rainfall (winter months), lower concentrations would be expected in these coastal waters. Although this is a reasonable generalization, the field experiments in this project show numerous exceptions. Plotted in Figure 1.5 are the spatial distributions of COM for surface waters on the shelf for all months sampled between 2003 and 2006. It is important to note that due to the shallow nature of the shelf and the close proximity to shore of the field experiments, there tended to be no vertical structure throughout the water column. Of the approximately 200 samples collected, only 24 stations exhibited a two layer water mass. Given this low percentage, and that the waters in this region of the shelf are well mixed, it is reasonable supposition that when looking at the spatial maps, the patterns observed in the surface waters would be similar at the bottom of the water column as well.
Of all the months sampled, December 2003 had the lowest flow conditions for the Bartow station, and concentrations over much of the shelf were below 12 QSE. Higher concentrations were observed in the southernmost sections of the cruise track, near
16
Florida Bay, which also corresponded to a decrease in salinity (Figure 1.6). Although dry conditions dominated the region, the Everglades experienced some isolated rain events during this month. During April 2005, discharge was also very low (188 cfs) and the distribution of COM resembled that of December 2003. Freshwater contribution from from the Everglades, however, was not observed during this month, therefore no elevated COM values were found.
In contrast, August 2005 had the highest discharge of all the months sampled, and higher COM concentrations were observed on the shelf. This is also the experiment where the hypersaline CDOM signature was observed, just to the west of Florida Bay. Due to the large amounts of rainfall that Florida experiences during the months of August, high organic matter concentrations would be expected over much of the shelf, however this was not the case for August 2004. Two field experiments were conducted that month, and the spatial plots reveal patterns and concentrations more similar to dry season conditions. This is due primarily to (1) a late start to the wet season that year, where discharge was low in the early parts of August 2004 (see Figure 1.4), and (2) the passing of Hurricane Charley five days before the first field experiment. This major storm (category 4 at landfall in Punta Gorda on August 13, 2004) approached Florida from the southwest and forced offshore water, with lower CDOM concentrations, onto the shelf, mixing it with shelf water. Winds and currents on the shelf from the day of the storm are shown in Figure 1.7 (left panel) and illustrate the direction of the currents. During the two field experiments, the prevailing winds and currents were to the north (middle and right panels). The distribution of low-COM waters (and also low-CHL) on the shelf during this time was also observed in satellite imagery from MODIS-Aqua. Dark waters in the enhanced RGB (ERGB) and the Fluorescence Line Height (FLH) imagery for pre and post-hurricane days are shown in Figure 1.8A. The water-leaving radiance data of ERGB gives more information on detecting spatial features due to the use of three MODIS bands, as compared to using to only two bands in CHL imagery. The images reveal that prior to the hurricane, dissolved organic material was present between Charlotte Harbor and the Florida Keys. After the storm, however, dark color wasn’t as 17
Figure 1.5. COM Spatial distributions on the West Florida Shelf collected with the WetLabs Inc SAFIre. Measurements obtained using continuous flow-through system of unfiltered surface waters. 18
Figure 1.6. Salinity spatial distributions for seasonal cruises on the West Florida Shelf. 19
Latitude
Longitude
Longitude
Longitude
Figure 1.7. Maps of currents and wind data from buoys operated by USF - Ocean Circulation Group (http://ocg7.marine.usf.edu/~liu). Left panel is during the passage of Hurricane Charley, middle panel is 4 days after the storm, and right panel is 10 days after the storm in August 2004. 20
11Aug04 (pre-hurricane)
17Aug04 (4 days post-hurricane)
23Aug04 (10 days post-hurricane)
Figure 1.8A. Enhanced RGB (R: 551,G: 488,B: 443nm) (top panels) for three days in August 2004 around the time of the passing of Hurricane Charley. Bottom panels are the Fluorescence Line Height (mW / cm2 / µm /sr) for the same days. Imagery supplied by USF-Optical Oceanography Laboratory. 21
prevalent and the observed white colors indicate either suspended or bottom sediments. Given that the SAFIre measures COM, and not CDOM, the presence of suspended particle matter (SPM) can increase the fluorescence signal in these unfiltered instruments.
The observed low-COM values suggest that the white colors in the ERGB imagery are most likely from the bottom and not SPM. Hence, if SPM, CDOM and CHL were all low, the water column may have been optically clearer and signal from the bottom sediments would be more apparent at this time. Absorption due to gelbstoff and detritus at 443nm (adg443) and CHL estimates are shown in Figure 1.8B. The imagery also shows that there was minimal biomass on the West Florida Shelf at this time and that low values of adg443 five days after the storm are in agreement with the in situ COM measurements. By the second field experiment, the contribution from terrestrial sources increased as a result of the large amounts of rainfall from the hurricane, subsequently, higher COM concentrations were observed compared to the experiment five days earlier, but still low compared to August 2005.
Episodic storm events can also affect the underwater light field during dry season months as was observed during December 2004. Again, there were two field experiments during this month and the distributions of COM fluorescence south of Charlotte Harbor are quite dissimilar. The first cruise showed low concentrations over the shelf that correlates with salinity patterns. The second cruise, however, showed strong fluorescence signal over the entire southern portion of the field experiment, but with no corresponding change in salinity, indicating that freshwater was not the source of the increase. At the time of the second field experiment, a storm event occurred (December 15, 2004), as evidenced by the current and wind vectors (Figure 1.9, right panel). ERGB imagery in Figure 1.10A (right panel) shows a significant increase in the proportion of white colors, most likely the result of resuspended particles from the storm’s passing. Such increases in non-algal particles can interfere and result in higher COM values, as well as any dissolved material released from the sediments at the time of resuspension (Boss et al., 2004).
22
11Aug04 (pre-hurricane)
17Aug04 (4 days post-hurricane)
23Aug04 (10 days post-hurricane)
Figure 1.8B. Imagery of CHL with the removal of gelbstoff (top panels) and adg443 (bottom panels) for three days in August 2004 around the time of the passing of Hurricane Charley. Units are mg / m3 for CHL and m-1 for adg443.
23
Latitude
Longitude
Longitude
Figure 1.9. Maps of currents and wind data from buoys operated by USF - Ocean Circulation Group (http://ocg7.marine.usf.edu/~liu). Left panel is during a winter storm event and right panel a week after the storm in December 2004.
24
06Dec04 (pre-storm field experiment) 15Dec04 (during storm field experiment)
Figure 1.10A. Enhanced RGB (R: 551, G: 488, B: 443nm) (top panels) for two days in December 2004. Bottom panels are the Fluorescence Line Height (mW / cm2 / µm /sr) for the same days. Imagery supplied by USF-Optical Oceanography Laboratory.
25
The FLH images show a marked difference from before and during the storm, indicating an increase in CHL during the latter experiment. This is also observed in the CHL images in Figure 1.10B (top right panel). This increase during the second field experiment was most likely the result of an observed Karenia brevis bloom in the southern portions of the shelf. Cell concentrations from Florida Fish and Wildlife Conservation Commission – Florida Wildlife Research Institute (FWC-FWRI) are plotted over the COM spatial map in Figure 1.11.
06Dec04 (pre-storm field experiment) 15Dec04 (during storm field experiment)
Figure 1.10B. Imagery of CHL with the removal of gelbstoff (top panels) and adg443 (bottom panels) for two days in December 2004. Units are mg / m3 for CHL and m-1 for agd443.
26
Figure 1.11. Karenia brevis cell counts from FWC/FWRI plotted on top of the COM fluorescence spatial maps shown previously. Left panel is for the second December 2004 field experiment and the right panel is for November 2005.
Regions with the highest cell counts (up to a million cells / L) coincide with high fluorescence intensity. Additionally, the observed increase in COM fluorescence during the second December 2004 field experiment concurs with an increase in adg443 in the satellite imagery. A plausible explanation for the observed high-COM values is most likely a combination of factors including the (1) presence of suspended particles as the experiment occurred during the passing of the storm (2) dissolved materials released from red tide, (3) dissolved materials resuspended from the sediments and possibly even (4) benthic diatoms that may be put into suspension. Given the data available it is difficult to assess which factor dominated.
Above, it was shown that hurricanes can drastically alter IOP concentration and distribution on the shelf, but how they are changed and to what extent depends greatly on the characteristics of the storm (from strength, to direction, to storm surge, to wind patterns) and the ambient climate before the storm passes over a region. During 27
November 2005, South Florida was impacted by another major storm, Hurricane Wilma (category 3 at landfall in Cape Romano on October 24, 2005), and the field experiment for this month occurred eight days after its passing. Winds and currents on the shelf pre, during and post-hurricane are shown in Figure 1.12. Highest concentrations of organic matter were observed during this experiment and were widespread over much of the shelf. When reviewing the ERGB imagery (Figure 1.13A) it is apparent that unlike the August and December 2004 experiments, there exist extensive areas of dark colors prior to the passing of the hurricane. This may have resulted from either the end of the wet season accumulation of CDOM on the shelf and / or the presence of the persistent HAB of K. brevis that blanketed the coast (Figure 1.11, right panel). The FLH imagery shows widespread phytoplankton signal during this pre-Hurricane Wilma time period. Imagery from eight days after the storm shows the presence of lighter colors (ERGB) at the southern portion of the WFS. This is most likely due to bottom sediments, as this region is shallow and the imagery is from more than a week after the storm, thereby giving ample time for particles resuspended during the storm to settle out. The FLH imagery shows a concentration effect of the phytoplankton between Tampa Bay and Charlotte Harbor, which is also seen in the CHL and adg443 imagery (Figure 1.13B). It also shows high gelbstoff in the southern and inshore portions near Florida Bay. In situ measurements found the highest COM fluorescence and lowest salinities near Florida Bay, but the imagery impedes comparison due to the presence of clouds in this region.
If the high COM signal didn’t result from interference with suspended particles, then an explanation for the high intensities during the November 2005 includes the following components: (1) The storm physically concentrating the bloom and any of the dissolved organic material produced by the prolonged K. brevis bloom. (2) Vigorous mixing of shelf waters and the HAB could have released additional dissolved organic material from the cells. (3) Dissolved Organic Matter from the sediments becoming suspended in the water column and remaining in solution long after the particles settled out.
28
Latitude
Longitude
Longitude
Longitude
Figure 1.12. Maps of currents and wind data from buoys operated by USF - Ocean Circulation Group (http://ocg7.marine.usf.edu/~liu). Left panel is before Hurricane Wilma, middle panel is during the storm and right panel after the hurricane in November 2005.
29
(4) The storm occurring at the end of the rainy season, when the shelf and the rivers had already accumulated high amounts of organic material. The rain from the storm could have resulted in a flushing of easily transported terrestrial material resulting in higher color on the shelf.
18Oct05 (pre-hurricane)
02Nov05 (post-hurricane)
Figure 1.13A. Enhanced RGB (R: 551,G: 488,B: 443nm) (top panels) for two days pre and post-Hurricane Wilma. Bottom panels are the Fluorescence Line Height (mW / cm2 / µm /sr) for the same days. Imagery supplied by USF-Optical Oceanography Laboratory
30
18Oct05 (pre-hurricane)
02Nov05 (post-hurricane)
Figure 1.13B. Imagery of CHL with the removal of gelbstoff (top panels) and adg443 (bottom panels) for two days pre and post-Hurricane Wilma. Units are mg / m3 for CHL and m-1 for adg443.
Absorption Measurements The ability to derive CDOM absorption from fluorescence measurements is of great interest to coastal zone researchers, and given that this relationship varies by region, field observations are necessary for its determination on the West Florida Shelf. Fluorescence and absorption values of discrete samples from each of the field experiments are plotted in Figure 1.14. Strong correlations, independent of depth, location, or season were found between fluorescence and absorption coefficients at 312 and 440 nm. This demonstrates promise for deriving CDOM absorption values from fluorescence measurements, not only from discrete samples, but in situ measurements as well. 31
Figure 1.14. Relationship of CDOM fluorescence to absorption at 312 and 440 nm for all cruises on the West Florida Shelf.
The relationship of fluorescence and absorption from the shelf experiments holds true for a wide range of concentrations. In addition to this concentration range, there is also a wide range in spectral shape of the absorption spectra. Figure 1.15 shows examples of seven different waters observed during the field experiments. Steeper slopes were expectedly found for low CDOM, high salinity waters and the lowest slopes were for high CDOM, low salinity waters between 280-312 nm (Table 1.2). The large dashed lines show the differences between the absorption curves from waters affected by Hurricanes Charley and Wilma, where the former resulted in waters with increased clarity over much of the shelf and the latter, resulted in increased COM concentrations.
32
Figure 1.15. Absorption spectra for different water types sampled during cruises to the West Florida Shelf.
Spectra from before (gray small dashed line) and after (black small dashed line) the December 2004 storm event show little difference. This supports the hypothesis that the higher signal observed in the spatial maps may have resulted in part from suspended particles.
Spectral slopes can be calculated over different regions of the absorption spectrum. Two spectral slope ranges are plotted in Figure 1.16 and show how the slope parameter changes with salinity, and the wavelength dependent differences in the parameter. The spectral slope parameter for narrow, more blue-shifted (shorter) wavelength ranges (in
33
Table 1.2. Absorption data for the water types shown in Figure 1.15.
Spectral Slope Spectral Slope Spectral Slope 280-312nm (m-1) 350-412nm (m-1) 350-440nm (m-1)
Designation
Salinity
Ex/Em = 300/430 nm
High CDOM- Low Salinity
24.75
54.61
0.01938
0.01763
0.01788
High CDOM-High Salinity
38.02
11.45
0.02507
0.01832
0.01799
Low CDOM-High Salinity
35.51
1.41
0.03225
0.01334
0.01294
Post Hurricane Charley
36.03
1.31
0.03074
0.01178
0.01072
Post Hurricane Wilma
34.02
19.72
0.02219
0.01160
0.01074
December 2004 Pre Event
34.57
10.85
0.02197
0.01824
0.01842
December 2004 Post Event
34.66
9.04
0.02189
0.01732
0.01698
Designation
a(280) (m-1)
a(312) (m-1)
a(350) (m-1)
a(440) (m-1)
DOC (µM)
High CDOM- Low Salinity
33.88
18.47
9.54
1.95
411.15
High CDOM-High Salinity
8.15
3.73
1.74
0.34
193.56
Low CDOM-High Salinity
0.91
0.33
0.14
0.04
148.51
Post Hurricane Charley
1.29
0.50
0.24
0.09
82.85
Post Hurricane Wilma
12.94
6.55
3.48
1.41
207.74
December 2004 Pre Event
6.33
3.18
1.54
0.29
195.29
December 2004 Post Event
7.44
3.75
1.78
0.39
155.47
34
Figure 1.16. Spectral slope values for seasonal cruises on the West Florida Shelf. Slopes calculated by linear least squares regression for two ranges: 280-312 and 350-440 nm.
35
the top panel) show clearer differences between the various water types, as indicated by the arrows in the plot. However, parameters calculated out to 440 nm (bottom panel) are necessary for remote sensing algorithm applications, but have greater signal to noise ratios. In general, higher slopes at lower wavelengths indicate more refractory, less aromatic organic material, similar to what is found in the open ocean. Conversely, lower slopes point to more complex material. The top panel in Figure 1.16 shows a progression from lower to higher slopes with salinity (a decrease in complexity) from waters taken after Hurricane Wilma, the December 2004 storm, Hurricane Charley, and for the hypersaline water of August 2005.
Spectral Changes Related to the spectral slope parameter are differences in the fluorescence EEM fingerprint. These matrices allow for determination of spectral shape and position of peaks, as well as how the humic peaks change relative to each other. These parameters serve as proxies for compositional differences of organic matter within sample waters. The same examples shown in the absorption curves of Figure 1.15 are plotted as EEMS in Figures 1.17 A, B and C. Refer to Table 1.3 for list of peak positions and fluorescence intensities. Similar fingerprints were found for the high CDOM - low salinity and high CDOM - high salinity waters. Organic matter fluorescence after the passage of Hurricane Wilma also resembled these waters (Figure 1.17B, top panel). Recall that the spatial maps during the November 2005 experiment showed widespread distributions of high COM concentrations. Fluorescence matrices after the passage of Hurricane Charley, however, are most similar to that of the low CDOM - high salinity fingerprints. Figure 1.17C shows the EEMS from before (top) and after (bottom) the December 2004 event. The matrices look similar to each other in both concentration and peak positions, indicating some similarity of the dissolved organic pool. Both EEMS also possess protein-like fluorescence peaks (Table 1.4 lists the wavelength range for protein-like peaks). These matrices, however show differences in the spectral shape of the humic peaks, indicating that the organic material before and after the storm event differed in some way. 36
Peak A
Peak M
High CDOM – Low S
High CDOM – High S
Low CDOM – High S
Figure 1.17A. Excitation Emission Matrices (EMS) for three water types on the West Florida Shelf. Top panel is a high CDOM, low salinity water. Middle panel is for hypersaline waters with high concentrations of CDOM. Bottom panel is high salinity, low CDOM water. Humics Peaks A and M are demarked in the top right contour. Scale of contour plots are set to the maximum fluorescence intensity in the corresponding 3-D plots on the left. 37
Hur. Wilma, November 2005
Hur. Charley, August 2004
Figure 1.17B. EEMS for water after the passage of Hurricanse Wilma (top) and Charley (bottom). Both are high salinity waters, but possess differences in CDOM concentration. Scale of contour plots are set to the maximum fluorescence intensity in the corresponding 3-D plots on the left.
38
Pre-Storm Event
Post-Storm Event
Figure 1.17C. EEMS for water before (top) and after (bottom) the passage of the December 2004 storm event. Scale of contour plots are set to the maximum fluorescence intensity in the corresponding 3-D plots on the left.
39
Table 1.3. Peak positions and intensities for EEMs shown in Figure 1.17. Fluor. Intensity Fluor. Intensity Ex Humic Em Humic Humic Peak A Ex Humic Em Humic Humic Peak M Salinity Peak A (nm) Peak A (nm) (QSE) Peak M (nm) Peak M (nm) (QSE)
EEM ID
MonthYear
High CDOM-Low Salinty
Aug-05
24.75
235
427.85
108.08
305
419.84
55.73
High CDOM-High Salinity
Aug-05
38.02
235
419.52
23.90
305
407.30
12.09
Low CDOM-High Salinity
Dec-03
35.51
235
403.40
3.48
300
401.64
1.63
Pre-storm event
Dec-04
34.57
235
419.52
22.35
305
411.61
11.33
Post-storm event
Dec-04
34.66
230
417.21
22.84
300
414.34
9.32
Hurricane Wilma
Nov-05
33.90
235
416.07
19.04
305
403.58
10.44
Hurricane Charley
Aug-04
36.03
235
395.30
2.73
295
382.67
1.45
40
Table 1.4. EEM peak positions previously found by Coble, 1996.
Component
Peak Name
Ex/Em (nm)
tyrosine-like, protein-like
B
275 / 305
tryptophan-like, protein-like
T
275 / 340
unknown
N
280 / 370
UVC humic-like
A
260 / 400-460
UVA marine humic-like
M
290-310 / 370-410
UVA humic-like
C
320-360 / 420-460
pigment-like
P
398 / 660
One way to visualize these differences, is to plot the position of Humic Peak M emission maxima as a function of salinity (Figure 1.18). As initially reported by Coble, 1996, Peak M has been previously identified at Ex/Em = 290-310 / 370-410 nm (Table 1.4). The position of Peak M showed the largest range during high flow conditions (379- 425 nm), where the most red-shifted peaks, corresponded to lower salinities and higher concentrations of organic material. Peaks at longer wavelengths during the wet season are explained by the occurrence of higher river discharge that carries with it CDOM of terrestrial origin to the shelf. This material has been shown to be more red-shifted, colored, labile and compositionally complex (McKnight et al., 2001; Aiken, 2002, Stedmon and Markager, 2005) as compared to marine organics (Shark River water was added to this plot for comparison). Conversely, the occurrence of peaks at shorter wavelengths during the wet season is the result of warmer temperatures and high sun exposure of these summer months. These conditions are favorable for photodegradation of organic material, which produces, smaller, less colored organically resistant material that results in a blue-shifting of the fluorescence peaks (Zepp and Schlotzhauer, 1981). The most blue-shifted peaks were found after the passage of Hurricane Charley. The 41
hypersaline waters also show peaks at shorter wavelengths. Shelf waters after the passage of Hurricane Wilma possessed peaks between 400-415 nm, suggesting a strong terrestrial signature where salinities were low. During November 2005 for higher salinity waters, these peak positions could have also arose from productivity in the sediments or water column. Samples taken after the winter storm event were also more red-shifted, but had higher salinities, suggesting runoff was not the source, but from marine productivity (either within the water column or the sediments) instead.
Figure 1.18. Position of fluorescence maxima for Humic Peak M for West Florida Shelf waters. The range in position is greatest during high flow conditions. Peak C for Shark River water is added for reference. Shark River data is included for reference.
The position of peak maxima can also be demonstrated with spatial maps for each field experiment (Figure 1.19). It is important to note that the contour maps shown previously in Figure 1.5 were generated with in situ, unfiltered water, whereas filtered, discrete samples were used in the plots of Figures 1.19 and 1.22. Red colors in the spatial map represent more complex material and blue colors are indicative of more refractory marine 42
CDOM. Bluest positions were found after the passage of Hurricane Charley and conversely, reddest positions were observed during August 2005, when discharge was highest. The hypersaline waters show positions close to 400 nm. During November 2005, post Hurricane Wilma, peak positions of longer wavelengths dominated the shelf (peaks > 400 nm) and are most likely related to the flux of organic material from the sediments, lysis of cells from the phytoplankton bloom and from terrestrial runoff due to increased rain brought by the storm. For the case of December 2004, unfortunately, only a few samples were taken south of Charlotte Harbor, so the storm event cannot be documented spatially with discrete samples. At the time of lowest flow (December 2003), we also see patterns similar to August 2004, but with a smaller range in peak position. This pattern would have been expected with April 2005, as well, but because samples were only taken at inshore stations, no offshore blue-shifted material was sampled.
Another parameter to help describe the composition of organic material on the shelf is the ratio of humic peaks A (UVC region) to that of humic peaks C or M (UVA region) (Figure 1.20). Many of these coastal samples have ratios of approximately 2 (Shark River samples were also found to be 2). Shelf waters after Hurricane Wilma tended to be between 1 and 2, where as Hurricane Charley samples were mostly above 2. The winter storm event exhibited higher ratios as well.
43
Figure 1.19. Spatial distributions of Humic Peak M position for seasonal cruises on the West Florida Shelf. Contours generated using discrete samples, as compared to previous spatial maps of in situ data.
44
Figure 1.20. Ratio of Humic Peaks A and C/M as a function of CDOM fluorescence intensity and salinity for all field experiments. Shark River ratios are included for comparison. 45
CDOM and Dissolved Organic Carbon Measurement of DOC concentration is a labor intensive process, and there is a critical need for developing proxies for this material. In coastal regions, recent studies have found that DOC is highly correlated with CDOM (Ferrari et al., 1996; Vodacek et al., 1997; Del Castillo et al., 1999, Del Castillo 2005). Using fluorescence measurements to estimate critical organic carbon concentrations can foster better estimates of terrestrial carbon export in coastal waters. Plotted in Figure 1.21 is the relationship of carbon to fluorescence for the West Florida Shelf field experiments. Separating data by flow conditions results in two regression lines, where higher color is observed per DOC unit during periods with increased discharge onto the shelf. During December 2003 (time
Figure 1.21. The relationship between Dissolved Organic Carbon (DOC) and CDOM fluorescence on the West Florida Shelf. Regressions calculated without samples from December 2003 or the high DOC- low CDOM values.
46
of smallest discharge), no relationship could be found between the two parameters on the shelf. There are also a number of data points that show elevated organic carbon relative to fluorescence, that were not included in the regressions, as these were outliers compared to the remaining samples. The spatial plot for December 2003 (Figure 1.22), when no correlation with CDOM could be found, shows higher values found in waters influenced by the Everglades and Florida Bay. During the experiment with the highest discharge (August 2005), highest DOC was found near the mouth of the Caloosahatchee and the Everglades rivers.
Figure 1.22. Spatial distributions of DOC on the West Florida Shelf. Left panel is December 2003, right panel is August 2005.
47
CONCLUSIONS Generally, waters on the West Florida Shelf exhibited a strong correlation between CDOM and salinity. This suggests that although there are numerous sources of this material to the WFS, to the first order, mixing is the dominant factor controlling CDOM. An inversion in the CDOM-salinity relationship was observed for waters adjacent to Florida Bay, where a hypersaline, CDOM-rich water mass was found during the 2005 summer season. Temporal variability in distribution patterns of CDOM concentrations, spectral properties and DOC was found. This is attributed to seasonal differences in river discharge, the presence of HABs and the occurrence of episodic storm events. The first of these events, the passage of Hurricane Charley in August 2004 resulted in low fluorescence intensities over the entire shelf. Little terrestrial organic matter was detected as evidenced by high spectral slopes at low wavelengths and blue-shifted fluorescence peaks.
A dry season storm event in December 2004 was shown to cause an increase in fluorescence intensity using in situ instruments as compared to the field experiment just prior to the storm’s passing. Spectral slope and EEM data showed no significant change in the optical properties of discrete samples prior to and after the event, suggesting that the change measured by in situ sensors was due primarily to particles in the unfiltered seawater. This was supported by satellite ERGB imagery. Additionally, the presence of a red tide and DOM from the sediments may also have attributed to the higher signal.
Highest fluorescence intensities were observed on the shelf during November 2005 after the passing of Hurricane Wilma eight days earlier. Spectral slope values were low, fluorescence peaks were red-shifted, and both high and low-salinity waters were observed at this time. This indicates that the organic material originated from rivers and marine sources. The marine sources may have been DOM from the sediments and from the persistent phytoplankton bloom that blanketed the shelf.
48
The work presented here illustrates the dynamic nature of the West Florida Shelf and ways in which discharge patterns and physical forcings influence the distribution of CDOM. Results of this project can be used to ground truth ocean color products for a variety of scenarios: high versus low river discharge, hurricanes, resuspension events and bloom periods. One component, river discharge of CDOM is the focus of the next section of this dissertation, where seasonal and spatial variability is examined.
49
Part II: CDOM optical properties in Florida’s Gulf Coast riversheds: A regional comparison
50
INTRODUCTION Colored Dissolved Organic Matter (CDOM) is photoreactive, an important reservoir, and an integral component of the global carbon cycle. It plays crucial roles in biogeochemical processes such as metal binding capacity (Aiken, 2002), pollutant and material transport across reservoirs (Hansell, 2002), microbial loop dynamics, and nutrient cycling. It also affects water clarity, dissolved organic carbon flux, drinking water quality, and UV shading of aquatic biota. Its presence determines the coastal euphotic zone, serving as both a limitation for certain primary producers (ie. seagrasses) and at the same time as essential sunscreen for organisms (ie. corals) that require protection from harmful UV radiation. Due to these reasons, CDOM serves as a measure of ecosystem health and an indicator of environmental change for restoration-critical species and resource managers.
CDOM is chemically complex and its composition is source specific (Cauwet et al., 1990; Coble, 1996; Boss et al., 2001; Stedmon et al., 2003; Chen et al., 2004 Baker, 2001, 2002; Baker and Spencer, 2004). Its optical properties vary for waters impacted by forests, wetlands, urbanization, sewage effluent, agricultural practices, local biology and groundwater discharge. Due to the source specific nature of CDOM composition, the optical properties of this material can be used as a water tracer. Parameters, such as absorption coefficients, fluorescence intensities and ratios (Del Castillo et al., 2001; McKnight et al., 2001; Conmy et al., 2004), positions of fluorescence maxima (Coble, 1996), spectral slopes (Blough et al., 1993), and apparent fluorescence efficiencies all have been used to distinguish sources and observe CDOM transformations through ecosystems.
The strong conservative behavior of CDOM and salinity in coastal waters gave rise to the notion that a true ‘endmember’ value at zero salinity in rivers must exist and that a universal endmember could be established for a watershed in order to account for the conservative mixing observed in shelf waters. Findings of recent studies dedicated to examining CDOM spectral properties in river systems have countered that perception (Del Castillo et al., 1999; Baker, 2002; Kowalczuk, et al. 2003; Chen et al., 2004, 51
Conmy, et al., 2004; Coble, 2007 and ref. therein). Locally, projects investigating the rivers supplying the West Florida Shelf (WFS) (Boehme, 2000; Stovall-Leonard, 2003), showed that Dissolved Organic Matter (DOM) in watersheds can possess distinguishing optical characteristics. Although these studies shed much light on the differences between selected watersheds on the Gulf Coast, an assessment of temporal variability or a comprehensive comparison of rivers by region was outside the scope of those projects.
There is a critical need to establish the spatial and temporal variability of CDOM and DOC in rivers and estuaries. This is especially true for river-dominated margins, like the WFS, where freshwater originates from numerous rivers. In such regions, the ability to understand regional carbon dynamics is necessitated by establishing CDOM variability in said rivers. Additionally, an understanding of how CDOM distribution is influenced by watershed-basin characteristics (soil composition, land cover, soil permeability) and climatic patterns is also required to determine how CDOM is transferred through various environmental regimes.
Investigated in this study is how optical properties (absorption coefficients, fluorescence efficiencies, intensity, ratios and peak position) and DOC vary spatially and temporally for watersheds between the Atchafalaya/Mississippi River system in Louisiana and the Shark River in the Everglades for a two year time period. Implicated in the cause for differences among rivers are differences in basin characteristics of the watersheds.
52
METHODOLOGY Seasonal sampling of the Atchafalaya, Mississippi, Apalachicola, Suwannee, Hillsborough, Alafia, Manatee, Peace, Caloosahatchee, and Shark Rivers was conducted over a two year time period during 2003-2005 (Figure 2.1). Water samples and in situ measurements were taken from the banks of rivers or from docks at various locations along the river, with the exception of the Shark River (Table 2.1). For this river, a boat from the Keys Marine Lab was used to obtain river water. Up to four samples were taken from each stream to encompass a salinity range from the river mouth to zero-salinity waters. In situ measurements of salinity, conductivity, temperature, and pH were taken via a Hydrolab Sonde. Samples for DOC, fluorescence and absorption analyses were collected wearing polypropylene gloves into pre-combusted glass amber bottles (450oC for 24 hours) and stored on ice (1-5 hours) until returning to the lab or an alternate nearby facility. Water was then filtered using the same protocols stated in Part I of this dissertation. For DOC measurements, sample water was stored frozen for up to one year, until thawed for analysis. Prior to absorption and fluorescence analyses, samples were either stored refrigerated for no more than two days or frozen and then slowly thawed depending on instrument availability. Using the protocols in Part I, absorption spectra were measured to determine if and to what extent dilution was needed following Green and Blough (1994). Appropriate dilutions were made, and then water was reanalyzed for absorption and subsequently analyzed for excitation emission fluorescence spectroscopy. Again, stated in Part I are the procedures for sample processing for all analyses.
53
Mississippi Atchafalaya
Apalachicola Suwannee
Hillsborough Alafia Manatee Peace Caloosahatchee Shark
Figure 2.1. Map showing locations of the rivers sampled in Florida (top) and in Louisiana & Mississippi (right). Rivers include the Atchafalaya, Mississippi, Apalachicola, Suwannee, Hillsborough, Alafia, Manatee, Peace, Caloosahatchee, and Shark River. 54
Table 2.1. Locations (GPS positions and landmarks) of river samples. River Alafia
Landmark DeSoto Road Riverview Park US 41 Williams Park Apalachicola Breakaway boat ramp Water Street 98 Causeway US 98 Bridge St. George Island Atchafalaya Berwick Caloosahatchee Port La Belle Franklin Rec. Area Ft. Myers Freemont St Riverside Drive Yacht Club Commun. Park Dennis Drive Hillsborough E. Pocohontas Sligh Ave W Indiana & N Ridge Riverfront Park Green St Blake Co River Park Manatee Rye Wilderness Park Colony Cove Marina Wellon Ranch Rd 45th Ave E off 301 41 and US 301 Bridge Mississippi Cypress Cove Marina Peace Navagator Marina Harbor Heights US41 Bridge SeaTow Dock Matlacha Park Shark No landmark No landmark No landmark No landmark Suwannee Bradford Road Shellmound Cedar Key
Latitude 27.87669 27.86606 27.86040 29.75860 29.72373 29.95234 29.73489 29.66946 29.69413 26.93010 26.72132 26.66008 26.66013 26.58992 26.54260 26.52234 28.00843 28.01058 28.06670 27.95200 27.95536 28.06670 27.51370 26.98125 27.52877 27.51834 27.50741 29.69412 27.06089 26.98881 26.95172 26.59078 26.95720 25.39775 25.38892 25.37440 25.35644 29.32198 29.20650 29.16381
55
Longitude -82.31293 -82.31868 -82.38473 -85.02423 -84.98081 -84.46589 -84.90253 -84.86631 -91.21608 -82.27322 -81.69451 -81.84961 -81.84957 -81.89789 -81.95205 -81.96517 -82.41619 -82.46420 -82.45360 -82.46604 -82.46551 -82.45360 -82.36763 -82.00112 -82.48275 -82.51874 -82.56266 -91.21607 -82.00137 -81.99413 -82.06118 -81.89753 -82.06083 -80.96960 -81.01080 -81.04466 -81.10743 -83.14429 -83.06982 -83.02714
RESULTS & DISCUSSION Riverine Fluorescent DOM Concentrations A scatter plot of riverine CDOM fluorescence intensity (Ex/Em = 300/430 nm) as a function of salinity is shown in Figure 2.2. For reference, data for the West Florida Shelf (WFS) has also been included. One result of this two year seasonal study is that two trends were established and are based on regional differences. Generally, river systems in the northern portion of the field study (Atchafalaya to Alafia River) have less fluorescence per freshwater unit compared to rivers to the south (Manatee to Shark River). One exception to this is the Suwannee (represented by the black outlined gray squares), which is significantly more colored than the remaining northern rivers. The
Figure 2.2. CDOM fluorescence at Ex/Em 300/430 nm for ten rivers that supply the Eastern Gulf of Mexico. Stream data are generally separated into two lines, based on latitude. Open black diamonds around solid symbols represent 2004 hurricane season. 56
Suwannee is a swamp-fed river, with similar landscape characteristics to rivers found in South Florida. Seasonality in CDOM fluorescence was also observed, and is related to river discharge. Highest intensities were found for samples taken during the active hurricane season of 2004. This seasonality is also responsible for the low r-squared values within each watershed. An example of this is shown in Figure 2.3. Here, mixing lines for three of Tampa Bay’s rivers are shown. Tampa Bay was chosen as the example because it is geographically situated where the break in mixing lines occurs. The Hillsborough and Alafia rivers plot along the Northern-river line and the Little Manatee and Manatee plot along the Southern-river line. As evident from this figure, during low-
Figure 2.3. CDOM fluorescence at Ex/Em 300/430 nm for Tampa Bay rivers. Dry seasons (solid lines) exhibited less fluorescence, compared to wet seasons (dashed lines).
57
flow conditions (dry season), there is less color in each of the rivers, with little variability between years. For the wet season, however, rivers were found to be more colored. Also, the response of each river to discharge patterns varies. The Manatee River exhibits the same wet-season mixing line, regardless of year. The Hillsborough and Alafia, however, show significantly higher color during 2004 compared to 2005, where values at the freshwater endmembers approach that of the Manatee River to the south. Again, this is most likely attributed to the large amount of rainfall and discharge due to the active 2004 hurricane season in South Florida.
Regional and seasonal differences of each river are apparent in the top-panel histogram in Figure 2.4A, where dry seasons are represented by solid bars and wet seasons are represented by striped bars. Tables of fluorescence, absorption and DOC data are located in Appendices I and II.
58
Figure 2.4A. Histograms of fluorescence intensity, absorption coefficient and fluorescence efficiencies for all rivers. Latitude of rivers decreases from left to right within plots. Dry seasons are shown with solid bars, wet seasons are shown with striped bars, with increasing year from left to right. 59
Figure 2.4B. Histograms of DOC concentration, position of humic peak C maximum and fluorescence ratios for all rivers. Latitude of rivers decreases from left to right within plots. Dry seasons are shown with solid bars, wet seasons are shown with striped bars, with increasing year from left to right. 60
Riverine Absorption Measurements Regional differences were less apparent in the relationship between fluorescence and the absorption coefficient at 312 nm (Figure 2.5). However, fluorescence efficiencies did exhibit seasonality. Shown here is the drastic increase in fluorescence intensity relative to absorption during the 2004 wet season. To clearly see seasonal trends in this relationship, Figure 2.6 shows a subset of the data for the Caloosahatchee and Peace Rivers in Charlotte Harbor and the Manatee River in Tampa Bay. Although the rivers
Figure 2.5. CDOM fluorescence at Ex/Em 300/430 nm as a function of absorption coefficient at 312 nm. Outlined symbols are samples that were taken in the streams during the 2004 active hurricane season in Florida.
61
Figure 2.6. CDOM fluorescence at Ex/Em 300/430 nm as a function of absorption coefficient at 312 nm for Charlotte Harbor rivers and Manatee River in Tampa Bay. As shown here, seasonality is apparent for regional subsets.
ultimately feed two different estuaries, they are affected by similar weather patterns and the streams traverse similar landscapes. Source waters of the Manatee and Peace Rivers are similar, but the Caloosahatchee River originates at Lake Okechobee, which experiences controlled releases. What is visible here is that during both dry seasons, a quasi-constant relationship exists between fluorescence and absorption. In contrast, the wet seasons showed two different regressions for CDOM. Implicated in the cause for the higher fluorescence efficiency in 2004 is the increase in discharge resulting from daily precipitation and frequency of hurricanes during that period. Increase in discharge from landscape runoff generally yields organic material with more efficient fluorescence 62
properties, due to the presence of large organic macromolecules from soils and plant litter. This is not the case, however in the wet season of 2005, where less fluorescence per unit absorption was observed. This is in part due to the late start of the rainy season that year and because the rivers were sampled early in the season. A possibility as to why the relationship was not only lower than the previous wet season, but also the dry seasons may be because of higher sunlight, increased water temperature, and age of terrestrial material in the stream. At the cusp between the end of a dry season and start of the subsequent wet season, organic material in the stream has been in the water for longer periods of time with exposure to sunlight, higher water temperatures and microbiota that can degrade the material, thereby decreasing its efficiency (refer to Figure 2.4A middle and bottom panels for histogram representation). Interestingly, this is also the same season where the hypersaline waters were found on the West Florida Shelf. This illustrates the need to measure these parameters over more frequent temporal scales, for longer-durations and over wider ranging spatial scales to determine the variability and how it is affected by basin and climatic patterns. This information is critical for understanding CDOM quantity and quality that supply the estuaries and ultimately the shelf.
Riverine Dissolved Organic Carbon Of great importance in coastal environments is the establishment of CDOM as a proxy to derive DOC in coastal watersheds. Recent work by McKnight et al. (2001, 2003), Baker and Spencer (2004) and others has shown good agreement between these parameters in certain regions. Also, an excellent summary of the relationship can be found in Del Castillo (2005). Figure 2.7 illustrates how fluorescence intensity varies with DOC for all the rivers sampled. Again, scatter in this relationship is due, in part, to seasonality and also regional differences in watersheds (Figure 2.4B, top histogram). Viewing only a subset of rivers (ones supplying Tampa Bay and Charlotte Harbor) allows for calculating better regressions, especially during high-flow conditions (Figure 2.8). These relationships hold promise for estimating freshwater organic carbon export from
63
fluorescence intensity during limited time periods for these estuaries. This, along with the histograms in Figure 2.4B, illustrates that although the water contribution of large rivers to the Gulf of Mexico may be greater (ie. The Mississippi River), the organic carbon delivery by the smaller, organic-rich rivers to the south can be quite significant because of higher DOC concentrations per liter of river water.
Figure 2.7. The relationship between CDOM fluorescence and DOC for river and West Florida Shelf waters for all seasons sampled.
64
Figure 2.8. The relationship between CDOM fluorescence and DOC for Tampa Bay (top), Charlotte Harbor and Shark Rivers (bottom).
65
Riverine Spectral Properties Multi-spectral fluorescence measurements produce Excitation-Emission Matrices (EEMs), which allow for determination of spectral shape, position of peaks and how the humic peaks change relative to each other. Examples of EEMs from each of the rivers sampled during a dry season are in Figure 2.9A & B. The contours have been scaled to the maximum fluorescence value in the Humic Peak A region (Ex ~ 240 / Em ~ 400-460 nm), so as to compare not the intensity, but spectral differences. These optical properties relate to the chemical composition of the organic material, where longer wavelengths are indicative of larger, more complex, highly aromatic compounds. Visually comparing the EEMs, it is possible to see positional and shape differences in Humic Peak C (Ex 320360 / Em 420/460 nm), which is also supported by the middle histogram in Figure 2.4B. Longest wavelengths were found for waters in the Suwannee River and shortest were for the Hillsborough River. Looking at the position differences as a function of salinity (Figure 2.10) it is obvious that streams show much geographical and seasonal variability, not only at the endmember, but along the salinity gradient as well. One important note is the effect of the 2004 hurricane season on the position of fluorescence maximum. Included in Figure 2.10 are the WFS data, where the most blue-shifted samples occurred right after the passage of Hurricane Charley, due to offshore ocean water being pushed inshore. In the southern streams, however, the hurricane yielded the most red-shifted material as a result of the rapid accumulation of runoff in the stream beds.
In addition to position, the spectral shape can also offer insight regarding the chemistry of organic material. Plotting individual spectra from each EEM at excitation 300 nm, and normalizing to remove intensity differences allows for comparing the spectral shape. Figure 2.11 illustrates these differences, where colors of rivers correspond to the colors in the histogram plots previously shown. One way to interpret this plot is that the steeper peaks, like the curves for the Atchafalaya, Mississippi, Apalachicola and Alafia Rivers, result from less complexity in the organic material. The Suwannee has the lowest relative peak height and width and plots along with the Manatee and Peace Rivers, all of which are organic-rich river systems. The bold-shaped curves found in the middle, are 66
Figure 2.9A. EEMs contours for rivers taken at zero salinity during dry season. River names are located in the top left corner of each panel. Scale set to maximum value of Humic Peak A for comparison of spectral properties.
67
Manatee plot scaled to 180 QSE
Caloosahatchee plot scaled to 395 QSE
Peace plot scaled to 325 QSE
Shark plot scaled to 350 QSE
Figure 2.9B. EEMs contours for rivers taken at zero salinity during dry season. River names are located in the top left corner of each panel. Scale set to maximum value of Humic Peak A for comparison of spectral properties.
68
Figure 2.10. Position of Humic Peak C/M maximum as a function of salinity for river and West Florida Shelf waters for all seasons sampled. Shortest wavelengths at high salinities resulted from Hurricane Charley, as did the longest wavelengths in southern rivers.
69
Figure 2.11. Normalized emission spectra at Ex = 300nm for all rivers. Line colors correspond to river colors in previously shown histograms.
70
for the Hillsborough, Caloosahatchee and Shark, which incidentally are all controlled rivers in one form or another. Calculating the ratio between the fluorescence peak maximum and the value at 500 nm for excitation 300 nm yields a quantitative description of differences between these watersheds (bottom histogram in Figure 2.4 B). Northern rivers exhibit the highest ratios, which were followed by the controlled-flow rivers from both the southern and northern regions. The southern, free flowing rivers had the lowest ratios of all rivers sampled. Once again, the Suwannee River is the exception, showing more similarity to the southern streams.
Implicated in the cause of regional differences in riverine organic matter are basin and land use characteristics, but to date have not been thoroughly investigated for this region. Work done by Dr. Barnali Dixon and others at the USF Geo-spatial Analysis Lab comparing Tampa Bay and Charlotte Harbor streams has shown that land use, land elevation, soil run off, soil organic carbon content, and land permeability have great influences on the materials within these rivers (unpublished data, pers. commun.). It was established that the Manatee and Peace Rivers had a greater proportion of low-elevation lands compared to the Hillsborough and Alafia Rivers, significantly greater agricultural land use compared to the higher percentage of urbanization for northern watersheds, and a greater fraction of poorly drained soils. As a first cut, these findings help to explain some of the geographical differences observed in the rivers sampled in this study.
High-Resolution Sampling The results of this study illustrate the need for more effective sampling strategies. Seasonal collection of discrete samples at a few locations along a river is not adequate for truly resolving the spatial and temporal variability within a stream. To accomplish this, both resolution scales need to be finer, which may be achieved with more frequent sampling, or ideally, with in situ sensors mounted on monitoring platforms. One technique tested during the course of this project, was the mounting of an in situ multispectral fluorometer (SAFire) on a Guided Surface Vehicle (GSV), that was deployed in the Hillsborough River to assess spatial variability of water quality parameters in natural 71
and urban locales (Casper et al., 2008). Spatial distributions of CDOM fluorescence at the two locations are shown in Figure 2.12. This figure is merely to show that changes in fluorescence were found to occur over small distances and that the current sampling strategies that are used to measure materials in many rivers are unable to detect these variations.
Figure 2.12. Spatial distribution of COM in an urban locale (left) and natural locale (right) in the Hillsborough River. High resolution, in situ measurements of multi-spectral COM allow for better spatial and temporal measurement scales. 72
Historical Color Measurements The color of water is routinely measured by many regional water management and monitoring agencies, as it is a visual measurement of water clarity and ecosystem health. Changes in the color of a water body can be used to infer alterations in land use practices, landscape changes and shifts in climatic patterns. In Tampa Bay, a thirty year record exists for color as well as other water quality parameters for the estuary and rivers. Plotted in Figure 2.13 (top panel) is the color value in Platinum Cobalt Units for the mouth of the Alafia River for years 1973-2006 along with discharge data from the USGS (bottom panel). During the most recent years, an increase in color corresponds to increases in discharge. This was not necessarily the case in the 1970’s and 1980’s, when Tampa Bay had a lower proportion of urbanized lands. A study done by Xian and Crane (2005) found that the transformation of landscape from natural to impervious urban land in Tampa Bay increased three-fold from 1991 to 2002, resulting in a 27% coverage of these impervious lands in Tampa Bay. Alterations like these to watershed landscapes are one possible explanation for changes in organic carbon content and color in coastal waters, which is demonstrated in Freeman (2001).
73
Figure 2.13. Historical time series of color at the mouth of the Alafia River in Tampa Bay (top). Records indicate an increase in color values during the past 30 years although the mean monthly discharge for the Alafia has been fairly constant (bottom). Sources of data are the EPCHC (Environmental Protection Commission of Hillsborough County) and USGS.
74
CONCLUSIONS Examined here were differences in the optical properties of CDOM for ten rivers from the Atchafalaya/Mississippi River system to the Shark River. Fluorescence and absorption techniques were used to distinguish both regional and seasonal variability in these watersheds. It was found that CDOM in rivers that supply the shelf is regionally dependent, where southernmost rivers generally have higher fluorescence intensities compared to northern watersheds. This was also true for DOC concentrations. Spectral properties also were watershed-specific, where fluorescence ratios were lowest for southern rivers without controlled flow. This is attributed to the presence of more complex, highly aromatic organic material from less urbanized settings. Comparisons between the basin characteristics (soil runoff, soil permeability and land use) of Tampa Bay and Charlotte Harbor were also made to help explain differences in the optical properties of streams.
Seasonal differences were also found, where high-flow, summer seasons exhibited the largest fluorescence intensities. The results of the efficiency of the material, however, demonstrated that differences in climatic and discharge patterns can have a strong influence on this parameter. Intermittent weather phenomena (ie. hurricanes) were also shown to have a significant effect on the optical properties of CDOM in streams. Findings were also compared to historical color values from 1973 to 2006 from the mouth of the Alafia River in Tampa Bay. Long-term trends show a tripling of color values that coincide with a three-fold increase in impervious urban lands and also no clear trend in discharge patterns.
Recommendations for future studies of organic matter in rivers include (1) the need to thoroughly evaluate the variability of materials of interest with differences in landscape parameters and climate patterns, and (2) the need to implement advanced sampling strategies with in situ sensors. Combined, these two approaches will yield improved resolution (temporal and spatial) and allow for making inferences about CDOM quantity and quality in river streams, and ultimately estuaries and shelf environs. 75
PART III:
Characterization of subsurface terrestrial CDOM sources to Tampa Bay, Florida
76
INTRODUCTION Subsurface waters constitute 95% of all global, unfrozen freshwater reserves (National Ground Water Assoc. website www.ngwa.org). Even though groundwater is the largest freshwater reservoir, there have been relatively few studies on its contribution to surface waters. This is in part due to the difficulty in collecting measurements of water flow and the constituents therein (Burnett et al., 2002). Hence, it can be challenging to determine the role of groundwater in budgets for materials such as nutrients, metals, pollutants, inorganic and organic carbon (Moore 2003). Determining the amount and nature of the organic material in an aquifer is significant given its reactive nature which influences other materials of interest (Aiken, 2002), its ability to control a number of geochemical, microbial and environmental processes (Aiken, 2002; Kroeger et al., 2007), and its role in the global carbon budget.
There are various ways in which groundwater is transferred to surface waters. The first type of exchange is via localized springs that may supply water to streams, which in turn supply estuaries and the coastal ocean. The second is via Submarine Groundwater Discharge (SGD) where water is more diffusely exchanged through sediments beneath a water body. The latter is now acknowledged as an important flux of materials to the coastal ocean (Moore, 1999; Burnett et al., 2002; Kelly and Moran, 2002; Moore et al., 2002; Moore, 2003). The extent of importance of each route is dependent on regional geology, hydraulic head gradients between reservoirs, and thickness of the overburden deposits. Added to these hydrogeologic characteristics are the effects of climate and society’s increasing demand on ground water reserves (Swarzenski et al., 2001), all of which serve to complicate our understanding of groundwater.
In recent decades, new light has been shed on the importance of groundwater contribution to estuaries and the coastal ocean due to improvements in tracer techniques (Moore, 1999; Krest et al., 1999; Burnett et al., 2001; Swarzenski et al., 2007). The combined use of naturally occurring isotopes and other chemical tracers (O-18, H2, Rn-222, Ra223,224,226,228, Sr87/86, 13C, 15N, and major dissolved species) along with 77
geochemical modeling have been used to quantify interactions between surface and subsurface water reservoirs (Katz, 2002). Although these techniques have advanced the understanding of the role of groundwater in surface environments, there still exist limitations of these techniques, such as speed of measurement and the lack of an ideal tracer for riverine, estuarine and oceanic environs.
One technique not previously applied to groundwater detection, is Excitation Emission Matrix Spectroscopy (EEMS) of Colored Dissolved Organic Matter (CDOM). This fluorescence tool has been routinely used as a tracer of surface waters due to the source dependent nature of CDOM. Additionally, fluorescence measurements are less time consuming than alternate techniques and have the added benefit of real-time collection with in situ sensors. There have been limited studies investigating CDOM fluorescence intensity and spectral properties in aquifers (Vodacek, 1992; Baker and Lamont-Black, 2001; Khan et al., 2007), but none attempting to use fluorescence as a tool to discern groundwater contributions to surface waters. Therefore, investigating CDOM quantity and quality in groundwater is warranted (Aiken, 2002) and may offer a relatively inexpensive and rapid way to fingerprint subsurface waters.
Previous work in Tampa Bay tended to focus solely on marine and fluvial input of CDOM but not on the contribution from groundwater, which is estimated as 50 million gallons per day, or 20% of the combined surface water runoff (Swarzenski et al., 2001). Given that South Florida is dominated by carbonates and sands (Figure 3.1, Brooks and Doyle, 1998), with a porosity that favors exchange of subsurface and surface waters, this groundwater input may likely be an underestimated source of CDOM to these coastal waters with distinct biogeochemical cycling. This work is a novel approach to (1) characterize CDOM in the groundwater endmembers in the aquifers in the Tampa Bay region and (2) determine optical proxies to detect groundwater presence in the surface waters. The results of this type of approach serve to provide better techniques to determine groundwater sources with monitoring 78
networks and ultimately remotely sensed measurements from space with the advent of improved satellite technology.
79
Longitude
Latitude
Figure 3.1. Map of Tampa Bay showing calcium carbonate content (left), total organic carbon content (middle), and major sediment facies (right) in bottom sediments. Figure amended from Brooks and Doyle, 1998.
80
METHODOLOGY Regional Setting / Hydrogeologic Framework of Florida The aquifer system of Florida can be divided into three main zones (Miller, 1986) (Figure 3.2). The surficial aquifer system is the uppermost aquifer and is unconfined, relatively thin, and consists of unconsolidated sand, shell and limestone. In the Tampa Bay region this aquifer is approximately 50 ft. thick (Wolansky et al., 1985). Below this, is the intermediate aquifer system, which is comprised of clastic sediments interbedded with carbonate rocks and is no more than 250 ft thick in Tampa Bay (Dehaven et al., 1991). Beneath the intermediate aquifer system lays the Upper Floridan aquifer, which consists of a thick vertically stratified sequence of limestone and dolomite. This aquifer is greater than 1000 ft deep (Hutchinson, 1983), where waters in this system have been estimated at >10,000 year old (Meyer, 1989). Each of the aquifer systems and permeable zones are separated by layers of interbedded clays and fine-grained clastics (Torres et al., 2001).
Figure 3.2. Hydrogeologic framework of Florida depicting the three main zones of the Florida aquifer system. Figure amended from Tihansky, 1999.
81
Tampa Bay Sample Collection Surface water samples were obtained from various sites within the Tampa Bay estuary system during March-April 2006 (Figure 3.3) aboard a 19’ Parker boat. Collection was conducted wearing polypropylene gloves, filling large pre-ashed glass amber bottles with bay water from just below the surface to avoid contamination by the presence of any microlayer. Whole water was filtered through pre-combusted GF/F filters (up to 24 hours at 450oC) on site using a portable glass filtration apparatus and hand pump. Filtered water was transferred to pre-combusted, amber glass bottles and then stored on ice until
Latitude
returning to the laboratory.
Longitude
Figure 3.3. Map of Tampa Bay denoting sampling locations within the estuary (closed circles) and well locations surrounding Tampa Bay (closed triangles are aquifers deeper than 130 ft, open triangles are aquifers shallower than130 ft). 82
In situ measurements of salinity, conductivity, temperature, and pH were also taken via a Hydrolab Sonde. Samples for DOC analysis were stored frozen until all collection was complete, then thawed and measured using the protocol stated in Part I of this dissertation. Samples for absorption and fluorescence analyses were stored refrigerated for no more than two days. Absorption spectra were measured to determine if and to what extent dilution was needed following Green (1992). Appropriate dilutions were made, and then water was stored frozen until reanalyzed for absorption and analyzed for excitation emission fluorescence spectroscopy.
Aquifer Sample Collection Water samples from the surficial, intermediate and deep Floridan aquifers were obtained via wells maintained by the Southwest Florida Water Management District (SWFWMD) during March 2006. Nine wells were chosen based on a range of aquifer depths, geographic proximity to the bay and to various rivers that supply water to the estuary (Figure 3.3 and Table 3.1). In situ measurements of salinity, conductivity, temperature, pH and dissolved oxygen were also taken using a portable unit operated by SWFWMD. Water for CDOM and DOC analysis was collected using the methods described previously in Part I of this dissertation. Since existing sampling protocols for spectroscopy have not been tested for groundwater samples, a freezing experiment was conducted for the Floridan aquifer at the Buckhorn Spring site. Absorption and EEMs analysis were conducted on refrigerated and frozen sample water to determine if there was any significant change in chromophores or fluorophores.
Results from this
experiment show that the percent decrease in fluorescence peak intensity varied between 2.9 and 6.7% for various wavelength pairs in the humic peak regions where the percentage decreased with increasing excitation wavelength. Peak position had minimal variation with no change in excitation, and 3.6% for Humic Peak C and 5.2% for Humic Peak A emission.
83
Table 3.1. Location and environmental data for groundwater wells in the Tampa Bay region. Sample measurements include temperature, salinity, pH, CDOM fluorescence and absorption, Dissolved Organic Carbon and Radium. Superscripts 1,2, and 3 represent the Floridan, Intermediate and Surficial aquifers, respectively. Well Name 1
Romp 51 Elapp Speedling Inc1 Buckhorn Main Spring1 CNB#31 Snead's Island 2291 Palma Sola W. Davis2 Romp TR 10-23 Eureka Springs 6823 Romp TR 8-13
Well Name Romp 51 Elapp1 Speedling Inc1 Buckhorn Main Spring1 CNB#31 Snead's Island 2291 Palma Sola W. Davis2 Romp TR 10-23 Eureka Springs 6823 Romp TR 8-13
Case depth (ft)
Latitude
365 300 Spring 128 200 196 13 4 17
27.67575 27.67778 27.88937 28.01521 27.53320 27.51510 27.90043 28.01390 27.58319
235 235 235 230 240 240 235 235 235
415 418 421 424 413 419 425 432 434
Longitude
Temper. (degrees C)
Salinity
pH
-82.42183 27.92 0.52 7.10 -82.47944 24.62 0.52 7.32 -82.30271 23.62 0.23 7.36 -82.35193 24.55 0.3 7.44 -82.62503 24.64 1.1 7.00 -82.66284 25.35 1.66 7.18 -82.37309 20.21 0.82 6.91 -82.34528 18.39 0.7 6.64 -82.54608 23.07 0.47 6.99 Fluor. Fluor. Ex Humic Em Humic Intensity Em Humic Intensity Peak A Peak A Humic Peak Ex Humic Peak C Humic Peak (nm) (nm) A (QSE) Peak C (nm) (nm) C (QSE) 56.82 69.47 6.82 40.28 61.31 62.50 212.36 232.22 230.73
320 320 320 315 320 320 320 320 315
84
412 412 411 421 408 410 419 426 426
28.91 36.48 3.57 17.80 32.46 31.82 105.40 120.93 116.98
Sample Date
Local Time
3/16/2006 3/20/2006 3/16/2006 3/16/2006 3/17/2006 3/17/2006 3/16/2006 3/16/2006 3/17/2006
14:15 10:00 12:00 7:30 10:30 13:25 16:05 8:30 8:00
26.98 33.88 3.33 16.25 29.81 29.35 95.12 108.71 103.74
26.01 32.65 3.28 16.98 28.18 27.98 99.57 117.78 113.42
DOC (µM)
104.69 149.36 30.47 71.82 80.10 116.87 529.10 670.64 501.46 Fluor. ratio Ex/Em = Ex/Em = Em 430:400 300/400 300/430 nm @ Ex nm (QSE) nm (QSE) 300 nm 0.964 0.964 0.986 1.044 0.945 0.953 1.047 1.083 1.093
Table 3.1. (cont.)
Well Name Romp 51 Elapp1 Speedling Inc1 Buckhorn Main Spring1 CNB#31 Snead's Island 2291 Palma Sola W. Davis2 Romp TR 10-23 Eureka Springs 6823 Romp TR 8-13
Spectral Slope 280312nm (m-1)
a(312) (m-1)
a(440) (m-1)
0.01002 0.01654 0.01049 0.00443 0.02011 0.01230 0.00898 0.01267 0.01551
7.51 4.17 1.07 13.61 2.41 6.25 32.12 40.55 17.99
1.31 0.73 0.27 4.84 0.11 2.31 8.79 8.93 1.76
Fluor. @ 300/430 nm / Ra-223 Ra-224 Ra-228 Ra-226 a312 (QSE*m) (dpm / 100L) (dpm / 100L) (dpm / 100L) (dpm / 100L) 3.47 7.82 3.07 1.25 11.69 4.47 3.10 2.90 6.30
85
22.29 39.87 0.44 23.18 76.29 40.79 20.00 25.60 9.64
38.10 33.01 6.51 41.62 89.47 53.19 202.31 98.81 57.46
19.22 14.33 26.09 9.51 29.45 32.82 91.62 35.17 22.83
505.49 577.40 273.64 670.02 2181.98 2173.70 968.34 167.98 440.16
Radium Sample Collection Water from the bay and from the aquifers was also collected for radium-223,224,226,228 analyses (Figure 3.4). Forty liters of water was collected into a plastic carboy and then subsequentially pumped through a custom made column of manganese-coated acrylic fiber to extract radium from the sample water (Moore, 1976; Dulaiova and Burnett, 2004). Flow rate was kept below 1.4 L m-1 to ensure adequate adsorption of radium onto fiber. The fiber was then removed from the columns and placed into plastic sealable bags and brought to the laboratory.
Radium Quartet Analysis In preparation for Ra-223 and Ra-224 analysis, the Mn-fiber was partially dried and placed in an air circulation system (Moore and Arnold, 1996). Helium was circulated over the fiber and through a scintillation cell where alpha particles from the decay of radon and daughters were recorded with a PMT attached to the cell. Signals are routed to a delayed coincidence system designed by Giffin et al. (1963) and adapted by Moore and Arnold (1996). The delayed coincidence system uses the difference in decay constants of the short lived Po daughters of Rn-219 and Rn-220 to identify alpha particles derived from Rn-219 and Rn-220 decay. Because samples were not reanalyzed 6 weeks later, initial excess of Ra-224 could not equilibrate with Th-228 adsorbed onto the fiber. However, the thorium peaks in gamma results were used to correct for this.
Upon completion of the short lived radium analysis, the Mn-fiber was leached with hot 6 M HCl in a Soxhlet extraction column to release Ra-226 and Ra-228, which were then co-precipitated from the acid solution with BaSO4. The supernatant was decanted or aspirated, and the precipitate was concentrated by centrifuging. Activities were measured one year later using two low background, high purity germanium well detectors manufactured by Canberra. An IAEAA Baltic sea standard (supplied by Dr. J.M. Smoak) was also analyzed in both detectors and served as a means to calibrate counts into activities for all samples.
86
Figure 3.4. Uranium-Thorium decay series. Vertical arrows denote alpha decay, while diagonal arrows denote beta decay. Ammended from Swarzenski et al. 2000.
87
RESULTS & DISCUSSION High correlation between fluorescence intensity and salinity was found for Tampa Bay estuary and river waters during March – April 2006 (Figure 3.5). Riverine waters follow the same mixing lines that were established in Part II of this dissertation. Gray squares represent the southern rivers (located down bay in the Tampa Bay Estuary) and Gray circles and triangles represent the northern rivers (located up bay in the Tampa Bay Estuary), two mixing lines were calculated based on geographic setting (northern-up bay and southern-down bay). Results of the groundwater samples are also plotted in Figure 3.5, where it was found that the surficial aquifer wells were similar in concentration to the rivers (dark circles). This is not unexpected, as this shallow unconfined aquifer exchanges water and materials with the overlying surface waters. The deeper aquifers, however, are quite low in fluorescence (dark squares) and more similar to the higher salinity samples. Values are listed in Tables 3.1 and 3.2.
Figure 3.5. CDOM fluorescence intensity as a function of salinity for estuary, river, and groundwater samples in Tampa Bay during March-April 2006. 88
Table 3.2. Location and environmental data for surface samples in the Tampa Bay Estuary. Sample measurements include temperature, salinity, pH, CDOM fluorescence and absorption, Dissolved Organic Carbon and Radium.
Station Number 1 2 3 4 5 6 7 8 9 10 11 12 13 14 15 16 17 18
Latitude Longitude 27.6001 -82.7368 27.5303 -82.6538 27.7245 -82.4898 27.8471 -82.4087 27.9206 -82.4747 27.8791 -82.4577 27.8244 -82.4446 27.9187 -82.5897 27.8697 -82.5746 27.7943 -82.586 27.7641 -82.6029 27.7679 -82.5011 27.7377 -82.5313 27.7038 -82.5596 27.717 -82.6161 27.6736 -82.6067 27.6359 -82.6444 27.5755 -82.6651
Sample Temperature Depth (m) (degrees C) 0 20.83 0 21.29 0 21.97 0 22.43 0 21.71 0 26.88 0 21.45 0 20.08 0 26.57 0 20.51 0 20.13 0 21.56 0 21.51 0 20.95 0 21.05 0 22.12 0 20.93 0 21.26
Salinity 36.03 33.22 29.41 26.14 26 26.9 27.63 25.67 26.58 28.71 28.98 28.55 30.31 33.32 30.77 32.56 34.95 33.75
89
pH 8.38 8.4 8.54 8.53 8.41 8.47 8.52 8.4 8.49 8.35 8.36 8.37 8.48 8.5 8.44 8.43 8.4 8.36
Sample Date 4/1/2006 4/1/2006 3/31/2006 3/30/2006 3/30/2006 3/30/2006 3/30/2006 3/30/2006 3/30/2006 3/31/2006 3/31/2006 3/31/2006 3/31/2006 3/31/2006 3/31/2006 4/1/2006 4/1/2006 4/1/2006
Local Time 9:03 9:51 15:45 15:35 12:50 14:40 16:15 9:57 10:56 8:50 9:30 13:40 15:10 16:24 10:23 11:44 11:06 10:39
DOC (µM) 120.88 154.70 85.38 355.42 299.89 325.74 321.72 380.94 348.20 208.40 214.16 233.17 269.08 171.42 221.46 173.31 135.43 155.02
Table 3.2. (cont.)
Fluor. Intensity Ex Humic Station Ex Humic Em Humic Humic Peak Peak C Number Peak A (nm) Peak A (nm) A (QSE) (nm) 1 235 415.25 10.48 300 2 240 418.82 22.95 300 3 235 420.13 38.68 300 4 235 417.01 51.82 300 5 235 417.61 56.24 300 6 240 418.22 47.96 300 7 235 418.82 47.12 300 8 235 417.01 52.54 300 9 240 418.90 49.76 300 10 240 417.61 40.37 300 11 235 418.82 38.52 300 12 235 419.98 41.07 300 13 235 419.52 33.76 300 14 235 422.39 21.55 300 15 235 415.85 32.01 300 16 240 419.98 23.69 300 17 240 419.98 15.47 300 18 240 421.78 19.27 300
Fluor. Fluor. ratio Em Humic Intensity Ex/Em = Ex/Em = Em 430:400 nm @ Ex Peak C Humic Peak 300/400 300/430 300 nm (nm) C (QSE) nm (QSE) nm (QSE) 404.35 5.33 5.25 4.97 0.947 409.98 11.37 11.25 11.01 0.979 413.51 19.19 18.73 18.71 0.999 409.98 26.18 25.83 25.07 0.970 413.76 27.54 26.89 26.72 0.994 414.38 23.71 23.25 23.01 0.990 412.49 23.71 23.32 22.71 0.974 409.43 25.48 25.04 24.46 0.977 409.69 25.08 24.75 24.00 0.970 413.76 20.32 20.03 19.63 0.980 411.26 19.07 18.77 18.44 0.982 415.00 20.87 20.43 20.16 0.987 410.99 16.72 16.39 16.09 0.982 413.15 10.80 10.60 10.44 0.985 413.15 15.87 15.57 15.32 0.984 411.87 11.73 11.59 11.30 0.975 409.98 7.61 7.55 7.41 0.981 412.49 9.61 9.36 9.34 0.998
90
Table 3.2. (cont.)
Station Number 1 2 3 4 5 6 7 8 9 10 11 12 13 14 15 16 17 18
Spectral Slope 280312nm (m-1) 0.03288 0.02758 0.02479 0.02388 0.02579 0.02303 0.02532 0.02859 0.02488 0.02585 0.02518 0.02589 0.02699 0.02801 0.02657 0.02748 0.02822 0.02861
a(312) (m-1) 1.19 2.87 5.19 6.64 6.15 6.72 5.40 4.96 5.86 4.75 4.74 4.73 4.42 2.61 3.67 2.83 2.07 2.40
Fluor. 300/430 nm / a312 Ra-223 Ra-224 Ra-228 Ra-226 a(440) (m-1) (QSE*m) (dpm / 100L) (dpm / 100L) (dpm / 100L) (dpm / 100L) -0.08 4.16 0.71 1.96 11.20 67.41 -0.03 3.83 20.32 69.67 31.73 169.17 0.37 3.60 23.54 55.30 49.51 292.86 0.39 3.77 33.13 64.03 59.89 352.11 0.18 4.35 31.13 44.55 55.15 354.96 0.69 3.42 29.16 44.62 58.90 330.76 0.19 4.21 21.34 50.29 64.77 335.48 -0.06 4.93 22.77 43.95 93.59 395.77 0.44 4.10 12.38 54.77 67.67 314.33 0.24 4.14 11.20 38.93 47.72 248.62 0.24 3.89 2.97 10.72 43.62 250.25 0.17 4.26 10.69 28.63 50.75 281.77 0.19 3.64 15.16 50.17 41.33 219.36 0.01 4.00 11.85 35.86 26.58 151.00 0.05 4.17 11.19 42.18 40.03 196.82 0.04 3.99 10.94 38.11 30.00 161.31 0.04 3.58 11.96 46.80 20.88 107.49 0.02 3.89 13.45 47.13 27.79 147.59
91
A spatial representation of salinity and CDOM fluorescence in Tampa Bay is shown in Figure 3.6 (left and middle panels). The distributions of both parameters look identical, where highest fluorescence was coincident with lowest salinities. Radium-226 concentrations plotted spatially also follow the same distribution pattern (Figure 3.6, right panel). Although samples were taken over a three day period, and therefore not synoptic, plotting the data in this way is justified based on estuarine model results from the USF Ocean Monitoring and Prediction Lab under the direction of Dr. Mark Luther. Their model suggests there is minimal change in the salinity over tidal stages during the dry season in Tampa Bay (Dr. Steve Meyers, per commun.). Using only concentration of fluorescence or radium-226 does not offer much information about the location of groundwater contributions for this time period.
DOC in Tampa Bay is highly correlated with CDOM fluorescence. Figure 3.7 shows the regression line for the two parameters and suggest that it is possible to estimate DOC from fluorescence in the bay, in the rivers and in the aquifers. The shallow aquifers plot along the same mixing line as the bay and rivers, but the deeper wells are more colored with respect to DOC. Although there are differences between reservoirs, there is still a positive correlation that could be used for carbon estimates.
Investigating CDOM and DOC concentrations fails to yield information about the type of organic material that is present in these waters. To address this, spectral differences must be observed. One such difference is the position of the Humic Peak C/M in an EEM matrix. In Figure 3.8, the movement of this peak to longer wavelengths (red-shifting) as salinity decreases is apparent. The aquifer EEMS reveal that the humic peak in shallow groundwater is also red shifted. The deep aquifer, however, contains humic peak positions more similar to high salinity environments. Plotting the propagation of the peak as a function of salinity (Figure 3.9) offers an easy way of looking at source specific differences in the peak position. Here it is clear that the surficial aquifer is most similar to the rivers, and that the deeper aquifer is more similar to CDOM found in higher saline environments. The position of peaks is important because it is related to the chemical 92
Figure 3.6. Spatial distributions of salinity, CDOM, and Ra-226 in Tampa Bay.
93
Figure 3.7. Relationship between Dissolved Organic Carbon concentration and CDOM fluorescence intensity. Strong correlations indicate that DOC estimates can be derived from fluorescence values in this region.
94
Figure 3.8. EEMS of CDOM in the Manatee River, Tampa Bay estuary, Gulf of Mexico, surficial aquifer and deep Floridan aquifer. The red dotted lines mark Em=400nm and assist in tracking the propagation of Humic Peak C/M.
95
Figure 3.9. Position of Humic Peak C/M for groundwater, river water and estuary water.
composition of the organic material (Coble, 1996; McKnight et al., 2001; Aiken, 2002, Stedmon and Markager, 2005). Substances with shorter peak positions are believed to be microbially derived, which correspond to material that is less complex, have less amounts of aromatic carbon, less phenolic content, and more nitrogen compared to material that is recently derived from higher plants in the terrestrial environment (Aiken, 2002). A study in 2007 by Mahara et al. using carbon isotopes, showed that the age of organic matter in deep aquifers was approximately 4000 years old and was originally derived from land plants. Due to isolation for extended periods of time, it is possible that this material is then reworked by the microbial community (Aiken, 2002; McKnight et al., 2001). This means that the processes controlling the organic material in the deep aquifer is most similar to those in the marine environment and not to those in the surficial terrestrial 96
environment. PARAFAC (Parallel Factor Analysis) results in a study by Stedmon and Markager (2005) revealed similarities in fluorophores between marine environments and watersheds impacted by agricultural waste. It was deduced that the spectral properties of the material in that study was bacterially derived. Likewise, for the work presented here, similarities between marine and deep aquifer waters suggest similar microbe-derived sources that are unique from the organic sources of the surface terrestrial environment.
In addition to peak position, spectral shape also offers information about the quality of organic material. Emission spectra, at Ex = 300 nm, normalized at Em = 425 nm, allow for comparison of the shape of the peaks. Figure 3.10 reveals similarities between deep
400 nm
430 nm
Figure 3.10. Normalized emission scans at Excitation = 300 nm. Aquifers are represented with dotted lines and surface waters are solid lines.
97
aquifer and marine waters and between river waters and surficial aquifers. Although a visual comparison is informative, it doesn’t allow for a quantitative assessment of differences. For that, calculating a ratio of two wavelengths is necessary and if properly chosen, can be an indicator of peak steepness and shape (Mcknight et al., 2001). Here, 400 and 430 nm were used, and then plotted as a function of salinity (Figure 3.11). Again, the pattern looks similar to that of the peak position scatter plot. But this parameter is possibly more useful because if only two wavelengths are needed, then expensive benchtop EEMS fluorometers wouldn’t be necessary, but the ratio could be calculated from in situ sensors configured to wavelengths of this ratio. This has huge implications for the capability to measure groundwater via monitoring networks.
Figure 3.11. CDOM fluorescence ratio for groundwater, river water and estuary water. Differences in ratios suggest differences in the chemical composition of organic material.
98
Plotting this ratio spatially for Tampa Bay, reveals an interesting finding (Figure 3.12). Regions with red color contours (ratios closest to 1) are found where the Manatee and Little Manatee outflows occur. This is expected based on the spectral shape for surface waters derived from higher terrestrial plants. There are three main regions where blue contours were found, one down near the mouth of the bay and two up bay. This signature down bay is also expected, given the spectral shape, shown in previous figures. What is interesting is the low ratios far up bay. Salinity contours shown earlier prove that this is not high salinity water that has been entrained up bay. The low ratios found in Old
Figure 3.12. Fluorescence ratio as indicator of groundwater. Red contours suggest CDOM derived from surface terrestrial environments. Blue contours represent CDOM with marine or subsurface sources.
99
Tampa Bay to the west are coincident with locations where Submarine Groundwater Detection (SGD) has been previously detected using isotopic methods (Swarzenski et al., 2007). The low ratios found in the eastern portion are located adjacent to the mouth of the Alafia River and appear to have a riverine source. A study by Brooks et al., 1993 found that during periods of low flow in Tampa Bay, the stream flow is composed mainly of groundwater outflow from underlying aquifers. Hence, there is little or no surface water contribution to Tampa Bay at the end of the dry season. This also means that fluorescence ratios may be the tool that is sensitive enough to detect groundwater from deeper aquifers.
100
CONCLUSIONS To the author’s knowledge, there have been no other studies investigating CDOM optical properties in the Florida aquifer system. In this work, it was found that organic material in the shallow aquifers was similar to the rivers supplying Tampa Bay. Concentrations and spectral properties suggest similar sources, which was not unexpected given the strong hydrologic connections between surface and shallow sub surface environments in Florida. Deep aquifers were found to be low in DOC and CDOM concentrations with spectral properties most analogous to higher salinity environments. The source of dissolved organic material in the deep aquifer is believed to be of microbial origin, and tied to the reworking of aged plant material. Strong correlations between DOC and CDOM fluorescence were found for all three aquifers. This indicates that fluorescence can be a reliable site and season-specific proxy of bulk organic carbon in groundwater and aide researchers and monitoring agencies in estimating organic carbon in groundwater reserves.
A novel approach to identifying the presence of groundwater was tested in this study. Fluorescence ratios were shown to hold promise for detection of deep groundwater in surface waters of Tampa Bay. Future investigations on the optical detection of groundwater are necessary and will undoubtedly provide essential information on the extent of discharge to the Tampa Bay Estuary. Seasonality of subsurface discharge via springs may even help to explain seasonal differences in the CDOM optical properties within streams that were observed in Part II of this dissertation.
101
GENERAL CONCLUSIONS
The work presented here examined CDOM characterization and distribution on the WFS, in coastal riversheds, the Tampa Bay Estuary and the Florida Aquifer system. Shelf environments exhibited variability in spatial distribution of CDOM in surface waters. This was attributed to seasonal patterns in river discharge, the occurrence of episodic storms, resuspension events and the presence of hypersaline waters.
CDOM on the WFS is influenced by the rivers that supply the shelf. To better characterize terrestrial sources to the shelf, ten rivers from the Mississippi / Atchafalaya River System to the Shark River in the Everglades were sampled seasonally. Southernmost rivers were found to be highly colored, rich in DOC, and have spectral properties indicative of complex, highly aromatic organic material. These differences between river systems were linked to watershed characteristics. Strong seasonality was also observed and intermittent weather events had a significant effect on the distribution of CDOM optical properties. River results also illustrated the need for improved sampling strategies to better assess the spatial and temporal variability within riversheds.
Lastly, investigated here was a novel approach to groundwater detection using CDOM fluorescence properties. Aquifers were sampled to fingerprint the source water in the Tampa Bay region. Unique optical properties in deep aquifers were observed and indicate similar biogeochemical processes controlling organic matter in deep groundwater and high saline environments. Fluorescence ratios were found to offer promise in detecting the presence of groundwater in the surface waters of Tampa Bay. Current detection methods use the presence of dissolved radium, which is problematic in freshwater environments and is unable to identify if groundwater originated in deep or 102
shallow aquifers. This is not the case with CDOM fluorescence measurements and warrants further investigation. A constant relationship between DOC and CDOM was also discovered in the aquifers, demonstrating that fluorescence intensity could also serve as a proxy for organic carbon in groundwater reserves.
The findings of this dissertation provide insight on the source, fate and cycling of terrestrial CDOM in coastal environments. With the advancement in sensor technology and the development of sophisticated sampling strategies, CDOM measurements can be a powerful tool to researchers and resource managers alike. A simple, non-destructive analysis reflects much information on the source of water, the quality of the water and the watershed through which it was transferred.
103
LITERATURE CITED
Abbott, M.R. and R.M. Letelier (1999) ATBD 22-Chlorophyll Fluorescence (MODIS product 20). NASA Algorithm Theoretical Basis Document. http://modis.gsfc.nasa.gov/data/atbd/atbd_mod22.pdf Aiken, G.R. (2002) Organic matter in ground water. USGS Open File Report 02-89. Artificial Recharge Proceedings, April 2002, Sacramento, CA. Baker, A. (2001) Fluorescence excitation – emission matrix characterization of some sewage impacted rivers. Environ. Sci Technol., 35: 948–53. Baker, A. and J. Lamont-Black (2001) Fluorescence of Dissolved Organic Matter as a natural tracer of groundwater. Ground Water, 39, 745-750. Baker, A. (2002) Spectrophotometric discrimination of river dissolved organic matter. Hydrol. Process.,16: 3203– 13. Baker, A. and R.G.M Spencer (2004) Characterization of dissolved organic matter from source to sea using fluorescence and absorbance spectroscopy. Sci. Tot. Environ., 333: 217-232. Berger, P., R.P.W.M Laane, A.G. Ilahude, M. Ewald and P. Courtot (1984). Comparative study of dissolved fluorescent matter in four west-european estuaries. Oceanol. Acta 7: 309-313. Blough, N.V., O.C. Zafiriou and J. Bonilla (1993) Optical absorption spectra of waters from the Orinoco River outflow: Terrestrial input of colored organic matter to the Caribbean. J. Geophys. Res., 98: 2271-2278. Boehme, J.R. (2000) Artificial and natural fluorescence of dissolved organic matter in the Tampa Bay estuary. Ph.D. Dissertation, University of South Florida. Boss, E., W.S Pegau, J.R.V. Zanaveld, A.H Barnard (2001) The spectral particulate attenuation and particle size distribution in the bottom boundary layer of a continental shelf. Geophys. Res. Oceans, 106: 9509-9516.
104
Boss E., W. S. Pegau, M. Lee, M. S. Twardowski, E. Shybanov, G. Korotaev, and F. Baratange. 2004. The particulate backscattering ratio at LEO 15 and its use to study particles composition and distribution. J. Geophys. Res., 109: C01014. Bricaud A., A. Morel, and L. Prieur (1981) Absorption by dissolved organic matter of the sea (Yellow Substance) in the UV and visible domains. Limnol. Oceanogr., 26: 43-53. Brooks, G.R., T.L. Dix and L.J. Doyle (1993) Groundwater / Surfacewater Interactions in Tampa Bay: Implications for nutrient fluxes. Center for Near Shore Marine Science of the University of South Florida, 43pp. Brooks G.R. and L.J Doyle (1998) Recent sedimentary development of Tampa Bay, Florida: A microtidal estuary incised into tertiary platform carbonates. Estuaries, 21: 391-406. Burnett, W.C., G. Kim, and D. Lane-Smith (2001) A continuous radon monitor for use in coastal ocean waters. J. Radioanal. Nucl. Chem., 249: 167-172. Burnett, W.C., J. Chanton, J. Christoff, E. Kontar, S. Krupa, M. Lambert, W. Moore, D. O’Rourke, R. Paulsen, C. Smith, L. Smith, and M. Taniguchi (2002) Assessing methodologies for measuring groundwater discharge to the ocean. EOS, 83: 117123. Cabaniss, S.E., Shuman, M.S., 1987. Synchronous fluorescence spectra of natural waters: tracing sources of dissolved organic matter. Mar. Chem., 21: 37-50. Cannizzaro, J.P., K.L. Carder, F.R.Chen, C.A. Heil and G.A.Vargo (2008) A novel technique for detection of the toxic dinoflagellate, Karenia brevis, in the Gulf of Mexico from remotely sensed ocean color data. Contin. Shelf Res., 28, 137-158. Carder K.L., R.G. Steward, G.R. Harvey, and P.B. Ortner (1989) Marine Humic and fulvic acids: Their effects on remote sensing of ocean chlorophyll. Limnol. Oceanogr., 34: 68-81. Carlson, D.J., Mayer, L.M., 1983. Relative influences of riverine and macroalgal material on UV absorbance in temperate coastal waters. Can. J. Fish. Aq. Sci., 40: 1258-1263. Casper, A., B. Dixon, E. Steimle, M. Hall, R.N. Conmy (2008) Spatial patchiness of river water quality is revealed through integration of high resolution data, unmanned surface vehicles and geospatial techniques. Environ. Sci. & Technol (submitted).
105
Cauwet, G., Gadel, F., De Souza Sierra, M.M., Donard, O., Ewald, M., 1990. Contribution of Rhone River of organic carbon inputs to the northwestern Mediterranean Sea. Contin. Shelf Res., 10: 1025-1037. Chen, R.F., 1992. The fluorescence of dissolved organic matter in the marine environment. Ph.D. Dissertation, University of California, San Diego, 149 pp. Chen, R.F. and G.B. Gardner (2004) High-Resolution measurements of CDOM in the Mississippi and Atchafalaya River plume regions. Mar. Chem., 89: 103-125. Chen, R.F., P. Bissett, P.G. Coble, R.N. Conmy, G.B. Gardner, M.A. Moran, X. Wang, M.L. Wells, P. Whelan and R.G. Zepp (2004) CDOM source characterization in the Louisiana Bight. Mar. Chem., 89: 257-272. Coble, P.G., Green, S.,. Blough,, N.V., Gagosian, R.B., 1990. Characterization of dissolved organic matter in the Black Sea by fluorescence spectroscopy. Nature, 348: 432-435. Coble P.G., K. Mopper and C.S. Schultz (1993) Fluorescence contouring analysis of DOC Intercalibration Experiment samples: A comparison of techniques. Mar. Chem., 41: 173-178. Coble, P.G. (1996) Characterization of marine and terrestrial DOM in seawater using excitation-emission matrix spectroscopy. Mar. Chem., 51: 325-346. Coble, P.G., C. Hu, R.W. Gould Jr., G. Chang, and A.M. Wood (2004) CDOM in the coastal ocean: An optical tool for coastal zone environmental assessment and management. Oceanogr., 17: 50-59. Coble, P.G. (2007) Marine optical biogeochemistry: the chemistry of ocean color. Chem. Rev., 107: 402-418. Conmy(a), R.N., P.G. Coble and C.E. Del Castillo (2004) Calibration and performance of theWetLabs’ SAFIre in situ fluorometer using seawater. Contin. Shelf Res., 24: 431-442. Conmy(b), R.N., P.G. Coble, R.F. Chen and G. Bernard Gardner (2004) Optical properties of Colored Dissolved Organic Matter in the northern Gulf of Mexico. Mar. Chem., 89: 27-144. De Souza Sierra, M.M., O.F.X. Donard and M. Lamotte (1997) Spectral identification and behavior of dissolved organic fluorescent materials during estuarine mixing processes. Mar. Chem., 58: 51–58.
106
DeHaven, E.C., G.W. Jones, L.F. Clark, J.T. Rauch, J.T. Mulroney and C.G. Ramirez (1991) Groundwater quality of the Southwest Florida water management district: Central region section 2: Ambient groundwater quality monitoring program and Florida department of environmental regulation, 335pp. Del Castillo, C.E. (1998) Optical characteristics of the CDOM in the Eastern Caribbean, West Florida Shelf and the Arabian Sea: Relationship between chemical characteristics and optical response. Ph.D. Dissertation, University of South Florida. Del Castillo CE, P.G. Coble, J.M. Morell, J.M. Lopez and J.E. Corredor (1999) Analysis of the optical properties of the Orinoco River plume by absorption and fluorescence spectroscopy. Mar. Chem., 66: 35– 51. Del Castillo, C.E., F. Gilbes, P.G. Coble, F.E. Muller-Karger (2000) On the dispersal of riverine colored dissolved organic matter over the West Florida Shelf. Limnol. Oceanogr. 45: 1425–1432. Del Castillo, C.E., P.G. Coble, R.N. Conmy, F.E. Muller-Karger, L. Vanderbloemen and G.A. Vargo (2001) Multispectral in situ measurements of organic matter and chlorophyll fluorescence in seawater: Documenting the intrusion of the Mississippi River plume in the West Florida Shelf. Limnol. Oceanogr., 46: 18361843. Del Castillo, C.E. (2005) Remote sensing of organic matter in coastal waters. In: Remote Sensing of Coastal Aquatic Environments. Eds: R.L. Miller, C.E. Del Castillo and B.A. McKee. Springer Publishing. pp.157-180. Donard, O.X.F., Lamotte, M., Belin, C., Ewald, M., 1989. High sensitivity fluorescence spectroscopy of Mediterranean waters using a conventional or a pulsed laser excitation source. Mar. Chem, 27: 117-136. Dulaiova, H. and W.C. Burnett (2004) An efficient method for gamma spectrometric determination of radium-226,228 via manganese fibers. Limnol. Oceanogr. Methods, 2: 256-261. Duursma, E.K. (1974). The fluorescence of dissolved organic matter in the sea. In: Optical Aspects of Oceanography. Jerlov, Steeman and Nielsen (Eds) Academic Press, London, p. 237–256. Ferrari, G.M., M.D. Dowell, S. Grossi, and C. Targa (1996) Relationship between the optical properties of chromophoricdissolved organic matter and total concentration ofdissolved organic carbon in the southern Baltic Sea. Est., Coastal Shelf Sci., 47: 91–105.
107
Freeman C, C.D. Evans, D.T. Monteith, B. Reynolds and N. Fenner (2001) Export of organic carbon from peat soils. Nature, 412: 785. Giffin, C., A. Kaufman, and W. S. Broecker (1963), J. Geophys. Res., 68: 1749-1757.
Green, S.A. (1992) Applications of fluorescence spectroscopy to environmental chemistry. Ph.D. Dissertation., Woods Hole Oceanographic Institution. Green S.A. and N.V. Blough (1994) Optical absorption and fluorescence properties of chromophoric dissolved organic matter in natural waters. Limnol. Oceanogr., 39: 1903-1916. Hansell, D.A. (2002) DOC in the global ocean carbon cycle. In Biogeochemistry of Marine Dissolved Organic Matter, eds. D.A. Hansell and C.A. Carlson, Academic Press, San Diego. pp. 685-715. Hayase, K., M. Yamamoto, I. Nakazawa and H. Tsubota (1987) Behavior of natural fluorescence in Samagi Bay and Tokyo Bay, Japan - vertical and lateral distributions. Mar. Chem., 20: 265-276. Hedges, J.I. (1992) Global biochemical cycles: progress and problems. Mar. Chem., 39: 69–93. Hilf, E.R. and W. Tuszynski (1990). Mass Spectrometry of large non-volatile molecules for marine organic chemistry. World scientific publishing co.,231 pp. Hu, C., F.E. Muller-Karger, D.C. Biggs, K.L. Carder, B. Nababan, D. Nadeau and L. Vanderbloemen (2003). Comparison of ship and satellite bio-optical measurements on the continental margin of the NE Gulf of Mexico. Internat. J. of Rem. Sens. 24: 2597–2612. Hu, C., F. E. Müller-Karger and P. W. Swarzenski (2006). Hurricanes, submarine groundwater discharge, and Florida’s red tides. Geophys. Res. Lett., 33, doi:10.1029/2005GL025449. Hutchinson, C.B. (1983) Assessment of the interconnection between Tampa Bay and Florida Aquifer, Florida: US Geological Survey Water-Resources Investigations 82-54, 50p. Kalle, K. (1966). The problem of the Gelbstoff in the sea. Oceanogr. Mar. Biol. Ann. Rev., 4: 91-104.
108
Katz, B.G. (2002) Demystifying groundwater flow and contaminant movement in karst systems using chemical and isotopic tracers. Water-Resources Investigations USGS Report 02-4174, 10pp. Kieber R.J., X. Zhou and K. Mopper, K. (1990). Formation of carbonyl compounds from the UV-induced photodegradation of humic substances in natural waters: Fate of riverine carbon in the sea. Limnol. Oceanogr., 35: 1503-1515. Kirk, J. T. O. (1994) Light and Photosynthesis in Aquatic Ecosystems, 2nd ed. Cambridge, 509 pp. Kelly, R.P. and S.B. Moran (2002) Seasonal changes in groundwater input to a wellmixed estuary estimated using radium isotopes and implications for coastal nutrient budgets. Limnol. Oceanogr., 47: 1796-1807. Khan, M., G. Mostofa, T. Yoshioka, E. Konohira, and E. Tanoue (2007) Dynamics and Characteristics of Fluorescent Dissolved Organic Matter in the groundwater, river and lake water. Water Air Soil Pollut., 184: 157-176. Kroeger, K.D., P.W. Swarzenski, J. Crusius, J.F. Bratton and M.A. Charette (2007)\ Submarine Ground-Water Discharge: Nutrient Loading and Nitrogen Transformations: Fact sheet 2006--3110 4 p. Kowalczuk, P., W.J. Cooper, R.F. Whitehead, M.J. Durako and W. Sheldon (2003) Characterization of CDOM in an organic-rich river and surrounding coastal ocean in the South Atlantic Bight. Aquat. Sci.- Res. Across Bound., 65: 384-401. Krest, J.M., W.S. Moore and J. Rama (1999) Ra-226 and Ra-228 in the mixing zones of the Mississippi and Atchafalaya Rivers: indicators of groundwater input. Mar. Chem. 64: 129–152. Laane, R.W.P.M. (1981) Composition and distribution of dissolved fluorescent substances in the Ems-Dollart Estuary. Netherland J. Sea Res. 15: 88-99. Mahara, Y., T. Kubota, R. Wakayama, T. Nakano-Ohta and T. Nakamura (2007) Effects of molecular weight of natural organic matter on cadmium mobility in soil environments and its carbon isotope characteristics. Sci. of Tot. Environ., 387: 220-227. McKnight, D.M., E.W. Boyer, P. Doran, P.K. Westerhoff, T. Kulbe and D.T. Andersen (2001) Spectrofluorometric characterization of dissolved organic matter for indication of precursor organic material and aromaticity.: Limnol. and Oceanogr., 46: 38-48.
109
McKnight DM, E. Hood and L. Klapper (2003) Trace organic moieties of dissolved organic material in natural waters. In: Aquatic Ecosystems:Iinteractivity of Dissolved Organic Matter. Eds. Findlay and Sinsaburgh, Academic Press. 71– 93pp. Meyer, F.W. (1989) Hydrogeology, groundwater movement and subsurface storage in the Floridan Aquifer system in southern Florida: USGS, Professional Paper 1403G, 59pp. Miller, J.A., (1986) Hydrogeologic framework of the Floridan aquifer system in Florida and in parts of Georgia, Alabama, and South Carolina: U.S. Geological Survey, Professional Paper 1403-B, 91pp. Miller, W.L., Moran, M.A., 1997. Interaction of photochemical and microbial processes in the degradation of refractory dissolved organic matter from a coastal marine environment. Limnol. Oceanogr., 42: 1317-1324. Miller W.L., Zepp, R.G., 1995. Photochemical production of dissolved inorganic carbon from terrestrial organic matter: Significance to the oceanic carbon cycle. Geophys. Res. Let., 22: 417-420. Mopper K., Zhou, X., Kieber, R.J., Kieber, D.J., Sikorski, R.J., Jones, R.D., 1991. Photochemical degradation of dissolved organic carbon and it’s impact on the oceanic carbon cycle. Nature, 353: 60-62. Moore, W.S. (1976) Sampling radium-228 in the deep ocean. Deep-Sea Res. Oceanogr. Abstract 23, 647-651. Moore, W.S. and R. Arnold (1996) Measurement of radium-223,224 in coastal wates using delayed coincidence counter. J. Geophys. Res., 101: 1321-1329. Moore, W.S. (1999) The subterranean estuary: A reaction zone of groundwater and sea water. Mar. Chem., 65: 111-126. Moore, W.S., J. Krest, G. Taylor, E. Roggenstein, S. Joyce and R. Lee (2002) Thermal evidence of water exchange through a coastal aquifer: Implications for nutrient fluxes. Geophys. Res. Let., 29: 10.1029/2002GL014923. Moore, W.S. (2003) Sources and fluxes of submarine groundwater discharge delineated by radium isotopes. Biogeochem., 66: 75-93. Muller-Karger, F.E., C.R. McClain, T.R. Fisher, W.E. Esaias and R. Varela (1989) Pigment distribution in the Caribbean Sea: observations from space. Progress. Oceanogr. 23: 23–64.
110
Nelson, N.B., D.A. Siegel, C.A. Carlson, C. Swan, W.M. Smethie Jr. and S. Khatiwala. (2007) Hydrography of chromophoric dissolved organic matter in the North Atlantic. Deep Sea Res. Part I: Oceanogr. Res. Papers., 64: 710-731. Stedmon C A, and S. Markager (2005) Resolving the variability in dissolved organic matter fluorescence in a temperate estuary and its catchment using PARAFAC analysis. Limnol. Oceanogr, 50: 686–697. Stedmon C A, S. Markager, and R. Bro (2003) Tracing dissolved organic matter in aquatic environments using a new approach to fluorescence spectroscopy. Mar. Chem., 82: 239–254. Stovall-Leonard, A. (2003) Characterization of CDOM for the study of carbon cycling in aquatic systems. Master’s thesis, University of South Florida. Swarzenski, P.W., J. Martin, and R. Bowker (2001) Groundwater-surface-water exchange in Tampa Bay; results from a preliminary geochemical and geophysical survey [abstract]: Geological Society of America Abstracts with Programs, v. 33, no. 6, p. A-43. Swarzenski, P.W., C. Reich, K.D. Kroeger, M. Baskaran (2007) Ra and Rn isotopes as natural tracers of submarine groundwater discharge in Tampa Bay, FL. Mar. Chem. 104: 69-84. Tihansky, A.B., 1999, Sinkholes, west-central Florida-A link between surface water and ground water, In: Land Subsidence in the United States, Galloway, Devin, Jones, and Ingebritsen (eds) U.S. Geological Survey, Circular 1182, p. 121-141. Torres, AE., L.A. Sacks, D.K. Yobbi and L.A. Knochenmus (2001) Hydrogeologic framework and geochemistry of the intermediate aquifer system in parts of Charlotte, De Soto, and Sarasota Counties, FL: USGS-Water Resources Investigations Report 01-4015, 74pp. Traganza, E.D., 1969. Fluorescence excitation and emission spectra of dissolved organic matter in seawater. Bull. Mar. Sci., 19: 897-904. Valentine, R.L., Zepp, R.G.,1993. Formation of carbon monoxide from the photodegradation of terrestrial dissolved organic carbon in natural waters. Environ. Sci. Technol., 27: 409-412. Velapoldi R.A. and K.D. Mielenz (1980) Standard Reference Material 936: Quinine Sulfate Dihydrate. NBS Certification Report, Washington, D.C. Vodacek, A. (1992) An explanation of he spectral variation in freshwater CDOM fluorescence. Limnol. Oceanogr., 37: 1808-1813. 111
Vodacek, A., M.D. DeGrandpre, E.T. Peltzer, R.K. Nelson, and N.V. Blough. (1997) Seasonal variation of CDOM and DOC in the Middle Atlantic Bight: Terrestrial inputs and photooxidation. Limnol. Oceanogr. 42:674-686. Weisberg, R.H., R. He, Y. Liu and J.I. Virmani (2005) West Florida Shelf circulation on synoptic, seasonal, and interannual time scales. In: Cirulation in the Gulf of Mexico – Observation and Models. W. Sturges and A. Lugo-Fernandez (Eds.) Library of Congress, 347 pp. Williams, P.M., Druffel, E.M., 1988. Dissolved organic matter in the ocean: Comments on a controversy. Oceanogr., 1: 14-17. Wolansky, R, M., M.A. Corral, Jr. (1985) Aquifer Tests in West-Central, Florida, 195276. Water Resources Investigations Report 84-4044, USGS, Tallahassee, FL. Xian, G. and M. Crane (2005) Assessments of urban growth in the Tampa Bay watershed using remote sensing data. Rem. Sens. of Environ., 97: 203-215. Yentsch, C.S., Reichert, C.A., 1961. The interrelationship between water-soluble yellow substances and chloroplastic pigments in the marine algae. Botanica. Marina, 3: 65-74. Zepp R.G. and P.F. Schlotzhauer (1981) Comparison of photochemical behavior of various humic substances in water: III. Spectroscopic properties of humic substances. Chemosphere, 10: 479-486.
112
Appendix I. Seasonal CDOM fluorescence measurements for river samples.
River Alafia Alafia Alafia Alafia Alafia Alafia Alafia Alafia Alafia Alafia Alafia Apalachicola Apalachicola Apalachicola Apalachicola Apalachicola Apalachicola Apalachicola Apalachicola Apalachicola Apalachicola Apalachicola Apalachicola Atchafalaya Caloosahatchee Caloosahatchee Caloosahatchee Caloosahatchee Caloosahatchee Caloosahatchee
Salinity 0 3.3 0.21 0.32 8.44 1.2 6.5 21.4 0 2 22 0 30.3 0.52 22.13 18.69 0 17.5 6.9 0 0.1 6.7 20.4 0 0.1 1.2 6.3 0.21 0.88 1.22
Season Summer 2004 Summer 2004 Summer 2005 Summer 2005 Summer 2005 Winter 2004 Winter 2004 Winter 2004 Winter 2005 Winter 2005 Winter 2005 Summer 2004 Summer 2004 Summer 2005 Summer 2005 Summer 2005 Winter 2004 Winter 2004 Winter 2004 Winter 2005 Winter 2005 Winter 2005 Winter 2005 Winter 2004 Summer 2004 Summer 2004 Summer 2004 Summer 2005 Summer 2005 Summer 2005
Ex Humic Peak A (nm) 240 240 235 235 235 235 235 235 235 235 235 235 240 230 235 235 235 235 235 235 235 235 235 235 235 235 240 235 235 235
Fluor. Intensity Em Humic Humic Peak A Ex Humic Peak A (nm) (QSE) Peak C (nm) 445.79 440.94 441.17 443.06 437.79 435.45 434.01 426.81 430.65 432.54 426.92 438.57 435.40 429.38 438.56 436.98 437.61 436.17 432.68 430.81 430.81 435.32 434.03 432.76 433.16 433.56 433.16 433.81 435.08 434.68
420.36 324.81 241.00 285.00 149.66 105.77 94.74 62.88 152.51 154.14 65.39 122.82 41.62 88.19 50.87 65.81 104.38 54.84 17.10 105.18 114.22 65.78 48.42 103.48 414.77 363.84 312.15 266.07 254.96 250.25
113
320 320 320 320 315 320 320 320 305 300 300 320 320 315 310 305 320 315 315 300 300 300 300 315 315 305 305 310 310 310
Fluor. Fluor. ratio Intensity Ex/Em = Ex/Em = Em 430:400 Em Humic Humic Peak C 300/400 300/430 nm @ Ex Peak C (nm) (QSE) nm (QSE) nm (QSE) 300 nm 442.18 439.09 439.93 438.04 432.66 431.85 433.29 426.09 423.68 427.48 421.10 434.96 433.56 430.01 430.80 430.65 435.03 431.13 428.97 425.00 428.87 427.58 420.49 428.01 427.74 424.38 424.18 428.75 430.01 427.57
221.42 175.45 137.55 161.44 85.26 55.00 47.96 31.25 74.69 76.21 30.96 65.68 19.88 44.93 26.82 34.59 53.76 28.78 10.74 52.07 50.56 32.43 24.36 54.17 214.84 187.43 163.02 151.80 145.67 139.37
210.62 170.45 128.58 150.76 80.14 55.12 48.61 32.33 74.96 76.10 30.44 63.02 21.00 43.79 26.44 34.26 54.23 28.58 10.77 50.10 52.07 32.48 23.78 52.33 216.32 188.70 160.69 146.53 140.41 135.07
168.71 142.82 108.83 127.65 67.50 48.27 43.39 31.54 68.74 69.22 29.58 55.91 19.32 39.20 23.13 30.14 47.14 25.33 10.07 45.24 47.49 29.56 22.54 47.91 193.73 170.18 151.40 129.07 124.16 119.54
1.248 1.193 1.182 1.181 1.187 1.142 1.120 1.025 1.091 1.099 1.029 1.127 1.087 1.117 1.143 1.137 1.150 1.128 1.070 1.107 1.096 1.099 1.055 1.092 1.117 1.109 1.061 1.135 1.131 1.130
Appendix I. (cont.)
River Caloosahatchee Caloosahatchee Caloosahatchee Caloosahatchee Caloosahatchee Caloosahatchee Caloosahatchee Hillsborough Hillsborough Hillsborough Hillsborough Hillsborough Hillsborough Hillsborough Hillsborough Hillsborough Hillsborough Hillsborough Hillsborough Manatee Manatee Manatee Manatee Manatee Manatee
Salinity 0 1.1 6.9 11.3 0 14.1 14.5 0 0 2.98 9.15 23.44 0 4.4 10.1 16 0 6 16 0 0.6 4.8 20.91 24.99 27.35
Season Winter 2004 Winter 2004 Winter 2004 Winter 2004 Winter 2005 Winter 2005 Winter 2005 Summer 2004 Summer 2004 Summer 2005 Summer 2005 Summer 2005 Winter 2004 Winter 2004 Winter 2004 Winter 2004 Winter 2005 Winter 2005 Winter 2005 Summer 2004 Summer 2004 Summer 2004 Summer 2005 Summer 2005 Summer 2005
Manatee
0
Manatee Manatee
Fluor. Intensity Fluor. Intensity Ex/Em = Ex Humic Em Humic Humic Peak A Ex Humic Em Humic Humic Peak C 300/400 nm Peak A (nm) Peak A (nm) (QSE) Peak C (nm) Peak C (nm) (QSE) (QSE)
Fluor. ratio Ex/Em = Em 430:400 300/430 nm nm @ Ex (QSE) 300 nm
235 235 235 235 235 235 235 235 235 235 235 235 235 235 235 235 235 235 235 240 235 235 235 235 235
434.01 431.85 432.57 433.29 434.03 432.10 430.16 442.18 445.79 440.55 438.04 431.35 428.97 435.45 435.45 429.97 437.90 434.03 430.23 454.81 447.59 443.89 433.29 434.55 427.53
358.32 297.35 243.91 196.10 364.07 304.57 222.63 460.18 451.76 195.07 103.17 64.92 380.66 138.07 117.13 89.36 230.72 106.71 84.54 420.35 427.26 399.89 101.45 90.08 65.70
315 315 315 315 300 300 300 320 320 315 315 305 300 305 305 305 300 300 300 320 320 320 305 305 305
430.41 425.37 428.25 427.53 426.29 428.87 424.36 443.98 442.18 432.41 429.90 423.71 417.45 425.37 426.81 424.21 425.65 425.65 425.62 451.20 443.98 445.79 426.90 427.53 424.97
176.52 148.98 120.87 95.26 175.55 147.02 108.73 232.90 224.91 106.37 65.96 33.43 232.49 72.22 59.69 46.62 115.69 52.78 41.48 227.13 222.58 204.73 53.62 47.59 35.34
177.05 149.11 121.99 96.88 174.21 145.24 107.51 227.55 224.25 101.71 62.11 32.41 223.28 71.70 58.96 46.18 114.79 52.37 40.84 215.74 217.55 202.41 52.87 47.09 34.40
152.48 134.23 110.12 86.32 157.11 130.91 99.79 189.03 187.55 89.32 54.63 30.98 215.97 64.54 53.28 42.45 103.29 48.25 38.63 166.59 175.77 163.15 48.72 43.40 32.73
1.161 1.111 1.108 1.122 1.109 1.109 1.077 1.204 1.196 1.139 1.137 1.046 1.034 1.111 1.107 1.088 1.111 1.085 1.057 1.295 1.238 1.241 1.085 1.085 1.051
Winter 2004
235
443.37
158.70
320
437.03
84.49
81.66
70.19
1.163
20.3
Winter 2004
235
431.85
117.44
305
426.09
59.57
59.83
54.74
1.093
26.2
Winter 2004
240
430.41
63.46
305
423.93
32.02
32.33
30.07
1.075
114
Appendix I. (cont.)
River
Salinity
Season
Manatee Manatee Manatee Manatee Mississippi Peace Peace Peace Peace Peace Peace Peace Peace Peace Peace Peace Peace Shark Shark Shark Shark Shark Shark Shark Shark Shark Shark Shark Shark
0.12 17.73 20.74 25.08 0 0 1.4 14 0.12 0.14 8.67 0 9.7 16.8 0 2.9 14.7 0.9 8.2 16.6 27.1 0.5 2.67 12.53 23.59 9.01 16.58 22.79 30.79
Winter 2005 Winter 2005 Winter 2005 Winter 2005 Winter 2004 Summer 2004 Summer 2004 Summer 2004 Summer 2005 Summer 2005 Summer 2005 Winter 2004 Winter 2004 Winter 2004 Winter 2005 Winter 2005 Winter 2005 Summer 2004 Summer 2004 Summer 2004 Summer 2004 Summer 2005 Summer 2005 Summer 2005 Summer 2005 Winter 2005 Winter 2005 Winter 2005 Winter 2005
Fluor. Fluor. Intensity Intensity Ex/Em = Ex Humic Em Humic Humic Peak A Ex Humic Em Humic Humic Peak C 300/400 nm Peak A (nm) Peak A (nm) (QSE) Peak C (nm) Peak C (nm) (QSE) (QSE) 235 235 235 235 235 235 235 240 235 235 235 235 235 235 235 235 235 240 240 235 240 230 235 230 235 235 235 235 235
441.77 430.16 436.82 429.52 431.85 448.32 440.94 437.25 445.84 442.67 438.56 435.45 436.89 432.57 442.41 438.80 437.25 431.35 434.08 434.08 436.35 428.86 435.71 436.34 429.46 433.39 437.27 443.09 432.74
210.91 141.85 123.19 85.33 48.42 478.10 378.54 140.16 322.34 312.56 221.58 273.21 224.01 162.94 415.83 409.53 249.47 269.51 255.37 202.27 96.59 238.33 202.98 175.62 101.70 339.05 289.66 220.83 110.68
115
300 300 300 300 315 320 320 315 310 310 310 315 310 305 300 300 300 315 310 310 305 310 315 310 310 300 300 300 300
432.10 425.65 426.28 419.20 422.13 444.63 435.40 429.87 437.61 437.61 434.04 431.85 428.25 426.81 437.90 431.55 429.52 427.74 428.67 428.67 427.12 425.62 431.00 430.65 426.90 425.62 426.92 430.15 425.62
103.06 70.58 59.75 40.91 24.71 263.84 201.69 69.55 184.62 183.37 129.42 141.93 113.80 82.90 193.28 200.38 120.47 133.44 128.60 104.58 51.43 114.36 106.93 89.40 52.97 169.52 145.83 109.61 54.71
102.99 69.01 59.60 40.90 24.21 247.59 195.12 70.57 175.41 175.76 125.90 140.54 113.09 82.59 191.67 199.84 119.85 136.48 127.65 104.03 50.86 109.97 106.17 86.93 51.75 166.64 144.83 108.09 53.54
Fluor. ratio Ex/Em = Em 430:400 300/430 nm nm @ Ex (QSE) 300 nm 90.80 64.66 55.03 38.71 23.08 198.68 166.58 63.93 141.97 145.08 106.14 121.58 100.47 74.90 164.16 171.76 105.56 126.39 116.87 93.72 46.73 99.06 93.63 78.95 47.33 152.32 132.21 97.74 49.72
1.134 1.067 1.083 1.057 1.049 1.246 1.171 1.104 1.236 1.211 1.186 1.156 1.126 1.103 1.168 1.163 1.135 1.080 1.092 1.110 1.089 1.110 1.134 1.101 1.093 1.094 1.095 1.106 1.077
Appendix I. (cont.)
River
Salinity
Season
Suwannee Suwannee Suwannee Suwannee Suwannee Suwannee Suwannee Suwannee Suwannee Suwannee Suwannee Suwannee
0 22.4 20.2 0.13 24.7 22.78 0 13.2 18.3 0 20.1 25.6
Summer 2004 Summer 2004 Summer 2004 Summer 2005 Summer 2005 Summer 2005 Winter 2004 Winter 2004 Winter 2004 Winter 2005 Winter 2005 Winter 2005
Fluor. Fluor. Intensity Intensity Ex Humic Em Humic Humic Peak A Ex Humic Em Humic Humic Peak C Peak A (nm) Peak A (nm) (QSE) Peak C (nm) Peak C (nm) (QSE) 235 235 240 230 235 235 235 235 235 230 235 235
450.28 441.30 443.73 443.06 435.85 432.41 443.37 442.65 441.21 437.92 434.44 432.74
717.81 240.36 252.95 233.16 77.21 91.27 314.49 184.90 129.76 273.06 144.09 109.11
320 315 315 325 305 310 320 320 320 300 300 300
116
450.28 435.88 436.35 447.42 428.79 422.42 442.65 439.05 438.33 439.21 431.28 430.80
391.01 122.23 126.98 113.31 38.12 47.34 174.86 98.07 65.92 122.18 69.40 52.47
Ex/Em = 300/400 nm (QSE)
Ex/Em = 300/430 nm (QSE)
Fluor. ratio Em 430:400 nm @ Ex 300 nm
354.87 122.39 129.37 102.91 37.62 46.04 161.46 94.76 65.53 121.18 68.40 51.89
280.07 103.25 108.33 83.67 33.67 42.74 129.30 79.18 55.95 99.82 59.94 47.74
1.267 1.185 1.194 1.230 1.117 1.077 1.249 1.197 1.171 1.214 1.141 1.087
Appendix II. Seasonal absorption and DOC measurements for river samples. Missing data due to sample storage issues. River
Salinity
Season
Alafia Alafia Alafia Alafia Alafia Alafia Alafia Alafia Alafia Alafia Alafia Apalachicola Apalachicola Apalachicola Apalachicola Apalachicola Apalachicola Apalachicola Apalachicola Apalachicola Apalachicola Apalachicola Apalachicola Atchafalaya Caloosahatchee Caloosahatchee Caloosahatchee Caloosahatchee Caloosahatchee Caloosahatchee
0 3.3 0.21 0.32 8.44 1.2 6.5 21.4 0 2 22 0 30.3 0.52 22.13 18.69 0 17.5 6.9 0 0.1 6.7 20.4 0 0.1 1.2 6.3 0.21 0.88 1.22
Summer 2004 Summer 2004 Summer 2005 Summer 2005 Summer 2005 Winter 2004 Winter 2004 Winter 2004 Winter 2005 Winter 2005 Winter 2005 Summer 2004 Summer 2004 Summer 2005 Summer 2005 Summer 2005 Winter 2004 Winter 2004 Winter 2004 Winter 2005 Winter 2005 Winter 2005 Winter 2005 Winter 2004 Summer 2004 Summer 2004 Summer 2004 Summer 2005 Summer 2005 Summer 2005
Spectral Slope Spectral Slope -1 -1 350-440nm (m ) 280-312nm (m ) 0.01526 0.01427 0.01652 0.01584 0.01362 0.02395 0.02040 0.01956 0.02176 0.01577 0.02259 0.01521 0.01716 0.01668 0.01816 0.01779 0.01456 0.01703 0.01828 0.01538 0.01599 0.01403 0.01850 0.01553 0.01956 0.01953 0.01857 0.01585 0.01637 0.01854
0.01247 0.01317 0.01454 0.01456 0.01433 0.01819 0.01771 0.01911 0.01790 0.01663 0.02179 0.01408 0.01696 0.01336 0.01639 0.01502 0.01344 0.01564 0.01656 0.01411 0.01369 0.01559 0.01813 0.01645 0.01672 0.01716 0.01783 0.01546 0.01547 0.01612
a(312) (m )
a(350) (m )
a(440) (m )
Fluor. 300/430 nm / a312 (QSE*m)
11.32 7.82 50.09 56.65 41.79 17.50 16.54 10.94 21.25 24.93 8.83 2.98 0.98 23.85 12.81 16.09 25.77 14.88 13.46 20.05 20.78 11.59 9.02 29.92 5.91 5.06 4.64 71.17 68.55 63.44
6.50 4.40 28.63 32.14 23.47 8.50 8.06 5.50 11.01 13.35 4.06 1.75 0.52 13.89 6.76 8.69 15.95 8.03 7.21 11.39 12.37 6.18 4.58 17.27 2.99 2.47 2.35 39.69 37.58 33.97
1.96 1.31 6.47 7.54 6.98 1.15 1.73 1.04 2.13 3.75 0.71 0.44 0.12 3.72 1.60 2.23 4.76 1.89 1.56 2.95 2.83 1.74 0.96 4.57 0.61 0.47 0.44 11.01 10.17 8.01
107.67 129.92 19.89 19.99 11.48 48.02 28.04 31.08 35.16 20.30 42.74 144.62 171.08 11.76 16.50 15.39 11.40 15.10 6.92 16.97 18.37 18.64 24.88 11.46 355.18 402.75 368.79 13.31 13.81 16.86
-1
117
-1
-1
DOC µM 1121.34 995.20 1060.77 845.90 556.81 513.26 409.87 555.51 445.50 272.49 266.23 377.38 325.78 365.16 488.73 393.11 478.41 341.10 220.13 252.46 552.44 982.46 669.84 643.66 1319.43 1284.43 1258.68
Appendix II. (cont.)
River
Salinity
Season
Caloosahatchee Caloosahatchee Caloosahatchee Caloosahatchee Caloosahatchee Caloosahatchee Caloosahatchee Hillsborough Hillsborough Hillsborough Hillsborough Hillsborough Hillsborough Hillsborough Hillsborough Hillsborough Hillsborough Hillsborough Hillsborough Manatee Manatee Manatee Manatee Manatee Manatee Manatee Manatee Manatee
0 1.1 6.9 11.3 0 14.1 14.5 0 0 2.98 9.15 23.44 0 4.4 10.1 16 0 6 16 0 0.6 4.8 20.91 24.99 27.35 0 20.3 26.2
Winter 2004 Winter 2004 Winter 2004 Winter 2004 Winter 2005 Winter 2005 Winter 2005 Summer 2004 Summer 2004 Summer 2005 Summer 2005 Summer 2005 Winter 2004 Winter 2004 Winter 2004 Winter 2004 Winter 2005 Winter 2005 Winter 2005 Summer 2004 Summer 2004 Summer 2004 Summer 2005 Summer 2005 Summer 2005 Winter 2004 Winter 2004 Winter 2004
Spectral Slope Spectral Slope -1 -1 350-440nm (m ) 280-312nm (m ) 0.01858 0.01868 0.01812 0.01863 0.01382 0.01293 0.01364 0.01540 0.01401 0.01381 0.01688 0.01968 0.01675 0.02135 0.01827 0.01836 0.01975 0.01771 0.01939 0.01579 0.01402 0.01559 0.01701 0.01761 0.01385 0.01824 0.02097 0.02284
0.01697 0.01681 0.01712 0.01776 0.01650 0.01656 0.01736 0.01508 0.01362 0.01401 0.01611 0.01678 0.01524 0.01698 0.01624 0.01764 0.01737 0.01731 0.01901 0.01225 0.01217 0.01333 0.01738 0.01773 0.01733 0.01445 0.01816 0.01987
a(312) (m )
a(350) (m )
a(440) (m )
Fluor. 300/430 nm / a312 (QSE*m)
57.49 46.24 41.47 34.27 59.88 50.32 37.60 10.35 11.31 53.65 33.66 15.48 72.11 21.88 22.56 16.49 34.79 13.83 11.74 14.11 13.24 10.02 24.78 19.40 16.45 31.98 21.79 11.50
29.05 23.10 20.24 17.45 33.64 26.57 19.44 6.52 7.10 31.39 18.53 8.97 38.37 10.89 11.34 8.23 18.53 7.08 5.78 8.53 7.64 5.82 12.49 9.35 8.81 17.36 11.07 5.39
6.33 5.15 4.92 3.47 9.14 8.39 5.65 1.53 2.05 9.42 4.09 1.69 9.28 2.16 2.69 1.82 3.40 1.64 1.24 2.21 2.47 1.65 3.26 2.32 3.14 3.96 2.18 0.85
27.99 28.93 24.80 27.94 19.07 17.32 19.04 148.29 109.40 10.80 15.19 19.21 24.07 33.26 21.88 25.43 33.79 31.93 33.02 97.45 88.02 122.55 16.23 20.30 10.96 20.63 27.46 37.92
-1
118
-1
-1
DOC µM 266.90 1298.31 1065.51 982.49 1056.01 597.84
853.46 682.24 444.92 1256.51 521.47 590.88 337.25 738.33 228.25 277.00 314.58 1206.57 612.63 521.82 436.22 615.85 648.32 403.36
Appendix II. (cont.)
River
Salinity
Season
Manatee Manatee Manatee Manatee Mississippi Peace Peace Peace Peace Peace Peace Peace Peace Peace Peace Peace Peace Shark Shark Shark Shark Shark Shark Shark Shark Shark Shark Shark Shark
0.12 17.73 20.74 25.08 0 0 1.4 14 0.12 0.14 8.67 0 9.7 16.8 0 2.9 14.7 0.9 8.2 16.6 27.1 0.5 2.67 12.53 23.59 9.01 16.58 22.79 30.79
Winter 2005 Winter 2005 Winter 2005 Winter 2005 Winter 2004 Summer 2004 Summer 2004 Summer 2004 Summer 2005 Summer 2005 Summer 2005 Winter 2004 Winter 2004 Winter 2004 Winter 2005 Winter 2005 Winter 2005 Summer 2004 Summer 2004 Summer 2004 Summer 2004 Summer 2005 Summer 2005 Summer 2005 Summer 2005 Winter 2005 Winter 2005 Winter 2005 Winter 2005
Spectral Slope 350- Spectral Slope 280-1 -1 440nm (m ) 312nm (m ) 0.01744 0.01855 0.01977 0.01943 0.01336 0.01995 0.01717 0.01835 0.01777 0.01623 0.01729 0.01944 0.01967 0.01832 0.01566 0.01487 0.01401 0.01188 0.01340 0.01278 0.01375 0.01530 0.01461 0.01290 0.01279 0.01855 0.01800 0.02102 0.01601
0.01604 0.01867 0.01946 0.02019 0.01546 0.01491 0.01610 0.01978 0.01357 0.01359 0.01469 0.01516 0.01614 0.01605 0.01506 0.01454 0.01486 0.01542 0.01564 0.01535 0.01694 0.01694 0.01603 0.01557 0.01653 0.01897 0.01885 0.02007 0.02028
119
a(312) (m )
a(350) (m )
a(440) (m )
Fluor. 300/430 nm / a312 (QSE*m)
34.98 22.84 17.99 13.41 13.30 9.04 6.58 2.01 114.20 112.21 68.17 52.10 42.59 32.07 75.25 76.70 46.48 5.30 5.36 4.86 2.41 56.97 64.19 54.26 31.72 52.24 46.85 34.39 19.77
18.51 11.36 8.13 6.53 7.93 4.91 3.44 1.00 66.42 65.36 38.98 27.08 21.55 16.35 41.75 42.54 25.35 3.03 2.92 2.67 1.22 30.88 35.28 29.71 17.64 28.58 23.71 18.23 10.05
4.29 2.34 1.78 1.30 2.34 0.87 0.81 0.19 16.05 19.91 9.42 5.29 4.69 3.68 9.75 10.96 7.54 1.11 1.01 0.90 0.41 7.45 9.51 9.70 5.74 5.67 5.43 3.28 2.67
24.02 29.46 33.48 31.40 10.33 285.66 241.43 362.97 10.93 8.83 13.37 26.54 24.14 22.46 19.67 18.23 15.89 123.30 126.71 116.09 122.66 14.76 11.16 8.96 9.02 29.39 26.65 32.95 20.05
-1
-1
-1
DOC µM 700.68 414.35 375.49 321.24 250.89 1479.16 487.41 1529.21 1514.32 1113.51 1091.44 1063.99 784.49 813.41 862.86 793.10 898.15 640.17 428.45
802.65 753.95 582.03 443.85
Appendix II. (cont.)
River
Salinity
Season
Suwannee Suwannee Suwannee Suwannee Suwannee Suwannee Suwannee Suwannee Suwannee Suwannee Suwannee Suwannee
0 22.4 20.2 0.13 24.7 22.78 0 13.2 18.3 0 20.1 25.6
Summer 2004 Summer 2004 Summer 2004 Summer 2005 Summer 2005 Summer 2005 Winter 2004 Winter 2004 Winter 2004 Winter 2005 Winter 2005 Winter 2005
Spectral Slope Spectral Slope -1 -1 350-440nm (m ) 280-312nm (m ) 0.01724 0.01684 0.01685 0.01745 0.01889 0.02167 0.01633 0.01707 0.01658 0.01522 0.01498 0.01701
0.01189 0.01331 0.01420 0.01197 0.01550 0.01796 0.01377 0.01419 0.01520 0.01290 0.01459 0.01702
a(312) (m )
a(350) (m )
a(440) (m )
Fluor. 300/430 nm / a312 (QSE*m)
24.69 6.33 5.77 17.43 21.60 21.93 109.78 52.10 37.76 67.00 32.75 20.71
15.09 3.66 3.15 10.38 11.88 11.36 64.94 28.77 21.27 40.20 17.45 9.91
3.42 0.82 0.77 2.69 2.81 2.37 15.23 7.12 4.76 9.70 4.71 2.23
103.76 148.42 168.36 38.20 13.38 19.46 10.60 13.31 13.78 12.49 14.53 23.32
-1
120
-1
-1
DOC µM 581.93 789.86 723.78 1149.82 482.02 608.76 99.53 1061.50 880.66 351.50