Riegle LMS Z360i terrestrial Laser scanner and digital ..... Imagery of Eti-Osa, Lagos, Nigeria''. Geoinformatics FCE CTU 15(2), 2016, doi:10.14311/gi.15.2.5.
1
The applications of automatic image interpretation in surveying and photogrammetry Lamyaa Gamal El-Deen Taha
2
Table of contents
Item
Page
Abstract
1
1. INTRODUCTION
2
1.2.Different modern sensors and platform
3
1.2.1.Airborne Sensors
3
1.2.1.1.LiDAR
3
1.2.1.2 Hyperspectral camera
5
1.2.1.3.Unmanned Aerial Vehicle (UAV)
7
1.2.2.Space borne sensors
9
1.2.2.1.Radar (Synthetic Aperture Radar (SAR) )
9
2.1.1.1 )Polarimetric Synthetic Aperture Radar (SAR) (Polarized SAR) .
10
1.2.2.3.Optical images
10
1.2.2.3.1. Very high resolution satellite images
10
1.2.2.3.2. Satellite image characteristic
11
1.2.2.3.3. Image Preprocessing
11
1.2.2.3.4. Orthorectification using digital photogrammetry
12
2. Automatic image interpretation techniques
13
3
2.1. Classification techniques
13
2.1.1.Pixel-based classifiers
14
2.1.1.1 Unsupervised classification
15
2.1.1.2.Supervised Classification
15
2.1.1.3.Hybrid approach
15
2.1.2.Sub Pixel-based classifiers(Soft classifiers)
16
2.1.3.Object-Based Classification
16
2.1.3.1.Segmentation Algorithms
17
2.1.4.Accuracy assessment
17
2.1.5. Improvement of classification accuracy
19
2.1.5.1. Incorporation of ancillary data
19
2.1.5.2.Image fusion
20
2.1.5.3.Multiple classifier systems (MCS)-classifier Ensemble
20
2.2.Texture analysis
20
2.3. Edge detection
20
3. Applications of automatic image interpretation in surveying and photogrammetry.
21
3.1.Urban planning applications
21
3.1.1.Automatic Detection of features in urban areas
21
1.2.2.2.Buildings ( Built-up Areas ) extraction and reconstruction
21
3.1.1.2.Roads Detection/ extraction &Light poles and towers extraction
23
4
3.1.2.Slums Detections( Informal Settlements Detection)
26
3.1.3.Site selection
27
3.1.4.Land cover mapping
30
3.1.4.Land cover mapping
32
3.1.6.Solar energy assessment
34
3.1.6.Solar energy assessment
35
3.2.Land cover and tree species/ vegetation mapping
38
3.3.Coastal applications
40
3.3.1.Shoreline extraction/mapping
40
3.4. Coastal hazardous
40
3.4.1. Flood monitoring
40
3.4.2.Marine Oil spill control
41
3.5. Environmental hazardous
42
3.5.1.Desertification hazard
42
3.5.2.Forested areas
43
4. Summary and conclusion
44
References
46
5
List of Figures
Item
Page
Figure 1.a. Light Detection and Ranging(Source:from the world wide web).
3
Figure1.b. Example of air borne LIDAR Trimble AX60.
3
Figure1.c. Difference between DSM and DTM (Source :world wide web) .
4
Figure1.d Multiple echos(Soure :Yan et al., 2017).
4
Figure1.d Aircraft trajectories.
4
Figure1.e Example of 3D point clouds(Source :world wide web).
4
Figure 1.f LIDAR intensity image of the whole LIDAR survey.(Source :
4
Taha,2012) Figure 1.g. LIDAR intensity image of the whole LIDAR survey. (Source :
4
Taha,2012) Figure 1.h. Example of classified image using maximum likelihood classifier.
4
(Source : Taha,2012). Figure 1.i. Visualization of 3-D LIDAR las point clouds using PointVue )software.(Source : Taha and Bedawi ,2012
4
Figure 2.a. Pushbroom technique( Source: Taha and Shahin,2014a).
6
Figure2.b.
6
HySpex camera NEO VNIR & SWIR( Source: Taha and
Shahin,2014a). Figure2. c Flight operations( Source: Taha and Shahin,2014a).
6
6
Figure2. d. Spectral bands of Hyperspectral data ( Source: Taha and
6
Shahin,2014a). Figure2. e. Rectified VNIR image flight line (frame) (strip) ( Source: Taha and
7
Shahin,2014a). Figure2 .d
maximization on a part of the image( Source: Taha and
7
Shahin,2014a). Figure 2 .e .Example of classifiedhyperspectral image( Source: Taha and
7
Shahin,2014a). Figure 2 .f .Example of classifiedhyperspectral
image( Source: Taha and
7
(UAVs)(Source
8
Shahin,2014 b). Figure
3.a.
unmanned
aerial
vehicles
:trimble
presentation,2015). Figure 3.b. Launcher (Source :trimble presentation,2015).
8
Figure 3.c. Flight operation.(Source :trimble presentation,2015).
9
Figure 3.d. Color coded DSM (Source :trimble presentation,2015).
9
Figure 3.e. Orthomosaic. .(Source :trimble presentation,2015)
9
Figure4. a.Remote sensing satellite in its orbit around the earth(Source:from
10
the world wide web). Figure 4. b. Example of WorldView-2 imagery(Source:from the world wide
11
web). Figure4.c. Scheme for ortho-image production from satellite imagery (mono
11
or stereo). Figure 4.d. Orthorectification workflow for different levels of products. (Source :Liu et al,2007)
7
12
Figure 5 . a. Image classification.
13
Figure 5.b .Image classification techniques.
13
Figure 6.a. Pixel based classification.
14
Figure 6. b.Examples of Pixel based classification.
15
Figure 7.a. Object Based classification.
17
Figure7 .b.Example of image segmentation.
17
figure7.c .Examples of object based classification.
19
Figure 8.a. Digital orthophoto for buildings.
23
Figure 8.b. Digital orthophoto for hidden areas.
23
Figure 8.c Digital true orthophoto.
23
Figure9. Automatic road extraction from the classification of the best fused Image(IHS fusion) (Source: ElSharkawy et al.,2016 ).
25
Figure.10. Maximization on urban feature extraction (buildings and roads) from spot5 image using neural network classifier (Source : Taha and Sharawi,2014).
25
Figure11. Light pole/tower being detected: (from left to right) high-mast lighting, cctv camera pole, typical luminaire pole, train platform lighting and parking lot lighting (source :yan et al. 2015).
26
Figure12. slum mapping . (Source :Rhinane et al., 2011)
27
Figure13. Suitability map for industrialization (Source :Johar et al. ,2013).
28
Figure 14.a Flowchart of methodology ( Source : Effat and Hegazy,2013).
28
Figure14. b Flowchart of methodology . ( Source : Shaker and Salah,2015)
29
Figure14. c Suitability map for urbanization in Sinai Peninsula. ( Source :Effat and Hegazy,2013)
29
8
Figure14. d. Suitability map for urbanization in Sinai Peninsula. ( Source : Shaker and Salah,2015)
29
Figure15. Part of classification maps, a. Ground truth, b. Spectral, c. OBIA, d. Sta, and e. Proposed method ( Source :Liao et al. 2014 ).
31
Figure16. A multispectral RGB 432 aerial photo composite, (b) a feature landuse/land cover map using Haralick textural features and (c) a feature landuse/land-cover map using spectral characteristics. ( Source :Mhangara and )Odindi,2013).
32
Figure17. Methodology (Source :Hong and Anh, 2009).
32
Figure 18.a. Proposed workflow of automated updating of DCMs ( Source : Vozikis, 2004).
33
Figure 18.b. DSM normalisation ( Source : Vozikis, 2004 ) .
34
Figure18. c. DSM of a subset of the case study over Nimes (France) ( Source : Vozikis, 2004 ).
34
Figure 18.d. Corresponding DCM with extracted building information ( Source : Vozikis, 2004 ).
34
Figure 19. a Work Flow for the Applied Methodology( Source :Taha and Effat ,2014)
35
Figure19. b Solar PV Potentiality Map for the Five Classes of Roofs( Source :Taha and Effat ,2014)
35
Figure 20.a. Land Use Changes of Hilton Head Island ( Source :Lin et al ,2005).
36
Figure20.b Methodology flow chart (Source :Gandhi et al., 2016 ).
36
Figure 21.a. The land use and land cover map of Shijiazhuang in 1987 (Source: Xiaoet al., 2006).
36
Figure 21.b.The land use and land cover map of Shijiazhuang in 2001 (Source: Xiao et al., 2006).
36
9
Figure22. a. Methodology of measuring urban sprawl (Source :Sharma et al.,2015)
37
Figure22.b. urban sprawl (Source :Sharma et al.,2015).
37
Figure 22.c. Buffer zone around the study area 2001 built up area is shown in red color(Source :Sharma et al.,2015).
37
Figure22.d. Buffer zone around the study area 2011 built up area is shown in red color(Source :Sharma et al.,2015).
37
Figure 23.a LIDAR point cloud data processing workflow (Source :Jawak et al., 2013).
38
Figure 23.b. 3D representation of extracted features (Source :Jawak et al., 2013).
39
Figure24. Flowchart of vegetation mapping in the Everglades from hyperspectral imagery(Source : Zhang and Xie, 2012).
39
Figure25. Matched shoreline points in first and second image ( Source: Li et al.,2003).
40
Figure26 . Line features extracted from Canny Edge Detector (Source: Shaker et al. 2008).
41
Figure:27.a. Methodology for Desertification Status Mapping (DSM) ( Source : Dhinwa et al.,2016).
42
Figure:27.b. Land use/ land cover map of Bellary district ( Source : (Dhinwa et al.,2016)
43
Figure 28. Classified images using the object-based and pixel-based approaches and the final layers for the ‘combined classification method’ for the two years analyzed (Source : Gutiérrez et al.,2012).
44
10
Abstract The present study attempts to review the state of art for applications automatic image interpretation in surveying and photogrammetry. The increased information and experience in automatic image interpretation and new technology developed over time increased the number of applications of automatic image interpretation in surveying and photogrammetry. It is desirable to automatically extract useful feature from input data such as very high resolution optical images, Radar images (SAR-Polarized SAR), LIDAR data, photogrammetric data such as airborne digital camera, UAV images and hyperspectral data. Hence, a survey of automatic feature extraction methods was presented. This article reviewed major land cover classification techniques, including pixel based classification techniques, subpixel based classification techniques, and object-based classification methods. The main focus is certainly on the summarization of modern classification methods and the approaches used for improving classification performance. In this article, the emphasis is placed on the current applications of automatic image interpretation in surveying and photogrammetry. It was reported that correct choice of derived features from remotely sensed data (multicues) and the use of appropriate classification technique are needed for classification accuracy improvement. Also edge detection and texture analysis will be explored. Keywords: Automatic feature extraction applications- photogrammetrypixel based classification-subpixel based classification-object based classification – Edge detection – Texture analysis- UAV- photogrammetry LIDAR data- Radar images- Hyperspectral data.
11
Research objectives:
Highlight different modern sensors and platforms. Study techniques currently used for automatic image interpretation from different data sources. Study
different
applications
of
automatic
image
interpretation. 1. INTRODUCTION
Automated image interpretation of remotely sensed images has great interesting for many numbers of applications. There are a tremendous variety of airborne and space borne sensors such as such as airborne digital camera and UAV images, LIDAR data, ,hyperspectral data ,very high resolution optical images and Radar images (SAR-Polarized SAR). These airborne and space borne sensors offer an advance potential for extracting features. There are different techniques of automated image interpretation such as image classification, edge detection, texture analysis. Advanced classification methods can be applied to accurately extract information from remote sensing data ( Gutiérrez et al., 2012). The objective of pixel based image classification is to label all pixels in the remotely sensed imagery to specific classes (e.g. desert, vegetation, roads, buildings, water bodies, etc.). It uses spectral information only. Recently, object based classification not only uses spectral information of different classes, but also spatial information such as shape, location, geometry, texture and contextual data criteria, which effectively avoid the “salt & pepper phenomenon” and improve the classification accuracy. Numerous features characterizing object’s spatial, textural, and contextual properties can be derived as a supplementary information to the spectral information to potentially improve classification accuracy (Jawak et al., 2015 ). Recently, however, many researchers have used artificial intelligence methods such as neural networks, support vector machines and expert system, as alternatives to remotelysensed image classification approaches ( Zou and Li ,2009 ). Land cover information is crucial to several environmental and socio-economic applications. For example, urban and regional planning, natural resources management, etc. (Li et al.,2014) In this article, the author reviewed the current state of the art with respect to automatic image interpretation applications in surveying and photogrammetry.
1.1.Definition of image interpretation 12
Image interpretation has many definitions. Image interpretation can be defined as ‘’the act of examining images for the purpose of identifying objects and judging their significance” (Colwell, 1997). On the other hand, ‘’Image interpretation refers to the process of acquiring information from the images’’ ( Sun et al.,2014). As traditional method of analyzing images (visual interpretation) are time-consuming, subjective, and require well-trained interpreters, new approaches for automatically extract features of images must be explored (Morgan et al.,2010). In order to collect and use information with high effectively and efficiently, it is significant to have a good knowledge of the modern remote sensing sensors and tools. Feature extraction of spatial information can be collected from aerial photos, airborne light detection and ranging (LIDAR) data, satellite images (mono or stereo) and synthetic aperture radar (SAR) image.
1.2.Different modern sensors and platforms 1.2.1.Airborne Sensors 1.2.1.1.LIDAR Light Detection and Ranging (LIDAR), is an emerging technology, provides the possibility of acquiring high dense three dimensional point clouds ( X,Y,Z) and the intensity data(I). In some cases, multiple pulses or full waveform signals can be captured by certain hardware systems (Zhang , 2005) Also high accuracy Digital Elevation Models( DEMs ) can be generated in a fast and cost-effective way (Liu et al, 2007). Airborne LIDAR consists of: a) GNSS receiver (Global Navigation Satellite System GNSS), for recording the aircraft position, (b) an Inertial Measurement Unit (IMU) for measuring the angular attitude of the aircraft (roll, pitch and yaw) and c), a Laser Scanner Unit. (Hu et al.,2011); (Zhou et al., 2008) (Figure 1). LIDAR can capture a georeferenced 3D point clouds from both first and last echos. The LIDAR points being on the terrain are separated from points on buildings, trees and other object above terrain; Digital Surface Model (DSM) and Digital Terrain Model (DTM) can be derived easily and quickly (Wang and Hsu,2008) (Rottensteiner, and Briese,2002). LIDAR technology is able to accurately measure the shape and height of objects suitable for several applications such as generating Digital Elevation Models (DEM’s), basic surveying and mapping, topographic mapping, telecommunications, natural hazard assessment, urban planning, transportation, and environment protection. It can directly obtain the 3D coordinates of object for 3D object reconstruction and 3D city modelling (Li et al., 2005).
13
Figure
1.a.
Light
Detection
and Figure1.b. Example of air borne LIDAR
Ranging(Source:from the world wide web).
Trimble AX60.
Figure1.c. Difference between DSM and DTM Figure1.d Multiple echos(Soure :Yan et (Source :world wide web) . al., 2017).
Figure1.e Aircraft trajectories.
Figure1.f Example of 3D clouds(Source :world wide web).
14
point
Figure 1.g LIDAR intensity image of the whole Figure 1.h Height variation in Lidar DSM LIDAR survey (Source : Taha,2012). of the whole LIDARsurvey (units in meter)
Figure 1.i. Example of classified image using Figure 1.m. Visualization of 3-D LIDAR maximum likelihood classifier (Source : las point clouds using PointVue software Taha,2012). (Source : Taha and Bedawi ,2012).
1.2.1.2 Hyperspectral camera Hyperspectral remotely sensed data, measuring hundreds of spectral bands in a wide range of wavelengths from aircraft or satellite platforms (Tuominen, et al.,2011); (Du et al., 2009) (Figure 2). Hyperspectral imaging sensors, is concerned with the recording, analysis, and interpretation of spectrum acquired by an airborne or satellite sensor. Hyperspectral remote sensing is a useful tool for earth observations. Hyperspectral sensors is capable of producing two dimensional images over many contiguous narrow spectral bands containing the visible, near-infrared, and shortwave infrared spectral bands (Li et al,2012).
15
The main advantage of hyperspectral remote sensing is the amount of spectral information it provides. Although hyperspectral remote sensing deals with imaging at narrow and large number of spectral bands (Navalgund et al. ,2007). In contrast to multispectral sensors such as Landsat 8, SPOT or Worldview that collect spectral data in a few spectral bands (less than 20 bands), the hyperspectral sensors were designed to achieve substantial improvements of the earth observations such as getting better classification accuracy. Hyperspectral imaging has been widely used in many fields, such as coastal zone management, targets discrimination, landmines detection, mineral discrimination, crop identification, land use planning and environmental monitoring.
Figure 2.a. Pushbroom technique( Source: Taha Figure2.b. HySpex camera NEO VNIR and Shahin,2014a). & SWIR( Source: Taha and Shahin,2014a).
Figure2. c Flight operations( Source: Taha and Shahin,2014a). 16
Figure2. d. Spectral bands of Hyperspectral data ( Source: Taha and Shahin,2014a).
Figure2. e. Rectified VNIR image flight line (frame) (strip) ( Source: Taha and Shahin,2014a).
Figure2 .f Maximization on a part of the image(
Figure 2 .g .Example of classified
Source: Taha and Shahin,2014a).
hyperspectral image( Source: Taha and Shahin,2014a).
17
Figure 2 .h .Another example of classified hyperspectral image( Source: Taha and Shahin,2014 b).
1.2.1.3.Unmanned Aerial Vehicle (UAV) Unmanned aerial vehicle (UAV) is used for evaluation and mapping of remote area initially for military applications. It’s advantages, such, low cost, ready availability and light-weight sensors. UAV system is capable of carrying GPS, IMU and sensor to serve a tremendous applications, for example, rapid mapping, agricultural mapping, crops monitoring and range land study (Yan et al., 2017). Despite the current restrictive regulations, the use of unmanned aerial vehicles (UAVs) equipment with small digital RGB camera, hyperspectral, LIDAR, and/or multi-spectral sensors has become as a promising alternative for producing data(Figure 3) . Aerial imagery, including that from unmanned aerial vehicles (UAVs), has become increasingly popular. The overlap between the images enables stereoscopic image processing, the delineation of point clouds, and the generation of seamless image mosaics (Thiel and Schmullius ,2016 ). UAV images have many advantages such as, high spatial resolution, low cost, and ready availability, which provide numerous potential applications. Compared with low or median spatial resolution images, aerial images often have very high spatial resolution (VHSR). This provides more details of the earth surface, including the shape, structure, size, and texture of ground targets, and even topology and thematic information among targets. Therefore, a very high resolution images (VHSR) image is useful for investigating urban environments, target extraction, and urban land-cover mapping (Lv et al., 2017).
Figure 3.a. Unmanned aerial vehicles Figure (UAVs)(Source
3.b.
Launcher
:trimble presentation,2015).
presentation,2015).
18
(Source
:trimble
Figure 3.c. Flight operation (Source :trimble presentation,2015).
Figure 3.d. Color coded DSM (Source Figure 3.e. Orthomosaic (Source :trimble :trimble presentation,2015).
presentation,2015).
1.2.2.Space borne sensors 1.2.2.1.Radar (Synthetic Aperture Radar (SAR) ) SAR is an active sensor, and is therefore independent on atmospheric circumstances such as rain and cloud coverage (Gungor and Shan 2006; Dekker 2000), which can solve the optical sensors problem such as not getting enough information (Young et al. 2000). Furthermore, SAR can penetrate the earth surface and get the underground data(Young et al. 2000). 19
1.2.2.2. Polarimetric Synthetic Aperture Radar (SAR) (Polarized SAR) Polarized SAR is useful source of informations for Earth observation. The advantage of Polarimetric SAR sensors over single channel SAR sensors is more complete description of objects’ scattering behavior (Dabboor, 2011). A lot of research have been carried out showing that fully polarimetric SAR systems are better in discriminating different land cover feature as than single or dual polarimetric SAR data (Mishra and Singh, 2011). Polarimetric SAR data is available from different sensors for different frequencies like RADARSAT-2, ALOS_PALSAR and TerrSAR-X, RISAT-1 (Moreira et al., 2013) Four different modes are usually considered: HH, horizontally polarized emitted, horizontally polarized received as for HV horizontally polarized emitted, vertically polarized received, VV vertically polarized emitted, vertically polarized received and VH vertically polarized emitted, horizontally polarized received. A fully polarimetric SAR system has all 4 channels HH, HV, VH and VV(Zyl and Kim, 2011) . The classification of PolSAR data itself is bad therefore polarimetric decomposition is made. The input parameters for PolSAR classification are SAR observables obtained by decomposition methods. Many algorithms for decomposition have been proposed (Qi et al., 2010) and classification techniques based on the decomposition results were also used by some researchers.
1.2.2.3.Optical images 1.2.2.3.1. Very high resolution satellite images The recent availability of very high resolution satellite data such as IKONOS ,QuickBird, Geoeye , Orbview, Pléiades and World view offer an interesting alternative for map production and updating ( Figure 4).
Figure4. a.Remote sensing satellite in its orbit around the earth(Source:from the world wide web).
20
1.2.2.3.2. Satellite image characteristics The recent advance in sensor technology makes the high resolution remote sensing imageries readily available. Different image characteristics of high resolution images such as radiometric ,spatial, temporal and spectral resolutions as well as stereoscopic vision introduce them as a powerful new source for Geomatics, remote sensing, GIS, photogrammetric, and applications.
Figure 4. b. Example of WorldView-2 imagery (Source:from the world wide web).
1.2.2.3.3. Image Preprocessing Preprocessing of image data often will include radiometric correction and geometric correction. There are different levels of geometric correction of satellite image: rectification, orthorectification and true orthorectification. Rectification: is used when the terrain is flat such as in coastal areas to eliminate tilt displacement. Orthorectification: is used to eliminate both relief displacement and tilt displacement. The orthorecification processes requires the Digital Elevation Model (DEM) data (Figure4.c) (Figure 4.d). True orthorectification: is used to eliminate both tilt displacement and relief displacement as well as relief displacement from building. The true orthorecification processes requires the Digital Surface Model (DSM) data (Baboo and Devi,2011; Widyaningrum et al.,2016) .
Figure4.c. Scheme for ortho-image production from satellite imagery (mono or stereo) (Source:from the world wide web). 21
1.2.2.3.4. Orthorectification using digital photogrammetry Orthorectification is the process of removing tilt and relief displacement by transforming the perspective image to an orthogonal projection. The stereo image orthorectification process is usually implemented utilizing digital photogrammetric workstation. The resulted image combines the image characteristics of a photo with the geometric quality of map. The required inputs for orthorectification process are a perspective image, camera or sensor calibration file, ground control points and a DEM. The workflow for producing digital orthoimage is well established by using a range of digital photogrammetric systems. It usually includes steps of digital image acquisition, camera or sensor modelling, GCPs collection, aerial triangulation, and image orthorectification. Digital images can be acquired by scanning aerial photography or obtained by using a digital airborne sensor. High spatial resolution satellite imagery is also an increasingly popular data source for producing orthoimages. Camera/sensor modelling is referred to as interior orientation which defines a camera/sensor’s interior geometry as it existed at the time of image capture. Camera calibration information and the measurement of fiducial marks are the primary input for the interior orientation which transforms the image from pixel coordinate system to the image space coordinate system. level 1: is raw digital image. level 2: rectified image with, tilt displacements being eliminated. level 3: orthorectified image with, tilt and terrain relief have been removed so that the resulting image is an orthographic projection with a consistent scale. The orthorecification processes requires the Digital Elevation Model (DEM) data level 4:True orthorectified image: with, tilt and terrain relief have been removed as well as relief displacement from building. The true orthorecification processes requires the Digital Surface Model (DSM) data (Liu et al.,2007) .
Figure 4.d. Orthorectification workflow for different levels of products (Source :Liu et al,2007).
22
2. Automatic image interpretation techniques 2.1. Classification techniques Image classification is one of the useful processes in image processing. It can be defined as a method to classify images into numerous categories, based on their similarities (Jain and Tomar,2013) (Doma et al., 2015). (Figure 5.a) Many classification techniques have been developed and used to classify remotely sensed data (Chu et al.,2012). Major remote sensing image classification techniques can be grouped as pixel-based, subpixel-based, and object-based image classification methods (Jia ,2015 );(Li et al.,2014). The produced LULC maps used a basis for strategic planning and management.(Figure 5.b)
Figure 5 . a. Image classification(Source:from the world wide web). Image classification techniques
Pixel-based
Unsupervised classification
Sub-pixel--based
Supervised classification
Figure 5.b .Image classification techniques.
23
Object-based
2.1.1.Pixel-based classifiers In case of Pixel-based classifiers, it Process entire scene pixel by pixel. Pixel-based classification techniques assume each pixel is pure and typically categorized as a single land use land cover class (Li et al., 2014) (Figure 6). Pixel-based classifiers are grouped into two classification approaches: supervised classification and unsupervised classification. Pixel based classifiers or hard classifiers or traditional classifiers may give wrong classification if the images are contained mixed pixels. This attributed to the fact that the spectral information of a mixed pixel may no longer match any of the member classes or may be similar to the spectral information of different types of class (Jawak et al.,2015).
Figure 6.a. Pixel based classification (Source :world wide web).
24
Figure 6. b.Examples of Pixel based classification(Source :world wide web).
2.1.1.1 Unsupervised classification Unsupervised classification procedure is more automated than supervised classification and is critical when accuracy is not required and time is less. In unsupervised classification, samples are not needed. It does not require operator intervention as it is fully computerized, it is fully automated (Sharma et al. ,2011);(Nath et al.,2014). Thus, in unsupervised classification method: 1) sample data are not required and 2) only a number of classes is required by the user (Jawak et al.,2015). In unsupervised classification, pixels are grouped with the help of their properties. This process known as clustering and groups are known as a cluster. Common unsupervised classification approaches are iterative self-organizing data analysis( ISODATA), K-means, (Ponnusamy et al.,2017).
2.1.1.2.Supervised Classification The supervised classification is the vital for extracting quantitative information from remotely sensed image data. This approach learns patterns in data to predict and label an associated class. The step of learning is called training or sampling. Once trained, the classifier is then used to categorize all the image pixels according to samples. The most common supervised classification techniques are the Maximum Likelihood Classifier (MLC) for parametric input data and Parallelepiped Classifier for nonparametric data (Sharma et al. ,2011) .
2.1.1.3.Hybrid approach Hybrid classification method merges both supervised and unsupervised algorithms and can used to improve classification accuracy. (Jawak et al.,2015).
25
2.1.2.Sub Pixel-based classifiers(Soft classifiers) A pixel may be not pure pixel but contains mixture of various land cover classes. So that Sub Pixel-based classifiers have been proposed as an alternative to pixel based classifiers because of it’s ability to deal with mixed pixels. Researches of improvement of classification accuracy have often concentrated on the mixed pixels problem where pixels within an image represent a mixture of land cover types. The use of traditional hard classification for categorizing a mixed pixel provides inappropriate results (Li,2014); (Foody, ,1996). In case of soft classifiers, it associates the pixel with many classes in varying proportions. Subpixel classifiers can be used in coarse and medium spatial resolution images. Several researchers have discussed mixed pixel problem. There are a wide range of methods for subpixel classifiers such as artificial neural networks classifier , Fuzzy c-means classifier, mixture modeling, spectral mixture analysis( SMA) ,and Support vector machine (SVM) classifier(Li et al.,2014); (Rao et al.,2007);( Bernard et al.,1997), and such sub-pixel based analyses have been applied in geology, forestry, as well as urban analyses
2.1.3.Object-Based Classification Object based approach is increasingly used in image processing and particularly in the geospatial domain. In object-based classification, one do not classify each pixel but objects (groups of contiguous pixels) (Mag-usara and Japitana, 2015); (Ke et al.,2010) ; (Walter,2004) ,(Yu et al., 2006). Object based approach is used in order to overcome the salt-and-pepper effect and H-resolution problem. Object Based Image Analysis (OBIA) has been used recently for producing land cover maps using automatic approaches for analyzing of very high resolution imagery (Hernando et al.,2012). OBIA has been focused on both spectral properties of features as well as spatial properties for example, their texture, shape, orientation and contextual data (Yadav et al.,2015); (Estabillo and Tamondong,2015); (Moreno and Larriva,2012 ). The first step in the object-based classification was to segment the pixel-based images into objects as defined by the user (Makinde et al.,2016). (Figure7). Segmentation process generates new image objects or alters the morphology of existing image objects according to specific criteria (Yadav et al.,2015); (Brennan and Webster,2006). Image segmentation is influenced by colour, scale, and form (Whiteside and Ahmad ,2005). The selection of suitable segmentation technique with proper scale helps in accurate classification. Efficient segmentation should generate image objects that have optimal information for further extraction of land cover information (Yuan and Bauer ,2006). The existed softwares such as eCognition and Feature Analyst have been developed to make object-based classification. It analyses both the spectral and spatial/contextual properties of pixels and use a segmentation algorithm and iterative learning methods to get 26
classification that provides more accurate results than pixel-based methods (Makinde et al.,2016). The rule-based algorithm and the standard nearest neighbor (NN) algorithm are the most commonly employed object based algorithms, popularized by the available commercial software such as eCognition , Feature Analyst and ENVI (Jawak et al.,2015 ).
Figure 7.a. Object Based classification(Source :Taha and Sharawi,2017).
2.1.3.1.Segmentation Algorithms There are a variety of segmentation algorithms such as multiresolution segmentation, Spectral difference algorithm, quad tree,Multi threshold algorithm, chessboard, Contrast filter algorithm and contrast split segmentation. The segmentation algorithms are provided in eCognition. Recently, many researchers have used artificial intelligence methods including, artificial neural networks, expert system and support vector machines as alternatives to remotely-sensed image classification methods ( Zou and Li ,2009 ).
Figure7 .b.Example of image segmentation(Source :Taha and Sharawi,2017).
2.1.4.Accuracy assessment The accuracy of the classification is checked by comparing the classified image with reference data such as ground reference data or another reference image (Jawak et al.,2015). Accuracy assessments could be assessed using confusion matrices and Kappa statistics (Whiteside and Ahmad,2005).
27
28
figure7.c .Examples of object based classification(Source :world wide web).
2.1.5. Improvement of classification accuracy Many researchers studied classification used many different data and different techniques for improvement the classification accuracy (Zou and Li, 2009). 2.1.5.1. Incorporation of ancillary data Ancillary data could be incorporated into modern classification techniques such as neural networks and expert system(Jensen ,2005). Remotely sensed data have many unique characteristics (spatial, spectral, radiometric, temporal and polarization). The use of all these characteristics is efficient for improvement of classification accuracy. As high spatial resolution images become easily available, it’s derived textural and contextual metrics have significant role in image classification (Lu and Weng,2007). Berberoglu et al. (2009) evaluated the usefulness of combining texture metric into MLC and ANN classification methods over Mediterranean region, utilizing LANDSAT-TM image. The best classification accuracies were obtained by using the ANN algorithm. LIDAR sensor captured 3D topography data, which adds a new dimension to the land cover classification (Yan et al., 2017). Digital elevation models and its derivatives such as slope and aspect could be incorporated into classification. One type of LIDAR-derived feature is normalized DSM (nDSM), which represents the above-ground feature only, can be generated by subtracting the digital elevation model (DEM) from the digital surface model (DSM) (Yan et al., 2017). There are a few researches utilizing the multiple returns characteristic of LIDAR data for facilitating land cover classification. By using the first and the last returns of LIDAR data, intensity feature, height feature or the difference among these attributes can be generated. 29
2.1.5.2.Image fusion One wants to obtain images of high spatial and high spectral resolutions simultaneously, this led to use of image fusion methods taking advantage and merits of both images in order to provide images with high spatial and high spectral resolution at the same time. During the past years, a variety of image fusion methods have been developed for integrating images of different characteristics (Kumar and Singh, 2010). Pansharpened images may provide better and accurate interpretation results since data with different characteristics are integrated (Yakhdani and Azizi , 2010; Kumar and Singh ,2010). (Weih and Riggan, 2010 ) used two multi-temporal (leaf-on SPOT-5 and leafoff SPOT-5 images), and a high spatial resolution color infrared digital orthophoto (CIR) (1meter) acquired during leaf-off conditions using Leica ADS40 camera over the same study area. These three images were integrated then classification accuracy was accessed. The results indicated that object based classification utilizing all three-images provides the best overall accuracy (82percent), then the object-based classification utilizing the highspatial resolution image combined with the SPOT-5 leaf-off image (78.2 percent). The results also demonstrated that object-based classification outperformed both supervised and unsupervised pixel-based classification techniques.
2.1.5.3.Multiple classifier systems (MCS)-classifier Ensemble Nowadays, classifier ensemble is widely used for land cover classification of remotely sensed data. The main objective is to efficiently combining the results of the classifiers utilizing merits of the benefits of each while reducing their disadvantages ( Salah et al.,2010). The resulting classifier is generally more accurate than any of the individual classifiers that consisting the ensemble(Bigdeli et al.,2013) .
2.2.Texture analysis Texture is defined as ‘’the visual effect caused by spatial variation in tonal quantity over relatively small areas’’ (Wang et al.,2004) . Texture analysis takes in mind the distribution and variation of neighbourhood pixel data and hence the spatial properties of classes could be included as one of the classification parameters to substitute the Shortage of the spectral information (Shaker et al,2008). Three parameters affect texture information extraction, namely window size, displacement vector and quantization level. ( Kanniah et al.,2007).
2.3. Edge detection Edge detection includes the detection of boundaries between different regions of the image (Mohanta and Sethi ,2007) .There are different types of edge detectors such as canny,sobel.
30
, each type designed to be sensitive to certain types of edges. Factors involved in the selection of an edge detector include noise environment, edge orientation and edge structure. The geometry of the operator determines a characteristic direction in which it is most sensitive to edges. Operators can be optimized to look for horizontal, vertical, or diagonal edges. Edge detection is difficult in noisy images, since both the noise and the edges contain high-frequency content. Noise reduction produced blurred and distorted edges (Maini and Aggarwal,2015) 2.3.1.Edge detection Problems There are problems of false edge detection, missing true edges, producing thin or thick lines and problems due to noise etc.
31
3. Applications of automatic image interpretation in surveying and photogrammetry
3.1.Urban planning applications 3.1.1.Automatic Detection of features in urban areas: Automatic building extraction remains an open research area in digital photogrammetry and computer vision for many years. Many studies were conducted for automating the techniques of building extraction.
3.1.1.1.Buildings ( Built-up Areas ) extraction and reconstruction:
Kadhim, et al., (2015) conducted a study on automatic extraction of urban buildings based on shadow information from satellite imagery. Ok, (2014) used another study on automated detection of arbitrarily-shaped buildings from very high resolution optical satellite image. Singhal & Radhika, (2014) reported automatic detection of buildings from aerial images using Colour Invariant and Canny Edge Detection. Jumlesha et al., (2012) proposed an automatic urban feature extraction using mathematical morphology. Taha and Bedawi (2012) established two procedures for building detection and extraction from LIDAR data. The two techniques proposed were:a) building detection and building extraction from LIDAR point cloud data. A filtering module has been developed using Swarm intelligence based classification and is implemented suing MATLAB. b) building detection and building extraction from the true orthoimages of digital camera. In this approach, Leica photogrammetric suite LPS has been used for image orientation, triangulation and generation of true orthoimage. Building detection has been performed by classification of the true orthoimage using Swarm intelligence. The results from the two procedures have been compared. The performance of the developed methods was compared also to maximum likelihood classifier. A total of five classes were defined. It was shown that overall classification accuracy improved by 2.53%, from 84.6% using (MLH) to 87.13% using the first approach and improved by 6.88%, from 84.6% using (MLH) to 91.48% using the second approach. Taha(2012) compared five different schemes for automatic feature detection based on maximum likelihood classification (MLC)classification, utilizing LIDAR and RGB image of digital aerial data acquired over Vaihingen/Enz, Germany. The five datasets used were:a) LIDAR intensity image b) three digital aerial image bands c) three digital aerial image bands and two LIDAR metrics images (average and standard deviation) d) two LIDAR metrics images e) three digital aerial image bands combined with intensity feature and two LIDAR metrics images (average and standard deviation). 32
A comparison between these five schemes has been conducted. The results revealed that the last approach is the best followed by the third approach then the second approach then the fourth approach followed by the first approach. Neural network classification was used for improving the results of the best approach (last one). The achieved overall accuracy was 97%, and kappa index was 0.94. The results indicated that the neural network classification is better than maximum likelihood classification.
Elshehaby and Taha (2009) compared three approaches for building detection based on maximum likelihood classification. The contributions of the individual features used in the classification have been investigated. A rule based expert system for building detection based on combination of classified image, height data, and spectral information was developed using knowledge engineer of ERDAS Imagine and used for refinement of initially detected building. The results have demonstrated that the use of expert system increased the classification accuracy. The overall accuracy of expert classification was 96% and kappa coefficient was 0.95. Aytekin et al. (2010) carried out a study on building detection from multispectral satellite image using unsupervised classification. Keinan and Doytsher (2008) proposed automatic procedure and algorithms for using LIDAR data in order to generate an true digital orthophoto. (Figure 8). Lari and Ebadi (2007) presented a research on automated building extraction using Artificial Neural Networks from VHR satellite image utilizing from structural and spectral information. Theng (2006) conducted a research on automatic building extraction from satellite image. Jie et al. (2006) presented a method for building detection and reconstruction from LIDAR data using object based technique. The buildings were reconstructed. (Sohn and Dowman(2007) proposed a new method for automatic extraction of building tops from a combination of aerial laser data acquired from the Optech's 1020 ALTM (Airborne Laser Terrain Mapper) low-sampled (0.1 points/m2) and the IKONOS image with pansharpened multi-spectral bands. The results of evaluation indicated the branching factor which represents the detection performance of up to 0.11 and the correctness which represents the detection percentage of 90.1% and the overall quality of 80.5%. In my opinion, building detection is a hot research topic. The majority of researches are concerned with building detection, an extremely hard problem to which a number of approaches have been tried. It is also a problem of great economic importance, since manual delineation is extremely expensive, and there are a number of applications waiting for affordable 3D building data. Although progress has been made, it is evident that no robust general solution for the problem has yet been implemented. The various approaches can be characterized along several axes, including the degree of automation, the features used as algorithm inputs, the type of data used, and the types of features or ancillary data incorporated, the complexity of the buildings, the height of the buildings, the shadow of the buildings. The objective of all techniques is to increase the degree of completeness and correctness.
33
Figure 8.a. Digital orthophoto for buildings. Figure 8.b. Digital orthophoto for hidden areas (Source :Aytekin et al. ,2010).
Figure 8.c Digital true orthophoto(Source :Aytekin et al. ,2010).
3.1.1.2.Roads Detection/ extraction &Light poles and towers extraction (ElSharkawy et al.,2016 ) applied three different fusion techniques, namely: (Wavelet, Hue-Saturation-Value (HSV) and Intensity-Hue-Saturation (IHS)) for combining the Egyptsat-1 and Radarsat-2 images to improve the classification accuracy. The resulted three pansharpened images were fed to four different classification methods, namely: fuzzy, neural network (as a soft classifiers), the maximum likelihood, and minimum distance (as a hard classifiers), where the classification delineated five classes, namely: water, urban, roads, sand, and agriculture. Then, roads class was separated only. After that, accuracy assessment of the classifiers have been performed and compared. Results have demonstrated that image fusion improved the classification accuracy and the accuracy of the fuzzy classifier is better than the other classifiers (neural network, the maximum likelihood, and minimum distance classifications) in all cases. The best resulted thematic map from all produced cases is that obtained from the fusion (IHS, HSC, and wavelet) techniques then roads were extracted from this image automatically. The accuracy assessment for extracted road is more than 80%. Also, the results prove that the approach is excellent for extracting roads from medium resolution images ( Figure.9). (Taha and Sharawi,2014) compared the performance of two supervised classification methods (maximum likelihood classification and neural network classification) for automated extraction of man made features (roads and buildings) from high resolution 34
pansharpened SPOT5 satellite image. After producing true orthoimage by true orthorectification of Spot5 image using 3Dfirst order polynomial and 3Dsecond order polynomial utilizing from DSM generated from Stereo Spot 4. Leica Photogrammetric Suite (LPS) module of Erdsa Imagine 9.2 software was utilized for automatic DSM creation via soft-copy photogrammetry. The results indicated that the neural network technique was better than maximum likelihood on mixed composition. The overall accuracy of the neural network method and maximum likelihood method was (95% and 89%) respectively. The kappa index was( 0.86 and 0.81) respectively. Then noise was removed using morphological operations ( Figure.10). Elshehaby et al.,(2013 ) compared two classifiers (spectral Angler Mapper and maximum likelihood classification algorithms) for classifying SPOT5 image / fused SPOT4 mosaic with and without including DSM( that has been generated from SPOT 4 stereo images using Leica Photogrammetric Suite (LPS) digital photogrammetric workstation as an additional layer with the satellite image). The overall accuracy of Spectral Angler Mapper was more accurate than that of maximum likelihood classification. After producing base maps roads have been extracted from automatic classification using SAM taking into consideration DSM as an additional layer and from manual digitizing of orthoimages. Yan et al.(2015) proposed a new method for automatic extraction of light poles and towers from mobile LiDAR point cloud data acquired over a section of highway 401 located in Toronto, Ontario, Canada. The results indicated that detection rate of the proposed approach was an over 91% for five types of light poles and towers (Figure11). In my opinion, road detection is a hot research topic. The majority of researches are concerned with road detection, an extremely hard problem to which a number of techniques have been tried. Although progress has been made, it is evident that no robust general solution for the problem has yet been implemented. The various techniques can be characterized along several axes, including the degree of automation, the features used as algorithm inputs, the type of data used, and the types of features or ancillary data incorporated. The objective of all techniques is to increase the degree of completeness and correctness.
35
Figure9. Automatic road extraction from the classification of the best fused Image(IHS fusion) (Source: ElSharkawy et al.,2016 ).
Figure.10. Maximization on urban feature extraction (buildings and roads) from spot5 image using neural network classifier (Source : Taha and Sharawi,2014). 36
Figure11. Light pole/tower being detected: (from left to right) high-mast lighting, cctv camera pole, typical luminaire pole, train platform lighting and parking lot lighting (source :yan et al. 2015).
3.1.2.Slums Detections( Informal Settlements Detection) Governorate is fighting against the phenomena of increasing growth of the informal settlements that referred as slums (Rhinane et al., 2011). (Rhinane et al., 2011) evaluated the effectiveness of using object-based classification of pansharped high resolution (SPOT5) images for the assessment, delineation and quantification of slums in the city of Casablanca. Results have demonstrated that object-based classification method is efficient for the extraction of slums (85percent) (Figure12). In my opinion, slums detection is a hot research topic. The majority of researches are concerned with slums detection. Although progress has been made, it is evident that no robust general solution for the problem has yet been implemented. The various approaches can be characterized along several axes, including the degree of automation, the features used as algorithm inputs, the type of data used, and the types of features or ancillary data incorporated, the complexity of the slum. Many studies concerned with the pattern of the slum and the urbanization metrics.
37
Figure12. Slum mapping (Source :Rhinane et al., 2011).
3.1.3.Site selection (Johar et al. ,2013) carried out a study for identifying suitable sites for industrial development on a part of Uttar Pradesh state (Banda and its surrounding) using multicriteria decision making. The proposed method has been developed in GIS environment. A suitability map was produced indicating different suitability classes for industrial development. (Figure13). Effat and Hegazy( 2013) applied remote sensing and Geo-graphic Information System (GIS) to assess the potentiality of the desert for urban development in Sinai Peninsula. A GIS-based suitability model was developed using Analytical Hierarchy Process (AHP) according to sustainable development method for identifying and mapping land suitable zones for urban development. Five sub-models were implemented representing, land stability, land resources, cost of construction, accessibility, and land protection using 38
Spatial Multicriteria Analysis (SMCA) and fed to the final suitability model. (Figure 14.a ) and ( Figure 14.c) . (Shaker and Salah,2015) investigated the site suitability for urban development’s in Sinai Peninsula using multi-criteria analysis. Weighted multi-criteria analysis approach has been applied to integrate different data sources. These data sources include: geological data; slope percent; received flow rate; rain ratio; and water accessibility. The most suitable sites for urban development in Sinai Peninsula amounted to be 37% of total area. ( Figure 14.b )and( Figure 14.d) .
Figure13. Suitability map for industrialization (Source :Johar et al. ,2013).
Figure 14.a Flowchart of methodology ( Source : Effat and Hegazy,2013). 39
Figure14. b Flowchart of methodology . ( Source : Shaker and Salah,2015)
Figure14. c. Suitability map for urbanization in Sinai Peninsula. ( Source :Effat and Hegazy,2013)
40
Figure14. d Suitability map for urbanization in Sinai Peninsula. ( Source : Shaker and Salah,2015)
In my opinion, site selection is a hot research topic. The majority of researches are concerned with urban, industrial and touristic site selection. Although progress has been made, it is evident that no robust general solution for the problem has yet been implemented. The various approaches can be characterized along several axes, including, the features used as algorithm inputs, the type of data used, and the types of features or ancillary data incorporated, different criteria or parameters used as the models inputs, the established weight. Land suitability maps help decision makers in urban planning.
3.1.4.Land cover mapping (Makinde et al., 2016) compared spectral angle mapper and object-based classification approaches for classifying RapidEye image acquired over Eti-Osa LGA, Lagos, Nigeria. The overall accuracy of spectral angle mapper was 86.64% while the overall accuracy of object-based classification was increased to 94.47%. Liao et al. (2014 ) proposed a fusion of pixel based and object based features for classification of urban hyperspectral remote sensing data. The proposed approach merge full advantage of both the pixel and object based features using the fusion graph. The results of urban hyperspectral image classification were promising. (Mhangara and Odindi,2013) used object-based Haralick textural measures classification to create land-cover maps from multispectral aerial photographs. Firstly Grey-level cooccurrence matrix (GLCM) was used to extract texture features (Entropy, Mean and Angular Second Moment texture measures). Then rule based object classification was performed. A comparison was made between results from object-based classification and results from spectral classification. Results demonstrated that use of both Haralick textural measures and the spectral information of multispectral aerial photographs provides better classification accuracy (Figure 15). Wojtaszek and Ronczyk (2012) used WorldView2 images in conjunction with object-based classification for classification of urban area of Székesfehérvár city. eCognition software was utilized for object-based classification. The most consistent and relevant characteristic of buildings is their elevation. Therefore elevation data (converted from LIDAR data) are used for building extraction, segmentation and classification. The object-based classification is divided into six steps: data pre processing, development of rule set, image segmentation, the detection of land cover classes, rule set based classification and accuracy assessment.
El-Ashmawy et al.,(2011) investigated and evaluated two different methods for land cover classification of LIDAR intensity data acquired over urban district in Burnaby, British Colombia, Canada. The first method was pixel-based classification (Maximum likelihood classifier) and the second method was object-based classification. Results demonstrated that LIDAR intensity data can be used for land cover classification. The overall accuracy of the Maximum likelihood classifier was 63.5% while that of object-based classification method yielded 68%. 41
Bhaskaran et al.,(2010) used a combined spectral and spatial information for urban features mapping especially those with low spectral separability. This research applied two techniques for urban features mapping from IKONOS imagery. The two techniques used were: a)supervised maximum likelihood used as pixel-based classification and b) objectbased classification. The IKONOS image was classified firstly using pixel-based supervised maximum likelihood classification (MLC) approach. It was found that white roof footprint was wrongly classified as gray roof footprint due to the spectral similarity. Object-based classification method was used for refinement of initially detected building. The result have shown that an improvement of this class. Yuan et al. (2009) compared maximum likelihood classification (MLC), Decision tree (DA) and two-modules of ANN classification (unsupervised SOM network module and a supervised MLP neural network), utilizing LANDSAT-TM image. The results have revealed that ANN classifications obtained the best overall accuracy.
Elshehaby and Taha (2009) compared three approaches for building detection based on maximum likelihood classification. The contributions of the individual features used in the classification have been investigated. A rule based expert system for building detection based on combination of classified image, height data, and spectral information was developed using knowledge engineer of ERDAS Imagine and used for refinement of initially detected building. The results have demonstrated that the use of expert system increased the classification accuracy. The overall accuracy of expert classification was 96% and kappa coefficient was 0.95.
Figure15. Part of classification maps, a. Ground truth, b. Spectral, c. OBIA, d. Sta, and e. Proposed method ( Source :Liao et al. 2014 ). (Hong and Anh, 2009) developed a technique to create a land cover map using fused TerraSAR-X and Spot 5 images. Three resolution merge techniques (Brovey, IHS and PCA) were used for merging TerraSAR-X and Spot 5 images that acquired over Binh Thuan area in Vietnam. The resulted pansharped images were classified using unsupervised classification method. Then, the classification results of pansharped images were compared to the SPOT5 classification and manually edited to establish land cover map( Figure 17).
42
Figure16. A multispectral RGB 432 aerial photo composite, (b) a feature land-use/landcover map using Haralick textural features and (c) a feature land-use/land-cover map using spectral characteristics. ( Source :Mhangara and Odindi,2013).
Figure17. Methodology (Source :Hong and Anh, 2009). In my opinion, Land cover mapping is a vital for urban planning. The majority of researches are concerned with comparison of different techniques, development of new techniques, combination of different techniques, improvement of classification accuracy. Although progress has been made, it is evident that no robust general solution for the problem has yet been implemented. The various approaches can be characterized along several axes, including, the type of data used, the features used as algorithm inputs and the types of features or ancillary data incorporated,
43
3.1.5. DEM extraction /3 D city models Stereo PAN satellite images have been used in various applications such as terrain modelling and topographic mapping (Shaker et al.,2008). Zhang et al.(2002) investigated the use of GEO Ikonos images for DSM generation. A DSM was generated using automatic image matching technique in the LHS DPW770 and VirtuoZo digital photogrammetric systems. Vozikis (2004) discussed an automated approach for generation and updating Digital City Models. A pair of panchromatic stereo images was used as input. This data can either be airborne images or spaceborne images (Quickbird ,IKONOS). Digital City Models (DCMs) comprise the topologic and geometric information of buildings of a certain area. There are a lots of applications for these models such as telecommunication, urban planning, City portals, location based services, emergency Services, tourism, environmental planning, transportation, virtual reality, cadaster, security services etc. The quality of the created DCM relies on the resolution and accuracy of the DSM that was used. Using large-scale airborne photogrammetry or laser scanner data to generate these surface models provides better results than using satellite Photogrammetry (spaceborne high-resolution stereo images).( Figure 18). Hannes et al.,(2008) created 3-D Model of castle Landenberg by using Unmanned Aerial Vehicle (UAV) images with terrestrial images. Close range photogrammetric processing was implemented. Visintini et al., (2007) suggested a technique to generate 3-D City model for the Gorizia downtown (Italy) by combining airborne LIDAR and terrestrial LIDAR surveying techniques with historical maps. Optech ALTM 3033 airborne LIDAR data and high resolution digital images acquired from Rollei DB44 digital camera were collected simultaneously. TerraScan (Terra Solid) software was utilized for producing 3-D building model. Terrestrial Laser scanner was used for fecades generation. Riegle LMS Z360i terrestrial Laser scanner and digital images from Nikon D100 Camera were acquired simultaneously. Topographic maps can also be generated from Digital Elevation Model (DEM)
44
Figure 18.a Proposed workflow of automated updating of DCMs ( Source : Vozikis, 2004 ).
Figure 18.b DSM normalisation ( Source : Vozikis, 2004 ) .
Figure18. c. DSM of a subset of the case Figure 18.d. Corresponding study over Nimes (France)
DCM with
( Source : extracted building information. ( Source :
Vozikis, 2004 ).
Vozikis, 2004 ). 45
In my opinion, DEM extraction /3 D city models are hot research topics in 3D feature extraction. There are many potential users for 3D databases, the problem being the cost of generating detailed and accurate scene descriptions. 3 D city models one of the most promising applications is urban planning which include the detailed representation of terrain, vegetation, and buildings.
3.1.6.Solar energy assessment
(Taha and Effat ,2014) carried out a study for estimation of photovoltaic potentiality over a flat buildings roofs in El Maadi district ,Cairo, Egypt using stereo World View images. LPS Digital photogrammetric workstation was utilized for automated extraction of a digital surface model (DSM) and true ortho-image from World view image. The DSM was fed to the model of the solar radiation. The area solar radiation grid was produced in watt hours per square meters for the year 2015 using the area solar radiation tool in ESRI ArcGIS to calculate the technical potential for solar PV electricity generation for each of the 265 buildings (Figure 19) .
Figure 19. a Work Flow for the Applied Figure19. b Solar PV Potentiality Methodology( Source :Taha and Effat ,2014) Map for the Five Classes of Roofs( Source :Taha and Effat ,2014)
46
In my opinion, solar energy estimation is a vital for urban planning. The majority of researches are concerned with assessment of PV potentiality using GIS models and height data, development of new techniques for obtaining height data such as LIDAR height will be promising and gives more accurate results.
evaluates photovoltaic (PV) potential of inhabited buildings in 3.1.7.Urban Growth / urban expansion / urban sprawl / Modeling Gandhi et al.,( 2016 ) Used SLUETH model to simulate future sprawl of Rajkot city, sprawl has been predicted for 2031. SLUETH model is spatially explicit cellular automata model. Input maps for the built up area used for five years, i.e, 1980, 1992, 2001, 2005, and 2011; input layer for roads three years 2001, 2005, and 2011, one exclusion layer, land use layer for two years 2005 and 2011, one slope layer and one hill shade layer. The results of SLEUTH showed that organic growth is predominant in Rajkot, which shows major growth would occurred along the fringes of existing settlement. SLEUTH model is 96.18% accurate matching urban pixels in the predicted urban area of 2011 and actual urban area identified from the satellite image for Rajkot city. Taha (2014) conducted a detailed land cover/ land use changes over Al-Monib island for the period between 2002 and 2009 by applying fuzzy classification. Six approaches for classifying SOPT5 and QuickBird images based on fuzzy method have been performed in order to improve urban land cover classification accuracy. Then fuzzy post classification comparison has been performed. The urban expansion value was 0.11 km2. The Percent distribution of built up area was increased by 3.04%. Also it was observed a reduction of agricultural lands by 8.29%. Lin et al ,(2005)explored modeling of urban sprawl and land use change using neural networks combined with geographic information systems (GIS) over Hilton Head Island, South Carolina( Figure 20).
47
Figure 20.a. Land Use Changes of Figure20.b Methodology Hilton Head Island ( Source :Lin et al :Gandhi et al., 2016 ). ,2005).
flow
chart
(Source
(Xiao et al., 2006) assessed urbanization trends over Shijiazhuang City, Hebei Province of China, by using remote sensing and Geographical Information Systems (GIS). The research studied the urban growth and land cover changes from 1987 to 2001 utilizing from two multitemporal Landsat images. Maximum Likelihood supervised classification approach, was used for classification ( Figure 21).
Figure 21.a. The land use and land cover Figure 21.b.The land use and land cover map of Shijiazhuang in 1987 (Source: Xiao map of Shijiazhuang in 2001 (Source: Xiao et al., 2006). et al., 2006). (Sharma et al.,2015) presented the entropy based approach for monitoring of urban sprawl using remote sensing and Geographic information techniques (Figure 22).
48
Figure22. a. Methodology of measuring urban sprawl (Source :Sharma et al.,2015)
Figure22.b. Urban sprawl (Source :Sharma et al.,2015).
Figure 22.c. Buffer zone around the study area 2001 built up area is shown in red color(Source :Sharma et al.,2015).
Figure22.d. Buffer zone around the study area 2011 built up area is shown in red color(Source :Sharma et al.,2015).
In my opinion, Urban Growth / urban expansion / urban sprawl / Modeling are a current research topics. The majority of researches of urban sprawl / Modeling are concerned with 49
change detection, the pattern of urbanization, the trend of urbanization and the urbanization metrics. Although progress has been made, it is evident that no robust general solution for the problem has yet been implemented. The various approaches can be characterized along several axes, including the degree of automation, the features used as algorithm inputs, the type of data used, and the types of features or ancillary data incorporated, the complexity of the scene, the required accuracy and the required outputs (only indicating changes or require from- to classes). There are a lot techniques of modelling sprawl such as cellular automata, neural network and regression analysis. The models require the input parameters and the parameters required for calibrating the model.
3.2.Land cover and tree species/ vegetation mapping (Jawak et al., 2015) used the canopy height model (CHM) for individual tree crown discrimination from LIDAR point cloud data in an urban region and assessed its accuracy by comparing the results with the results from visual analysis of fused WorldView-2 image (with 0.5 m spatial resolution). The accuracy of LIDAR-based tree features was 98 percent (Figure 23). Zhang and Xie( 2012) investigated the effectiveness of aerial hyperspectral image captured over Everglades from Airborne Visible/Infrared Imaging Spectrometer (AVIRIS) for vegetation mapping. Neural network classifier was developed and combined with the object-based texture feature in order to get an accurate method for vegetation delineation. The achieved overall classification accuracy was 94 percent and a kappa index was 0.94. It was found that combining object-based texture measures in the neural network classifier improves the classification accuracy compared to the conventional classifiers such as maximum likelihood and spectral angle mapper (Figure 24). Sasaki et al. ,(2011 ) tested the usefulness of incorporation of LIDAR ratio features with LIDAR data in the object-based classification for delineation of tree species.
Figure 23.a LIDAR point cloud data processing workflow (Source :Jawak et al., 2013).
50
Figure 23.b. 3D representation of extracted features (Source :Jawak et al., 2015).
Figure24. Flowchart of vegetation mapping in the Everglades from hyperspectral imagery(Source : Zhang and Xie, 2012). Corn crop stand density is vital for optimizing crop yield. Multitemporal airborne hyperspectral remote sensing images (three dates) were captured over central Iowa during the 2004 corn growing season. The spatial resolution of the image was 1 m and the spectral resolution of 3 nm and the wavelengths ranges from 498 nm to 855 nm. (Thorp et al., 2008) proposed a machine vision system for early season measurement of the corn crop stand 51
density. It was also used for mapping of every row of corn within the three dates, and a complete inventory of corn crop was generated. The relationships between plant stand density measurements and principal components of hyperspectral reflectance for each date was determined using principal component regression analysis, and at three different spatial resolutions (2, 6, and 10 m). It was found that the maximum R2 for regressions was 0.79. In my opinion, in this application various modern sensors were appeared such as hyperspectral data which is good in crops discrimination and LIDAR data which is good in estimating tree height. Multicue integration is promising.
3.3.Coastal applications 3.3.1.Shoreline extraction/mapping A shoreline can be defined as the line of contact between land and water surface. Shoreline extraction/mapping is useful for several coastal applications including, coastal zone mapping, coastal zone management, coastal environmental protection, coastal zone monitoring and safe navigation. Digitizing a feature such as the coastline is a very tedious and time-consuming process(Van and Binh 2008); (Ruiz et al. 2007). (El Gammal et al., 2010 ) used multitemporal Landsat imageries, collected at different years (1972, 1982, 1987, 2000, 2003 and 2008) to monitor shore line changes of the lake Nasser, Egypt and calculate it’s volume. ERDAS and ARC-GIS softwares were used for the images processing. Li et al.(2003) carried out a 3-D shoreline extraction using pan IKONOS stereo images acquired over Lake Erie coastal area. The results demonstrated that the accuracy of the extracted shoreline can estimated to be 2–4 meters( Figure 25).
Figure25. Matched shoreline points in first and second image ( Source: Li et al.,2003).
52
3.4. Coastal hazardous 3.4.1. Flood monitoring Shaker et al. ( 2008) evaluated the capability of PAN satellite imagery for flood hazard assessment of one of the high floods of the Nile River occurred in Year 1998. Various methods of digital image processing were evaluated for PAN image classification. The research used four different techniques for PAN image classification and flood hazard assessment: image interpretation, texture analysis, edge detection and pixel-based classification. Two PAN SPOT images acquired over a part of the Nile Valley in Egypt before and after the 1997/1998 Nile flood have been used. Two parametric classifiers ( Maximum Likelihood and Minimum Distance) and four nonparametric classifiers (Artificial Neutral Network, Contextual and Nearest Neighbour) were applied and compared to classify the two PAN images utilizing the same signatures then image subtraction was conducted to identify the flooding zones from the two classified results. The following data were fed to the classifiers (PAN imagery only, texture measure only, and incorporation of PAN and texture measure) the resulted accuracies were compared and the final computed flooding areas. The results demonstrated that Contextual Classifier on PAN imagery and Maximum Likelihood Classifier on texture feature give the nearest estimation of flooding areas (Figure 26).
Figure26 . Line features extracted from Canny Edge Detector (Source: Shaker et al. 2008).
3.4.2.Marine Oil spill control Remote sensing is important in various modes of oil spill control such as monitoring of specific site, large area surveillance and emergencies response and subsequent clean-up operations. Remote sensing is able to produce essential information to enhance strategic and tactical decision-making (Brekke and Solberg,2005) (Engelhardt, 1999). Topouzelis et al.,(2007) examined the capability of neural networks to identify dark formations in SAR images and to discriminate oil spills from lookalike phenomena 53
simultaneously. Two different types of neural networks were applied; one to detect dark formations and the second one to classify oil spills or look-alikes. The proposed approach is good in detecting dark formations and discrimination of oil spills from look-alikes. The overall classification accuracies were 94 percent for dark formations detection and 89 percent for discrimination of oil spills from look-alikes correctly of examined cases. In my opinion, coastal applications used change detection and change monitoring it depends on the type of the used data. Also various methods of producing DEM affect the accuracy of the extracted 3D information. SAR images are efficient for oil spill discrimination.
3.5. Environmental hazardous 3.5.1.Desertification hazard Land degradation problem in the arid areas of the world is called Desertification. Deterioration in soil and plant cover have adversely affected nearly 70 % of the dry lands Chabrillat et al,(2002). (Dhinwa et al.,2016) used two IRS-1C/1D images acquired over Bellary district of Karnataka state to produce the desertification/land degradation status map (DSM) for the two dates 2001 and 2011. These maps have been used for monitoring and assessing the desertification between the two years. As per the DSM maps of 2001and 2011, the land degradation area in the Bellary district has increased by 2.5%. The main land degradation processes active in Bellary district are vegetal degradation, water erosion, salinity/alkalinity and man- made (mining)( Figure 27). Chabrillat et al,(2002) derived Land Degradation Index (LDI) from hyperspectral remote sensing data.
Figure:27.a. Methodology for Desertification Status Mapping (DSM) ( Source : Dhinwa et al.,2016) 54
Figure:27.b. Land use/ land cover map of Bellary district ( Source : (Dhinwa et al.,2016)
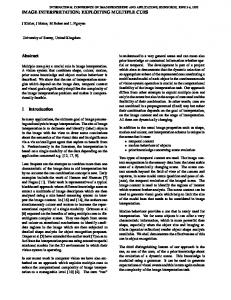
3.5.2.Forested areas ( Gutiérrez et al.,2012) conducted a study for combining object-based and pixel-based land cover classification. Landsat ETM images of a mountainous forested area in Mexico were used as input. The land cover classes determined based on both methods were extracted and merged into combined land cover classifications. A comparison of the overall classification accuracies of pixel-based, object-based and combined technique for the two years 1999 and 2006 respectively was found (0.74 and 0.81), (0.77 and 0.71) and (0.88 and 0.87) results show that the combined technique provides the best results. Post-classification comparison change detection carried out between the combined classifications of the two dates. It was observed that the combined classification technique together with the objectbased change detection analysis produces improvement in the classification and change detection accuracies. In my opinion, environmental applications used change detection and change monitoring it depends on the type of the used data. Also various methods of classifications were used as input for producing change maps.
55
Figure 28. Classified images using the object-based and pixel-based approaches and the final layers for the ‘combined classification method’ for the two years analyzed (Source : Gutiérrez et al.,2012).
4. Summary and conclusion The study covered some different applications of automatic image interpretation in surveying and photogrammetry. It presented recent developments, remaining challenges and promising directions. Generally speaking, most of such applications is critical in urban planning, land suitability and decision making processes. In the current state of art, the followings are deduced: Automatic image interpretation has made a significant advances in the studies of surveying and photogrammetry at various scales. New sensors such as LIDAR, hyperspectral and radar have been appeared. Various techniques of automatic image interpretation appeared such as image classification, texture analysis and edge detection. There is a wide range of classification inputs (data sources from different sensors). So that various classification methods have been proposed and applied to classify remotely sensed data. Each data type is suitable with some classifiers and some applications. Classical Spectral classification methods use spectral values and ignore spatial features on the other hand object based image analysis segments the image into multi-pixel object primitives according to both spatial and spectral features. These 56
spatial features are important when using high resolution images (fine resolution) in urban mapping.
LIDAR technology can be considered as a useful tool for surveying and processing of geospatial data. LIDAR is a mature remote sensing technology which can provide accurate elevation data for both topographic surfaces and above-ground objects. Moreover digital airborne stereo sensors are capable of producing DSM by automated techniques.
Researchers are continuously seeking to improve the classification accuracy through using different approaches such as image fusion, classifier ensample ,muticue integration(neural network or expert system) .
Automatic change detection is vital in rapid land use changes monitoring and managing where updating of information is tedious and time consuming using classical surveying and mapping techniques.
The irregular industrialization and urbanization in developing countries, has caused many environmental problems. Therefore, activities such as examining changes in land use for assessment, monitoring and emergency planning.
Urban planning and establishment of new cities, industries and site selection purposes are important applications for sustainable development.
At the end, a short presentation of some specific applications was given. Finally further investigations were encouraged.
57
5.My point of view New sensors such as LIDAR, hyperspectral and radar, airborne digital camera, UAV images have been appeared. New techniques of automatic image interpretation appeared such as image classification, texture analysis and edge detection have been appeared. Some techniques that suitable for a certain sensors (data) are not suitable for another. There are some techniques overcome the problem of other techniques. -Subpixel overcomes the problem of mixed pixels. -Object based (spatial ,spectral ) overcomes the problem of spectral similarity . (multi cue integration) -Artificial intelligance techniques( ANN, Expert system ) were appeared. (multi cue integration)
Technology transfer of the current applications from other countries to mine for solving the current problem in Egypt should be done. There are some sensors have constrained in Egypt or required some permission from (military authorities ) such as UAV images There are Some sensors when we buy it in Egypt we find that they have a spy softwares to transfer the data or they use it for spying purposes ( cover the airport) The automatic methods are better in large area but for small areas manual methods are preferred. The automatic methods save time and cost. The automatic methods need manual editting. The type of data changes with the required application. In Egypt the more interest for the availability of data not the more suitable data. Although sensors that depend on direct georefrencing are fast methods for acquisition on other countries because it use a little ground control points, in Egypt it takes long time for getting permission and elimination of military objects. The type of land cover complexity effect on the used methods for example for the urban area of high buildings we use true orthorectification not orthorectification only (use DSM that contain building height not DEM that contain terrain height only . In Egypt we prefer any open source data - (sentinal images medium Resolution. Also Landsat 8 Images( visible ,IR, Thermal). -from SAS planet or Google earth (very high resolution images) Only RGB images there are no IR image -In Egypt we prefer any open source sofware such as Polsarpro The accuracy of the automatic technique is important, so that improvement of classification accuracy methods is required and active research topic. 58
Acknowledgements The editing and comments of the reviewers is gratefully appreciated
References 1-Baboo S.S. and Devi M.R,2011 ’’Geometric Correction in Recent High Resolution Satellite Imagery: A Case Study in Coimbatore, Tamil Nadu ‘’International Journal of Computer Applications (0975 – 8887 Volume 14– No.1, January 2011 2-Berberoglu, S., & Akin, A. ,2009’’ Assessing different remote sensing techniques to detect land use/cover changes in the eastern Mediterranean.’’ International Journal of Applied Earth Observation and Geoinformation, 11(1), 46–53 3-Bernard, A.C., Wilkinson, G.G., and Kanellopoulos, I., 1997“Training for neural network soft classification of remotely sensed imagery “International Journal of Remote Sensing, Vol. 18, No. 8, pp.1851-1856, 1997. 4- Bharti R. and Kurmi J. , 2017 ‘’A Survey of Satellite High Resolution Image Classification’’International Journal of Computer Applications (0975 – 8887) Volume 164 – No 1, April 2017 5-Bhaskaran S., Paramananda S., Ramnarayan M. 2010’’ Per-pixel and object-oriented classification methods for mapping urban features using Ikonos satellite data’’ Applied Geography 30 (2010) 650–665 6-Bigdeli B. ,Samadzadegan F. &Reinartz P.A,2013‘’Multiple SVM System for Classification of Hyperspectral’’ Remote Sensing Data J Indian Soc Remote Sens (December 2013) 41(4):763–776DOI 10.1007/s12524-013- 0286-z 7-Brekke C. and Solberg A. H.S.,2005 "Oil spill detection by satellite remote sensing" Remote Sensing of Environment 95 (2005) 1 –13 8- Brennan R. and Webster T.L.,2006‘’Object-oriented land cover classification of lidarderived surfaces’’ Can. J. Remote Sensing, Vol. 32, No. 2, pp. 162–172, 2006 9- Chabrillat S., Kaufmann H., Hill J., Mueller A., Merz B., Echtler H. ,2002‘’Research opportunities for studying land degradation with spectroscopic techniques’’
59
10- Chu H.T., GE L. and Cholathat R.,2012 ‘’Evaluation of Multiple Classifier Combination Techniques Forland Cover Classification Using Multisource Remote Sensing Data” The 33 th Asian conference on remote sensing Nov 26-30 2012,Thailand. 11-Colwell R.N., 1997’’ Manual of Photographic Interpretation’’, American Society for Photogrammetry & Remote Sensing 12- Dabboor, M. ,2011 ‘’New segmentation algorithms for dual and full polarimetric SAR Data.’’ Ph.D. thesis, Department of Geomatics Engineering, Schulich School of Engineering, University of Calgary URL:http://www.geomatics.ucalgary.ca/graduatetheses. 13-Dekker R. ,2000 ‘’Monitoring the urbanization of Dar Es Salaam using ERS SAR data.’’ International Archives of Photogrammetry and Remote Sensing, Vol.XXXΙΙΙ, part B1, Amsterdam 14-Dhinwa P.S., Dasgupta A. and Ajai3,2016 ‘’Monitoring and assessment of desertification using satellite remote sensing’’ Journal of Geomatics Vol 10 No. 2 October 2016 15-Doma M.L.,Gomaa M.S. and Amer R.A. , 2015 ‘’Sensitivity of pixel based classifiers to training sample size in case of high resolution satellite imagery’’ Journal of Geomatics Vol.9 No.1 April 2015 16- Du P., Li G., Zhang W., Wang X., and Sun H.,2009 “Consistency measure of multiple classifiers for land cover classification by remote sensing image,” in Multiple Classifier Systems, pp. 398–407, Springer, 2009. 17- Effat H. A., Hegazy M. N.,2013 ‘’A Multidisciplinary Approach to Mapping Potential Urban Development Zones in Sinai Peninsula, Egypt Using Remote Sensing and GIS’’ Journal of Geographic Information System, 2013, 5, 567-583 Scientific research -Published Online December 2013 (http://www.scirp.org/journal/jgis) 18- El-Ashmawy N. , Shaker A. , Yan W. Y. ,2011 ‘’Pixel VS Object-Based Image Classification Techniques for LIDAR Intensity Data’’ International Archives of the Photogrammetry, Remote Sensing and Spatial Information Sciences, Volume XXXVIII5/W12, 2011 ISPRS Calgary 2011 Workshop, 29-31 August 2011, Calgary, Canada 19-El Gammal E. A., 2010’’ Assessment Lake Nasser Egypt Within The Climatic Change’’Journal of American Science2010;6(7) 20- ElSharkawy A.R., Mostafa A. E.A., L. G.Taha, Rana Rezq Mahmoud R. R., 2016 “Merging SAR and Egyptsat Images for Improvement Roads Network Extraction” Engineering Research Journal 151 (Sep 2016) C1- C24 Helwan university 60
21- Elshehaby A. R., Taha L.G.and Ramzi A. I. ,2013’’Automatic Road Network Extraction Based on Spectral Angler Mapper’’ International Journal of Circuits, Systems and Signal Processing Issue 5, Volume 7, 2013 22-Elshehaby A.R. and Taha L.G.,2009 ‘’A new expert system module for building detection in urban areas using spectral information and LIDAR data’’ Applied Geomatics DOI 10.1007/s12518-009-0013-1 23- Engelhardt F. R.,1999 "Remote sensing for oil spill detection and response" Pure Appl. Chem., Vol. 71, No. 1, pp. 103–111, 1999. Printed in Great Britain. q 1999 IUPAC 24-Estabillo M. S. P. and Tamondong A. M.,2015 ‘’A Multi-scale Approach for Benthic Habitat Mapping of Shallow Water Region of Guiuan, Eastern Samar using A 4-Band High Resolution Worldview-2 Satellite Image using Object-Based Image Analysis’’36th Asian Conference on Remote Sensing Philippines2015 25-Foody, G.M ,1996“Approaches for the production and evaluation of fuzzy land cover classification from remotely-sensed data.” International Journal of Remote Sensing, No. 7, pp. 1317-1340., 1996 26-Gandhi S. R, Sharma S.A. and Vyas A.,2015 ‘’Urban growth analysis using Shannon entropy –A case study of Rajkot city(Gujarat)’’ Vol 9 No. 1 April 2015 Journal of Geomatics 27-Gandhi S. R, Sharma S.A. and Vyas A.,2016 ‘’Predicting urban sprawl for Rajkot city using SLEUTH model and GIS techniques’’ Vol 10 No. 2 October 2016 Journal of Geomatics 28-Gungor O, Shan J ,2006 ‘’An optimal fusion approach for optical and SAR images.’’ ISPRS Commission VII Mid-term Symposium “Remote Sensing: From Pixels to Processes”, Enschede, the Netherlands, 8–11 May2006 29- Gutiérrez J. A. , Seijmonsbergen A. C., Duivenvoorden J. F.,2012 ‘’ Optimizing land cover classification accuracy for change detection, a combined pixel-based and objectbased approach in a mountainous area in Mexico’’ Applied Geography 34 (2012) 29-37 30-Hannes p., Martin S., Henri E., 2008,“A 3-D Model of castle landenberg (CH) from combined photogrammetric processing of terrestrial and UAV based images”, International Archives of the Photogrammetry, Remote Sensing and Spatial Information Sciences, 37, 93-98 31-Hernando A., Tiede D., Albrecht F., Lang S., García-Abril A.,2012 ‘’Novel parameters for evaluating the spatial and thematic accuracy of land cover maps ‘’,Proceedings of the 4th GEOBIA, May 7-9, 2012 - Rio de Janeiro - Brazil. p.613
61
32- Herold M., Roberts D. A., Gardner M. E., and Dennison P. E.,2004 “Spectrometry for urban area remote sensing development and analysis of a spectral library from 350 to 2400 nm,” Remote Sensing of Environment, vol. 91, no. 3, pp. 304–319, 2004. 33-Hong H.T. and Anh T.V. , 2009’’ Combination of Microwave and Optical Remote Sensing in Land Cover Mapping 7th FIG Regional Conference Spatial Data Serving People: Land Governance and the Environment – Building the Capacity Hanoi, Vietnam, 19-22 October 20 34-Hu X., Zhang Z., Duan Y., Zhang Y., Zhu J., and Long H.,2011 "LIDAR photogrammetry and its data organization" International Archives of the Photogrammetry, Remote Sensing and Spatial Information Sciences, vol. XXXVIII-5/W12, 2011 [Workshop, Calgary, Canada, 2011]. 35- Jain M., Tomar P.S.,2013 "Review of Image Classification Methods and Techniques"International Journal of Engineering Research & Technology (IJERT) Vol. 2 Issue 8, August – 2013 IJERTIJERT ISSN: 2278-0181 36-Jawak S. D., Devliya P. , Luis A. J. ,2015”A Comprehensive Review on Pixel Oriented and Object Oriented Methods for Information Extraction from Remotely Sensed Satellite Images with a Special Emphasis on Cryospheric Applications” Advances in Remote Sensing, 2015, 4, 177-195 Published Online September 2015 in SciRes. http://www.scirp.org/journal/ars http://dx.doi.org/10.4236/ars.2015.43015 37-Jensen JR ,2005 ‘’Introductory digital image processing a remote sensing perspective’’, 3rd edn. Pearson Prentice Hall, Upper Saddle River 38-Jia Y. ,2015 ‘’Object-based Land Cover Classification with Orthophoto and LIDAR Data’’ Master of Science Thesis in Geoinformatics TRITA-GIT EX 15-001 School of Architecture and the Built Environment Royal Institute of Technology (KTH )Stockholm, Sweden 39- Johar A., Jain S.S. and Garg P.K.,2013 ‘’Land suitability analysis for industrial development using GIS’’ Vol.7 No.2 October 2013 Journal of Geomatics 40-Jumlesha S.K., Sk K. B. , Satyanarayana C. , Srinivas M. N. , Ramanaiah M.V., Kumar S. P.,2012 ‘’Automatic Urban Feature Extraction Using Mathematical Morphology’’ International Journal of Engineering Research and Applications (IJERA) ISSN: 22489622 www.ijera.com Vol. 2, Issue 3, May- Jun 2012, pp.221-225 41-Kadhim N. M.M., Mourshed M., Bray M.,2015 ‘’Automatic Extraction of Urban Structures Based on Shadow Information From Satellite Imagery’’ 14th Conference of International Building Performance Simulation Association, Hyderabad, India, Dec. 7-9, 2015. 62
42-Kanniah K. D., Wai N. S., Shin A. L.M. and Rasib A. W.,2007 " Per-pixel and sub-pixel classifications of High-resolution Satellite Data for Mangrove Species Mapping "Applied GIS Volume 3, Number 8 August, 2007 ISSN: 1832-5505 43-Ke Y., Quackenbush L. J. and Im J.,2010 ‘’Synergistic use of QuickBird multispectral imagery and LIDAR data for object-based forest species classification’’ Remote Sensing of Environment 114 (2010) 1141–1154 44-Kumar G. R. H. and Singh D. , 2010 "Quality assessment of fused image of MODIS and PALSAR" Progress In Electromagnetics Research B, Vol. 24, 191-221. 45- Li M., Zang S., Zhang B., Li S. and Wu C. A,2014‘’ Review of Remote Sensing Image Classification Techniques: the Role of Spatio-contextual Information‘’ European Journal of Remote Sensing - 2014, 47: 389-411 doi: 10.5721/EuJRS20144723
46-Li C. , Sun T., Kelly K. , and Zhang Y.,2012 "A compressive sensing and unmixing scheme for typerspectral data processing "IEEE Transactions on Image Processing, Vol. 21, No. 3, March 2012 47- Li J. J . , Li Y. and Chapman M. A., 2005 ‘’Building edge extraction from LiDAR based on jump detection in non-parameter regression model," in Proc. 2005. Available:’’www.isprs.org/proceedings/XXXVI/5-C55/papers/jun_li.pdf 48-Li R. Di K. and Ma R.,2003 ‘’3-D Shoreline Extraction from IKONOS Satellite Imagery’’ Marine Geodesy, 26:107–115, 2003 49- Liao W. , Coillie F. V., Devriendt F. , Gautama S. , Pizurica A., Philips W. ,2014 ‘’Fusion of pixel based and object based features for classification of urban hyperspectral remote sensing data SouthEastern European’’ Journal of Earth Observation and Geomatics Vo3, No2S, 2014 50- Liu X. , Zhang Z. , Peterson J. and Shobhit Chandra ,2007 ‘’LiDAR-Derived High Quality Ground Control Information and DEM for Image Orthorectification’’ Geoinformatica (2007) 11:37–53 51-Lin H., Lu K., Espey M. and Allen J.,2005’’ Modeling Urban Sprawl and Land Use Change in A Coastal Area–A Neural Network Approach’’ American Agricultural Economics Association Annual Meeting, Providence, Rhode Island,July 24 -27, 2005
63
52-Lu D. and Weng Q.,2007 "A survey of image classification methods and techniques for improving classification performance" International Journal of Remote Sensing Vol. 28, No. 5, 10 March 2007, 823–870 53- Lv Zh., Zhang P. and Benediktsson J. A.,2017 "Automatic Object-Oriented, SpectralSpatial Feature Extraction Driven by Tobler’s First Law of Geography for Very High Resolution Aerial Imagery Classification"Remote Sens. 2017, 9, 285; doi:10.3390/rs9030285 54-Maini R. and Aggarwal H.,2015 ‘’Study and Comparison of Various Image Edge Detection Techniques ‘’International Journal of Image Processing (IJIP), Volume (3) : Issue (1) 55-Mhangara P. and Odindi J. ,2013‘’Potential of texture-based classification in urban landscapes using multispectral aerial photos’’ South African Journal of Science Volume 109 | Number 3/4 March/April 2013 56-Mag-usara A. J. T. and Japitana, M.V.,2015 ‘’Change Detection of Forest Areas using Object-Based Image Analysis (OBIA): the Case of Carrascal, Surigao del sur, Philippines’’36th Asian Conference on Remote Sensing Philippines2015 57-Makinde E. O., Salami A. T., Olaleye J. B., Okewusi O. C.,2016 ‘’Object Based and Pixel Based Classification using Rapideye Satellite Imagery of Eti-Osa, Lagos, Nigeria’’Geoinformatics FCE CTU 15(2), 2016, doi:10.14311/gi.15.2.5 58-Makinde E. O., Salami A. T. , Olaleye J. B., Okewusi O. C.,2016 ‘’Object Based and Pixel Based Classification using Rapideye Satellite Imagery of Eti-Osa, Lagos, Nigeria’’ Geoinformatics FCE CTU 15(2), 2016, doi:10.14311/gi.15.2.5
59-Mishra, P. and D. Singh,2011’’Land cover classification of PALSAR images by knowledge based decision tree classifier and supervised classifiers based on SAR observables’’ Progress in Electromagnetics Research B, Vol. 30, 47-70. 60-Moreira, A., P. Prats-Iraola, M. Younis, G. Krieger, I. Hajnsek and K.P. Papathanassiou ,2013’’ A tutorial on synthetic aperture radar’’. IEEE Geoscience and remote sensing magazine, March 2013, 6-43. 61-Moreno A. J. and Larriva J.E. ,2012 ‘’Comparison between new digital image classification methods and traditional methods for land cover mapping’’ Remote sensing of land use and Land cover Edited by Giri C.P. CRC press Taylor & fransis
64
62- Morgan J. L., Gergel S. E., and Coops N. C.,2010 "Aerial Photography: A Rapidly Evolving Tool for Ecological Management" BioScience January 2010 / Vol. 60 No. 160: 47– 59. ISSN 0006-3568, electronic ISSN 1525-3244. 63-Mohanta R. K. and Sethi B. ,2007’’ A Review of Genetic Algorithm application for Image Segmentation’’Int.J.Computer Technology & Applications,Vol 3 (2), 720723ISSN:2229-6093 64- Nath S.S. , Kar j., Mishra G. ,Chakraborty S. and Dey N.,2014 ’’ A Survey Of Image Classification Methods and Techniques’’ 2014 International Conference on Control, Instrumentation, Communication and Computational Technologies (ICCICCT) 65-Navalgund R. R., Jayaraman V. and Roy P. S., 2007 " Remote sensing applications: An overview" Current Science, VOL. 93, NO. 12, 25 December 2007 66-Ok A.O., Senaras C. and Yuksel B.,2013 ‘’Automated Detection of Arbitrarily Shaped Buildings in Complex Environments From Monocular VHR Optical Satellite Imagery’’ IEEE Transactions on Geoscience and Remote Sensing · March 2013 DOI: 10.1109/TGRS.2012.2207123 67-Ponnusamy R., Sathyamoorthy S. and Manikandan K. ,2017 ‘’A Review of Image Classification Approaches and Techniques’’ International Journal of Recent Trends in Engineering & Research (IJRTER)Volume 03, Issue 03; March -2017[ISSN: 2455 -1457] 68-Qi, Z., A.G. Yeh, X. Li and Z. Lin ,2010’’ Land use and land cover classification using RADARSAT-2 polarimetric SAR image’’ ISPRS TC VII Symposium – 100 Years ISPRS, Vienna, Austria, July 5–7, 2010,IAPRS, Vol. XXXVIII, Part 7A. 69-Rao, K.G., Chand, P.P., and M.V. Ram ,2007 “Soft computing-neural networks ensembles” Journal of Theoretical and Applied Information Technology Vol. 3, No. 4, 2007. 70-Rhinane H. , Hilali A., Berrada A. , Hakdaoui M.,2011 ‘’Detecting Slums from SPOT Data in Casablanca Morocco Using an Object Based Approach ‘’Journal of Geographic Information System, 2011, 3, 217-224 doi:10.4236/jgis.2011.33018 Published Online July 2011 (http://www.SciRP.org/journal/jgis) 71- Rottensteiner F., and Briese C.,2002 “A new method for building extraction in urban areas from high-resolution LIDAR data” Commission III, WG III/3 ISPRS 2002 http://www.isprs.org/commission3/proceedings02/papers/ paper082.pdf 72-Ruiz LA, Pardo JE, Almonacid J, Rodrguez B ,2007’’ Coast line automated detection and multiresolution evaluation using satellite images’’ Proceedings of Coastal Zone 07 Portland, Oregon July 22 to 26 65
73-Salah M., TrinderJ.C.,ShakerA., HamedM., ElsagheerA.,2010’’Integrating Multiple Classifiers With Fuzzy Majority Voting for Improved Land Cover Classification In: Paparoditis ‘’N., Pierrot- Deseilligny M., Mallet C., Tournaire O. (Eds), IAPRS, Vol. XXXVIII, Part 3A – Saint-Mandé, France, September 1-3, 2010 74-Sasaki T. , Imanishi J., Ioki K., Morimoto Y. and Kitada K.,2011’’ Object-based classification of land cover and tree species by integrating airborne LiDAR and high spatial resolution imagery data’’ Landscape Ecol Eng 14 April 2011 Springer 75- Shaker A. , Yan W.Y., Wong M.S., El-Ashmawy N., Alhaddad B. I.,2008 ‘’ Flood Hazard Assessment Using Panchromatic Satellite Imagery’’ The International Archives of the Photogrammetry, Remote Sensing and Spatial Information Sciences. Vol. XXXVII. Part B7. Beijing 2008 76-Shaker A. and Salah M. ‘’Towards a good urban development plan in Sinai through land site suitability maps ‘’Regional Conference on Surveying & Development Sharm ElSheikh, Egypt, 3-6 October 2015 77- Sharma C.S. · Behera M. D. Mishra A. , Panda S. N. ,2011“Assessing Flood Induced Land-Cover Changes Using Remote Sensing and Fuzzy Approach in Eastern Gujarat (India) ‘’Water Resour Manage (2011) 25:3219–3246 DOI 10.1007/s11269-011-9853-7 78-Singhal S. and Radhika S. , 2014 ‘’Automatic Detection of Buildings from Aerial Images Using Color Invariant Features and Canny Edge Detection ‘’ International Journal of Engineering Trends and Technology (IJETT) – Volume1 1 Number 8-May 2014 79-Sohn G. and Dowman I. ,2006 ‘’Data fusion of high-resolution satellite imagery and LiDAR data for automatic building extraction’’ ISPRS Journal of Photogrammetry & Remote Sensing 62 (2007) 43–63 Published by Elsevier B.V. 80- Sun N., Zhang J. X., Huang G. M., Zhao Z. and Lu L. J.,2014 ’’Review of Road Extraction Methods from SAR Image’’ IOP Conf. Series: Earth and Environmental Science 17(2014) 012245doi:10.1088/1755-1315/17/1/012245- 35th International Symposium on Remote Sensing of Environment (ISRSE35) IOP Publishing 81- Taha L. G. and Bedawi S. M. ,2012 “New automatic building detection and extraction software based on Swarm intelligence based classification of LIDAR point clouds &combination of digital camera images and Lidar DSM“Engineering research journal faculty of Engineering at Shoubra VOL NO.(17) july2012
66
82- Taha L. G. and Sharawi A.,2014 ‘’Assessment of Urban Feature Extraction from SPOT5 Image “CERM civil engineering research magazine Journal(Al-Azhar universityEgypt) April-2014 83- Taha L. G. and Sharawi A.,2017’’Urban Land Cover From GF-2 Satellite Images Using Object Based &Neural Network Classifications’’ Submitted paper to ICGE 2018: 20th International Conference on Geomatics Engineering Istanbul, Turkey August 16 - 17, 2018 84-Taha L. G. and Shahin A. A.,2014’’ Improvement of SAM Land cover classification of airborne hyperspectral data using expert system’’ Open Journal OF Remote Sensing and Positioning Volume 1, Number 1, June 2014 85-Taha L. G. and Shahin A. A.,2014’’Assessment of large scale urban mapping from airborne hyperspectral data based on SVM and ANN’’ International Journal of Neural Networks and Advanced Applications Volume 1, 2014 86- Taha L. G.and Effat H. A. ,2015 ‘’GIS-Based Estimation of Potential Solar Energy on Flat Roofs in Maadi, Cairo, using True Ortho World View Image and Digital Surface Model’’ Cloud Publications International Journal of Advanced Remote Sensing and GIS 2015, Volume 4, Issue 1, pp. 1092-1108, Article ID Tech-422 ISSN 2320 – 0243 87- Taha L.G.,2012 “Improving Automatic Feature Detection from LIDAR Intensity by Integration of LIDAR Height Data and True Orthoimage from Digital Camera “International Journal of Circuits, Systems and Signal Processing Issue 3, Volume 6, 2012 NAUN Journal ISSN: 1998-4464 88-Taha L.G.,2014 ‘’ Assessment of urbanization encroachment over Al-Monib island using fuzzy post classification comparison and urbanization metrics’’ National Authority for Remote Sensing and Space Sciences -The Egyptian Journal of Remote Sensing and Space Sciences 89- Trimble,2015 ‘’Trimble presentation” 90-Thiel C.and Schmullius C. ,2016’’ Comparison of UAV photograph-based and airborne lidar-based point clouds over forest from a forestry application perspective’’ International Journal of Remote Sensing ISSN: 0143-1161 (Print) 1366-5901 (Online) Journal homepage: http://www.tandfonline.com/loi/tres20 91-Thorp K.R., StewardB.L. , Kaleita A.L. and Batchelor W.D.,2008’’ Using Aerial Hyperspectral Remote SensingImagery to Estimate Corn Plant Stand Density’’ This article is available at Iowa State University Digital Repository: http://lib.dr.iastate.edu/abe_eng_pubs/15- Agricultural and Biosystems Engineering
67
92-Topouzelis K., Karathanassi V., Pavlakis P., Rokos D.,2007 ‘’Detection and discrimination between oil spills and look-alike phenomena through neural networks’’ ISPRS Journal of Photogrammetry & Remote Sensing 62 (2007) 264–270 93- Tuominen J., Lipping T., and Oy P., 2011 ‘’Detection of environmental change using hyperspectral remote sensing at Olkiluoto repository site’’. Posiva Oy, 2011. 94-Van TT, Binh TT ,2008’’ Shoreline change detection to serve sustainable management of coastal zone in cu long estuary.’’ International Symposium on Geoinformatics for Spatial Infrastructure Development in Earth and Allied Sciences 95-Vozikis G.,2004 ‘’Urban Data Collection: an Automated Approach in Remote Sensing ‘’Application of High Resolution Remote Sensing Data – Part III -Chapter 2 96-Visintini D., Guerra F., Adami A., Vernie P., 2007, “A 3D Virtual model of the Gorizia downtown (Italy) by matching historical maps with aerial and terrestrial surveying techniques”, e-Perimetron, Vol. 2, No. 3, 117-133. 97- WalterV. ,2004 ‘’Object-based evaluation of LIDAR and multispectral data for automatic change detection in GIS databases’’www.isprs.org/proceedings/XXXV/congress/comm2/papers/222.pdf
98-Wang L. , Sousa W. P., Gong P. and Biging G. S.,2004 " Comparison of IKONOS and QuickBird Images for Mapping Mangrove Species on the Caribbean Coast of Panama" Remote Sensing of Environment 91 (2004) 432–440 99- Wang, C. K. and Hsu P.H.,2008 ‘’ Building detection and structure line extraction from airborne LIDAR DATA,’’ The International Archives of the Photogrammetry, Remote Sensing and Spatial Information Sciences. vol. XXXVII, Part B3b, 2008. 100-Weih R. C. , Norman D. R.,2010‘’Object-Based Classification VS. Pixel-Based Classification: Comparitive Importance of Multi-Resolution Imagery’’ The International Archives of the Photogrammetry, Remote Sensing and Spatial Information Sciences, Vol. XXXVIII-4/C7 101-Whiteside T. and Ahmad W. ,2005 ‘’A comparison of Object-Oriented and PixelBased Classification Methods for Mapping Land Cover in Northern AUSTRALIA’’ Proceedings of SSC2005 Spatial intelligence, innovation and praxis: The national biennial Conference of the Spatial Sciences Institute 102- Widyaningruma E. , Fajaria M., Octariady J.,2016 ‘’Accuracy Comparison of VHR Systematic-Ortho Satellite Imageries Against VHR Orthorectified Imageries Using GCP’’ The International Archives of the Photogrammetry, Remote Sensing and Spatial 68
Information Sciences, Volume XLI-B1, 2016 XXIII ISPRS Congress, 12–19 July 2016, Prague, Czech Republic 103- Wojtaszek M. V. and Ronczyk L.,2012 ‘’Object-based Classification of Urban Land Cover Extraction Using High Spatial Resolution Imagery’’ International Scientific Conference on Sustainable Development & Ecological Footprint March 26-27 2012 Sopron, Hungary 104- World wide web,2017 ‘’World wide web’’ 105- Xiao J., Shen Y. , Ge J. , Tateishi R., Tang C. , Liangd Y., Huang Z. ,2006 ‘’Evaluating urban expansion and land use change in Shijiazhuang, China, by using GIS and remote sensing’’ Landscape and Urban Planning 75 (2006) 69–80 106-Yadav S., Rizvi I. , Kadam S.,2015 ‘’Comparative study of object based image analysis on high resolution satellite images for urban development’’ International Journal of Technical Research and Applications e-ISSN: 2320-8163,www.ijtra.com Special Issue 31(September, 2015), PP. 105-110 107- Yakhdani F. M. and Azizi A.,2010 " Quality assessment of image fusion techniques for multisensor high resolution satellite images (case study: IRS-P5 and IRS-P6 satellite images) "ISPRS TC VII Symposium – 100 Years ISPRS, Vienna, Austria, July 5–7, 2010, IAPRS, Vol. XXXVIII, Part 7B. 108- Yan W.Y. , Shaker A. and El-Ashmawy N. ,2017’’ Urban land cover classification using airborne LiDAR data: A review’’ Remote Sensing of Environment · March 2015 DOI: 10.1016/j.rse.2014.11.001 109-Yan W. Y., Morsy S., Shaker A. and Tulloch M.,2015 ‘’Automatic extraction of highway light poles and towers from mobile LiDAR data’’ Optics & Laser Technology September 12, 2015 110-Yi Luo b.d, Stefan Wunderle ,2009” Impact of orthorectification and spatial sampling on maximum NDVI composite data in mountain regions “Remote Sensing of Environment 113 (2009) 2701–2712
111-Young F, Benyi C, Wensong H, Hong C ,2000’’ DEM generation from Multisensor SAR images.’’ International Archives of Photogrammetry and Remote Sensing vol.XXXΙΙΙ, part B1, Amsterda 112-Yu Q., Gong P., Clinton N., Biging G., Kelly M., 2006 and Schirokauer D. ‘’Objectbased Detailed Vegetation Classification with Airborne High Spatial Resolution Remote Sensing Imagery’’ Photogrammetric Engineering and Remote Sensing · July 2006 -DOI: 10.14358/PERS.72.7.799 69
113-Yuan, H., Van der Wiele, C. F., & Khorram, S. ,2009 ’’ An automated artificial neural network system for land use/land cover classification from Landsat TM imagery’’ Remote Sensing, 1(3),243–265 114-Yuan F. and Bauer M. E. ,2006’’Mapping Impervious Surface Area Using High Resolution Imagery: A Comparison of Object-Based and Per Pixel Classification’’ASPRS 2006 Annual Conference Reno, Nevada - May 1-5, 2006 115-Zhang C., Xie Z.,2012 ‘’Combining object-based texture measures with a neural network for vegetation mapping in the Everglades from hyperspectral imagery’’ Remote Sensing of Environment 124 (2012) 310–320 116-Zhang L. , Pateraki M., Baltsavias E.,2002 ‘’Matching of Ikonos Stereo and Multitemporal GEO Images for DSM Generation’’ 117- Zhou M. , Xia B., Sua G., Tang L., and Lia C. ,2008 ‘’Study on the target feature extraction from LiDAR point clouds,’’ The International Archives of the Photogrammetry, Remote Sensing and Spatial Information Sciences. vol. XXXVII. part B3b. 2008. 118- Zou X. and Li D. ,2009 ‘’Application of Image Texture Analysis to Improve Land Cover Classification’’ WSEAS TRANSACTIONS on COMPUTERS Issue 3, Volume 8, March 2009 ISSN: 1109-2750 119-Zyl, A.V. and Y. Kim ,2011’’ Synthetic aperture radar polarimetry’’ Wiley Publication.
70