more bandwidth for each job, without wasting resources. Their mechanism allows ... achieved. We created a custom, optimized MPI application for the network ...
Automatic Communication Optimization of Parallel Applications in Public Clouds Emmanuell D. Carre˜no, Matthias Diener, Eduardo H. M. Cruz, Philippe O. A. Navaux Informatics Institute, Federal University of Rio Grande do Sul, Porto Alegre, Brazil {edcarreno,mdiener,ehmcruz,navaux}@inf.ufrgs.br Abstract—One of the most important aspects that influences the performance of parallel applications is the speed of communication between their tasks. To optimize communication, tasks that exchange lots of data should be mapped to processing units that have a high network performance. This technique is called communication-aware task mapping and requires detailed information about the underlying network topology for an accurate mapping. Previous work on task mapping focuses on network clusters or shared memory architectures, in which the topology can be determined directly from the hardware environment. Cloud computing adds significant challenges to task mapping, since information about network topologies is not available to end users. Furthermore, the communication performance might change due to external factors, such as different usage patterns of other users. In this paper, we present a novel solution to perform communication-aware task mapping in the context of commercial cloud environments with multiple instances. Our proposal consists of a short profiling phase to discover the network topology and speed between cloud instances. The profiling can be executed before each application start as it causes only a negligible overhead. This information is then used together with the communication pattern of the parallel application to group tasks based on the amount of communication and to map groups with a lot of communication between them to cloud instances with a high network performance. In this way, application performance is increased, and data traffic between instances is reduced. We evaluated our proposal in a public cloud with a variety of MPI-based parallel benchmarks from the HPC domain, as well as a large scientific application. In the experiments, we observed substantial performance improvements (up to 11 times faster) compared to the default scheduling policies. Index Terms—Task mapping, communication, network performance, scheduling, public clouds
I. I NTRODUCTION Running large parallel applications in the cloud has been a major research topic in recent years. For such applications, the cloud is an attractive platform since it offers a higher flexibility and lower up-front costs compared to traditional cluster systems [1]. Despite considerable research efforts in assessing and improving the viability of parallel applications in different cloud environments, in terms of porting, performance, and cost efficiency [2], several important issues for an efficient execution remain, especially regarding the interconnections of different cloud instances and network congestion [3], [4], which determine the performance with which parallel applications communicate. Additionally, inter-tenant traffic can amount up to 35% of the total datacenter traffic [5]. One of the aspects of cloud systems that has a high influence on
the communication performance is the heterogeneity of the network throughput. As applications also present heterogeneity in the amount of communication among their tasks, it is possible to make use of these different communication patterns and network throughputs to improve performance [6]. In cluster systems, a common technique to improve communication of applications from the HPC domain is to perform a communication-aware task mapping [7], in which tasks that communicate a lot are mapped to cluster nodes that are near each other. In this way, the overall locality of communication is improved, reducing the execution time of the application [8]. Task mapping requires knowledge about the communication pattern of the tasks of the parallel application, as well as knowledge about the network topology. The communication pattern is usually gathered from an analysis of the application [9], while the network topology is determined directly from the interconnection hierarchy in the cluster. Task mapping in the context of public cloud environments presents additional challenges over traditional cluster environments, mostly related to the lack of information and sharing of the platform. First, there is very little information about the underlying network, hardware and topology [1]. The user has no control over where instances will be allocated, and has no possibility to find out the topology directly. Second, the network hardware is shared between multiple users, without a direct way for the user to discover or influence the sharing. Finally, the cloud environment is dynamic: interference from other users might change, VMs might be migrated between the hardware, and new allocations might affect communication, among others [10]. For an effective task mapping, these issues need to be taken into account. Most related work on task mapping focuses on improving MPI communication in traditional clusters [11], [12] or improving memory access locality in shared memory [13], [14]. These techniques require an in-depth knowledge of the network topology and hardware architecture. In the context of cloud computing, most task mapping solutions focus on the provider side of the networking [15], [16], [17], improving bandwidth allocation by modifying scheduling policies, migrating VMs to increase usage density or capping bandwidth to maintain the offered SLA. In this paper, we present a novel solution for communication-aware task mapping in public cloud environments, called CloudMap. Our proposal improves two aspects of the communication of parallel applications.
II. H ETEROGENEITY OF C OMMUNICATION IN THE C LOUD
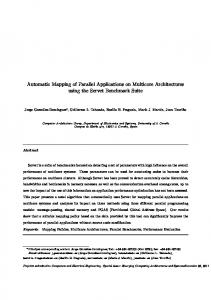
A. Network Interconnections in Cloud Environments In this section, we discuss the heterogeneity of the network performance in cloud systems. 1) Methodology: For the analysis of the interconnection performance in the cloud, we use 4 Microsoft Azure instances with the A7 instance size, which is one of the sizes that will be used in our performance evaluation in Section VI. For a continuous period of 24 hours, we measured the point-to-point latency and bandwidth between all 4 instances with the help of the MPIBench tool [18] with a message size of 4 KByte. This message size was chosen as many MPI applications use message sizes between 1 KByte and 16 KByte [19], [20]. We average the results over time intervals of 1 minute. More details regarding the cloud environment and the methodology will be given in Section V. With the generated information, we analyze how heterogeneous the interconnection performance is, as well as how this heterogeneity changes over time.
3 2 1 0
(a) Instance pair (1,4).
(b) Instance pair (2,3).
60 50 40 30 20 10 0
3 2 1 0
Latency (ms)
12:00 6:00 12:00 6:00 12:00 AM AM PM PM AM
60 50 40 30 20 10 0
3 2 1 0
12:00 6:00 12:00 6:00 12:00 AM AM PM PM AM
12:00 6:00 12:00 6:00 12:00 AM AM PM PM AM
(c) Instance pair (2,4).
(d) Instance pair (3,4).
Bandwidth (Gbit/s)
0
60 50 40 30 20 10 0
Bandwidth (Gbit/s)
1
Latency (ms)
2
Bandwidth
12:00 6:00 12:00 6:00 12:00 AM AM PM PM AM
Fig. 1: Network interconnection speed (latency and bandwidth) between four pairs of cloud instances. The three dotted vertical lines indicate the approximate times at which the interconnection matrices shown in Figure 2 were generated. 4
4
4
3
3
3
2
2
2
1
1 1
Task mapping is based on two sources of heterogeneity that affect the communication performance of parallel applications in the cloud. First, the hardware topology is heterogeneous, that is, some elements of the environment can communicate faster than others. Second, the communication behavior is heterogeneous, which means that some pairs of tasks perform more communication between them than to other tasks. These aspects are evaluated in this section.
3
Bandwidth (Gbit/s)
60 50 40 30 20 10 0
Bandwidth (Gbit/s)
Latency (ms)
Latency
Latency (ms)
First, it optimizes the communication by grouping tasks that communicate a lot. These groups are mapped to the same cloud instance, using the faster intra-instance interconnection instead of the slower inter-instance network to speed up communication. Second, CloudMap improves inter-instance communication by mapping the groups of tasks that communicate a lot (the same groups described in the first aspect) to instances that are close to each other in the network topology. For the second aspect, we discover the network topology using a light-weight profiling of the interconnection between cloud instances. The topology is used together with the communication pattern of the parallel application to calculate an optimized task mapping, which is then applied in the execution of the application. Since the profiling phase is very short, it can be executed before each application run with a negligible overhead. In contrast to previous proposals, CloudMap can be executed by a standard cloud tenant and requires no special privileges to run. We evaluated our proposal using a variety of MPI-based parallel applications in a commercial cloud environment using different instance sizes and numbers of instances. Our results show that there is substantial heterogeneity in communication performance between cloud instances, leading to high performance improvements from the improved task mapping compared to the default scheduler of the MPI runtime environment.
2
3
4
1 1
2
3
4
1
2
3
4
(a) Interconnection (b) Interconnection (c) Interconnection matrix at 07:00 AM. matrix at 01:00 PM. matrix at 07:00 PM.
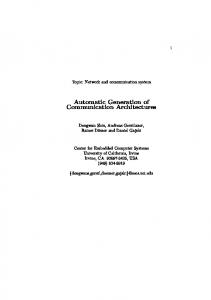
Fig. 2: Interconnection matrices. Axes show instance IDs. Darker cells indicate lower latency between pairs.
2) Results: Figure 1 shows the results of the communication performance over time for selected instance pairs in the cloud system. In the figures, we show both the latency and the bandwidth of communication between each pair. We did not notice any asymmetry in the performance, that is, performance is the same in both communication directions. Several important results can be seen in the figure. First, of all, performance changes drastically multiple times a day. Most instance pairs quadruple their communication latency during the 24 hours at various times. Bandwidth is also changing, though to a smaller degree. Despite the changing behavior, networking performance remains stable in most cases for some hours at a time. This has a significant impact on the task mapping. For the shown behavior, it is better to map tasks that communicate a lot on pair (2,4) during the beginning of the experiment, while at the end of the shown time period, placing the tasks on pair (2,3) would result in a higher communication performance. The communication performance between all pairs of instances can be expressed with an interconnection matrix, where each cell contains the communication latency (or
60
60
50
50
3
40
40
2
30
30
20
20
1
10
10
0
0
(3,4)
(2,4)
(2,3)
(1,4)
(1,3)
4
(1,2)
Bandwidth (Gbit/s) (3,4)
(2,4)
(2,3)
(1,4)
(1,3)
(1,2)
Latency (ms)
70 60 50 40 30 20 10 0
0 10 20 30 40 50 60
0
0 10 20 30 40 50 60
(a) bt.
(b) ft.
Fig. 3: Overall communication performance during the 24 hours, for all instance pairs in our 4-instance cloud.
Fig. 4: Examples of communication matrices with high and low heterogeneity for applications running with 64 tasks.
bandwidth) between a pair of instances. The axes contain the instance IDs. We visualize this matrix as a heatmap, where darker cells indicate higher communication performance (lower latency). We do not show the diagonal of the matrix, since communication within each instance was always much faster in our tests than the communication between instances. Figure 2 shows three examples of latency-based interconnection matrices for our experiment at different times during the day, at approximately 07:00 AM, 01:00 PM, and 07:00 PM. The matrices confirm that the overall communication behavior between the instances is highly heterogeneous, with several instance pairs that can communicate much faster than other pairs. The figures also show that the heterogeneity changes over time. For example, while instances (1,2) communicate very fast at 07:00 AM, they are the slowest pair at 01:00 PM. This indicates that performing the characterization too infrequently might lead to wrong conclusions regarding the communication performance and an ineffective task mapping. To show the amount of differences that can be exploited by task mapping, Figure 3 shows box plots of the latency and bandwidth between all instance pairs during the whole 24 hours of the experiment. Although the median values are relatively similar for all pairs, there is a considerable variance of performance during the execution, which suggests that task mapping can have a significant impact on the overall execution time in the cloud system.
the number of messages as the metric. Each application is executed with 64 tasks and the B input size. It is important to note that most MPI applications (including all of the NAS applications) have a very stable communication behavior, that is, the pattern remains the same throughout the entire execution, as well as between repeated runs. bt has large amounts of communication between task pairs that are direct neighbors (such as 0 and 1), and pairs that are farther apart (such as 0 and 8). Due to this structure, bt is highly heterogeneous and is very suitable for task mapping. On the other hand, ft consists mostly of collective communication between all tasks [19], and has therefore a very homogeneous pattern as shown in Figure 4b. ft is much less suitable for task mapping than bt, because, regardless of where each task is mapped, the amounts of intra-instance and inter-instance communication would be very similar. However, the majority of NAS applications are highly heterogeneous.
B. Communication Patterns of Parallel Applications Parallel applications communicate to perform their work. Most APIs for distributed memory systems, including MPI, use explicit functions to exchange messages. These messages can be point-to-point, between pairs of tasks, or broadcast operations between multiple tasks. Communication is detected by monitoring these functions and building a communication matrix, whose cells contain the amount of communication between all pairs of tasks, measured as the number of messages or number of bytes transmitted. This matrix can be visualized with a heatmap, where darker cells indicate more communication between the task IDs shown in the axes. Most parallel applications have a highly heterogeneous pattern, with a clearly visible structure of task pairs that communicate more than other pairs. A comparison of communication matrices for two applications from the NAS Parallel Benchmarks [21] (bt and ft) is shown in Figure 4, using
C. Summary Our discussion in this section showed that the network performance of cloud instances and the communication structure of parallel applications are highly heterogeneous and are suitable for communication-aware task mapping. In Section IV, we will present our mechanism that exploits this heterogeneity to calculate an optimized task mapping, taking into account the changing network performance in the cloud. III. R ELATED W ORK Traditionally, task mapping was performed mostly in clusters, as well as shared memory architectures. With the introduction of cloud computing, the interest in task mapping also grew in this area, since network performance remains an important bottleneck for large parallel applications in the cloud [3]. A. Task Mapping in Clusters and Shared Memory Systems Task mapping in network clusters and grids is a well known problem and have been studied for a long time. Programming paradigms used in these environments are mostly based on message passing, such as MPI, where the communication pattern can be detected by monitoring the messages sent between the tasks, using tools such as EZTrace [22]. Since communication events themselves are relatively easy to detect, most challenges lie in an efficient storage and analysis of
communication [9], optimized mapping algorithms [23], [24], as well as reduction of communication [25]. The hardware topology for mapping is usually discovered directly from the network structure. Examples of task mapping mechanisms include MPIPP [11], which consists of a message tracer and a custom mapping algorithm, as well as a technique to reorder MPI ranks to match the communication pattern with the hardware topology [26]. In shared memory architectures, most communication is implicit and happens when tasks perform memory accesses to shared data. In these architectures, communication-based task mapping can improve usage of caches and intra-system interconnections. The main challenge in shared memory is to detect the implicit communication. Most previous work uses statistics from the virtual memory subsystem [13] or from hardware counters [14] for the detection. The hardware hierarchy is generally discovered with tools such as hwloc [27]. B. Task Mapping in Cloud Computing Gupta et al. [28] propose a technique to improve the performance of HPC applications in the cloud with task mapping. The authors map the tasks according to the interference between different applications by analyzing their cache memory usage, and from a description provided by the user, but do not use the communication pattern of applications. Sonnek et al. [29] detect the communication pattern by monitoring the messages, and migrate the virtual memories to nodes in a way that optimizes communication. Both proposals were not evaluated in a commercially available cloud, and it may not be possible to do so due to the lack of control over the contracted service. Similar work includes [8], [6]. Saad and El-Mahdy [1] propose an analytical model that describes the physical placement of virtual machines in the communication hierarchy. They use a set of experiments that measure the point-to-point communication performance of virtual machines, providing an overview of the network in a cloud environment. However, they do not detect the communication between the tasks of the parallel application to be able to improve performance in an automated way. Task placement of applications based on profiling network traffic was proposed by LaCurts et al. [30]. While their work has some common goals with ours, their measurement mechanism is slow, taking 3 minutes for 90 VMs, and they have to measure throughput every 10 seconds for half an hour for accuracy. Also, they do not take intra-instance communication into account, assuming that only profiling the complete node includes the required communication data. Bassem et al. [17] developed a technique to improve performance of applications by optimizing the resource allocation of VMs. They use network traffic profiling to generate traffic matrices. Using this information, they map processing jobs to VMs. This work differs from ours because their solution focuses on optimizing resource allocations, reducing the price of the deployment over improving performance of the application. Chen et al. [16] designed a VM allocation mechanism to reduce the number of physical machines and
VM migrations, designing an algorithm to detect utilization patterns from groups of VMs. Those utilization patterns allow them to establish VM allocation policies based on the most used resources on every group of VMs. Their evaluation with MapReduce jobs showed that improving the VM consolidation using spatial awareness allows the reduction of the completion time of those jobs. The focus of their work is to keep the SLAs in compliance. Xie et al. [15] developed a system that profiles network demands of applications. Their main concern is to provide more bandwidth for each job, without wasting resources. Their mechanism allows providing performance guarantees by asking for network resources as needed. While this work identifies networking problems, the solution uses job scheduling and bandwidth capping, and does not consider intra-instance communication. All analyzed cloud-based solutions focus on improvements from the point of view of the provider, or they target private clouds. In both cases, implementing the mechanisms is straightforward for the provider, but it is not possible for the user due to the requirement of a privileged control level. From the user side, public clouds are very restricted, but the users have more information about the application, which can lead to better mechanisms. C. Summary of Related Work Previous work in cluster systems require information that is not available in public cloud environments, such as information about the network and contention from other users. Existing solutions that target the cloud also require features that are usually not provided by public clouds and are therefore not applicable for the large majority of users. To the best of our knowledge, there is no previous work that performs task mapping of large parallel applications in commercial clouds in an automated way. IV. C LOUD M AP : TASK M APPING IN THE C LOUD This section presents our proposal for automatic task mapping in cloud environments. In the implementation, we focus on parallel applications based on MPI, but our proposal can be easily ported to other parallelization APIs. A high-level overview of our mechanism is shown in Figure 5. It consists of four parts, three of which are executed online, since the communication performance in the cloud might change frequently. The communication detection of most MPI applications can be performed offline, since communication patterns usually do not change between multiple executions. Our description in this section follows the four parts outlined in the figure. A. Gathering Network Information Determining the network topology and communication performance of the cloud environment is the most critical step of our proposal, as it determines the overhead on the parallel application (since this profiling is performed for every execution), as well as the performance benefits that can be achieved. We created a custom, optimized MPI application for the network performance characterization, based on the
Determine network topology (Section IV-A)
Generate communication matrix (Section IV-B)
Calculate task mapping (Section IV-C) Execute application with task mapping (Section IV-D)
Offline Online
Fig. 5: Overview of CloudMap. MPIBench [18] code. To minimize the overhead, we limit our profiling to a single message size common in MPI applications (1 KByte) [19], [20], in contrast to previous solutions that perform a more extensive (offline) characterization [1]. We measure the round-trip latency and bandwidth of 1000 messages for each pair of instances. Higher numbers of messages did not improve accuracy while increasing the overhead slightly. To further reduce the overhead, the profiling is performed in parallel, but only one measurement is performed on each instance at a time. Only one communication direction is measured for each pair of nodes, since the performance was identical in our tests. In this way, the overhead of the profiling is minimized. From the statistics gathered during the profiling, we create two interconnection matrices, which contain the measured latency and bandwidth metrics. B. Generating the Communication Matrix To generate the communication matrix of a parallel application, we use EZTrace [22], which automatically instruments MPI-based applications to detect their communication. After execution, it outputs the communication patterns of the application based on two metrics. The first metric is the amount of data (in bytes) exchanged by the tasks, while the second metric contains the number of messages that were exchanged between tasks. We evaluate both metrics in our experiments. Only point-to-point communication is taken into account, collective communication is discarded as it does not impact the task mapping. In our current implementation, the communication detection is the only part that is run offline, before the actual execution of the application. However, it is simple to extend our mechanism to also perform this detection as part of the online characterization (for example, by tracing just a small part of the application) and cache the result for future executions. In our experiments as well as previous studies [31] with MPI-based applications, communication patterns from repeated executions of an application remained the same, and can therefore be reused for multiple executions. C. Calculating the Optimized Task Mapping To calculate the optimized task mapping, we use the dual recursive bipartitioning algorithm of the Scotch graph library [24], version 6.0. It receives as input the communication matrix and the network interconnection matrix, and outputs the mapping of tasks to cloud instances. Scotch calculates the minimum edge cut in the graph, such that tasks that
communicate a lot are kept in the same subset. It repeats this procedure recursively for each graph subset. We used Scotch because it has a short execution time (less than 1ms to map 64 tasks), while providing good results [32]. Scotch has a complexity of O(T 3 ), where T is the number of tasks to be mapped [33], but scales well up to 10,000 tasks even with the sequential algorithm [23]. The authors of Scotch mention that the parallel implementation of Scotch scales up to 2.4 billion nodes (tasks and instances in our case)1 . This can be a viable option in case the number of tasks increases beyond 10,000. Scotch outputs the cloud instance on which each task should run such that the overall communication is optimized. D. Running the Application As the final step, the application is executed with the optimized task mapping. Since our experiments are run with the OpenMPI [34] MPI runtime environment, our mechanism creates a rankfile [35], which specifies the assignment of MPI tasks to hosts. Similar assignment mechanisms exist for most other MPI environments, such as MPICH [36]. This rankfile is used as an argument in the application execution via the mpirun command. The online parts of our proposal are packaged in a single shell script, that allows the user to run a parallel application by only specifying its name and parameters. The script performs the characterization and mapping without user intervention and executes the application. E. Overhead Our proposal causes an overhead for the application, since the network characterization and mapping are performed for each execution. The characterization of interconnection performance has a complexity of O(I 2 ), where I is the number of cloud instances that are characterized. The task mapping algorithm has a complexity of O(T 3 ), where T is the number of tasks, as mentioned before. This runtime overhead will be measured in Section VI. V. M ETHODOLOGY OF E XPERIMENTS This section provides an overview of our experimental methodology, including the cloud environment, parallel applications, and mapping mechanisms. A. Cloud Instances All our experiments were performed in Microsoft Azure (West US) cloud instances. Azure was chosen because it has shown a high suitability to run HPC applications in terms of performance and price [2], [37]. Our solution is platformindependent however and can be easily applied to other service providers. We evaluated several instance sizes and numbers of instances. Table I shows an overview of the instance types. The A7 instance is our baseline system, as it represents a typical cloud instance size. Each instance consists of 8 cores, and we experiment with both 8 and 32 A7 instances, for 64 or 256 tasks per application, respectively. The A8 size is very 1 http://www.labri.fr/perso/pelegrin/scotch/
TABLE I: Properties of the cloud instances used for evaluation. Instance size
Number of instances
Cores / instance
Number of tasks
Memory per instance
Network speed
A7 A8 G5
8 / 32 32 8
8 8 32
64 / 256 256 256
56 GByte 56 GByte 448 GByte
2 Gbps 10 Gbps 8 Gbps
similar to A7, with the same processing power, but it has very fast interconnections of up to 10 Gbps, which is the fastest network performance offered on Azure. The G5 instance size focuses explicitly on HPC, with 32 cores per instance and a network performance of up to 8 Gbps. B. Parallel Applications For the evaluation, we use the NAS Parallel Benchmarks (NPB) [21], version 3.3.1, which are implemented with MPI. We present results for the B and C input sizes, which represent medium and large input sets, respectively. Absolute execution times vary between several seconds to several minutes, depending on the application and mapping strategy. As an example of a large scientific application, we use the BRAMS weather prediction model [38], version 5.0, with the light1gr input set. BRAMS also uses MPI. C. Task Mapping Mechanisms We compare the following task mapping mechanisms. Baseline. As the baseline, we use the default scheduler of OpenMPI [34], version 1.6.5. In our experiments, the default scheduler used an interleave policy to assign tasks to nodes, that is, the first task is executed on the first node, the second task on the second node, etc. RoundRobin. in the RoundRobin scheduler, tasks are mapped consecutively to instances and cores within the instances. For example, the first task is mapped to the first core of the first instance, the second task to the second core of the first instance, and so on. In this way, communication can be optimized if mostly neighboring tasks communicate and neighboring cloud instances have the highest communication performance. This mapping is similar to options available in some MPI environments [36]. Random. In the Random mapping, we assign tasks randomly to instances and cores, while ensuring that the same number of tasks gets mapped to each instance. This mapping is used to verify the impact of mapping. CloudMapbw and CloudMaplat represent two versions of our proposed task mapping mechanism, using bandwidth and latency based metrics, respectively. For the bandwidth version, we calculate the task mapping with the communication matrix that uses the number of bytes as metric, together with the interconnection matrix based on bandwidth. The latency version uses the communication matrix with the number of messages and the latency-based interconnection matrix as inputs. All experiments on all cloud environments and mapping mechanisms were performed at least 10 times. Since absolute execution times vary widely, we normalize all results to our baseline and show the performance gains of the other
mechanisms compared to the baseline. We show average values, as well as the standard deviation. Cloud instances were only allocated once for the experiments, without reallocation between executions. To further increase the fairness of the comparison, we execute the mapping mechanisms in an interleaved way, such that each mechanism was executed under similar conditions in the cloud. D. Analysis of Improvements To compare the quality of different task mappings, we compare the amount of intra- and inter-instance communication as well as the communication speed with the following equations. Equations 1 and 2 calculate the amount of inter-instance communication. Equation 1 evaluates if tasks i and j are executed in the same instance, where the function Instance(x) returns the cloud instance of task x. Comm(i, j) is a function that returns the amount of communication between tasks i and j. ( 1 if Instance(i) 6= Instance(j) DiffInst(i, j) = (1) 0 otherwise Inter =
T −1 X
T X
DiffInst(i, j) × Comm(i, j)
(2)
i=1 j=i+1
To calculate the amount of intra-instance communication, we subtract the amount of inter-instance communication from the total amount of communication, as in Equation 3. T T −1 X X Comm(i, j) − Inter (3) Intra = i=1 j=i+1
We also evaluate the time an application spends communicating in Equation 4. To calculate that we only consider interinstance communication, since intra-instance communication has a much lower overhead compared to inter-instance. CommT ime =
T −1 X i=1
T X
Comm(i, j) × DiffInst(i, j) Bandwidth(i, j) j=i+1 (4) VI. R ESULTS
This section presents and discusses the results of our experiments. A. Main Performance Results We begin the discussion with the results of the performance experiments, separated by cloud instances. 1) A7: 8 instances, 64 tasks: For the 8 A7 instance cloud, performance results (normalized to the baseline) are shown in Figures 6 and 7 for the B and C input sizes, respectively. Three benchmarks, bt, lu, and sp, have significant performance gains with our proposal, reaching up to 35% in the case of sp with input size B. These applications are highly heterogeneous with significant amounts of communication. The other benchmarks show no difference in execution time or increase it slightly. ep, ft, and is are not suitable for mapping, since they use mostly collective communication [19], and have therefore
Random
ft
is
lu
mg
sp
Performance gains
Fig. 6: Performance gains on 8 A7 instances (64 tasks), normalized to the default mapping policy, with input size B. CloudMapbw 30% 20% 10% 0% −10% −20% −30% −40% −50% −60% bt cg
CloudMaplat
ep
ft
RoundRobin
is
lu
Random
mg
sp
Fig. 7: Performance gains on 8 A7 instances (64 tasks), normalized to the default mapping policy, with input size C.
little heterogeneity in the communication behavior that can be exploited. is also has a very short execution time, and therefore suffers from the overhead of the profiling phase. cg and mg with 64 tasks do not benefit from the task mapping, since their communication patterns results in very little interinstance communication for most mechanisms. The results for the larger input size C are qualitatively almost identical to B, with slightly lower absolute gains. For example, sp’s gains were 31% with C. The reason for this reduction is the fact that with larger inputs, comparatively less communication is performed, reducing the gains from task mapping slightly. In these configurations, focusing on the latency or bandwidth results in very similar gains. We can also see that the Random policy results in large performance losses in many cases, while the RoundRobin mapping has only very small performance differences compared to the baseline. This shows that simple mapping policies are not sufficient to perform a successful task mapping. RoundRobin has no improvements even for applications with a nearestneighbor communication pattern, for which it represents a perfect communication-aware mapping within each instance. This means that it is very important to consider the interinstance communication performance for the task mapping, as done by our proposal. This will be evaluated in more detail in Section VI-C. 2) A7: 32 instances, 256 tasks: For the A7 cloud with 32 instances, results are shown in Figures 8 and 9. Due to the higher task count, the amount of communication per task is increasing [20], and the importance of task mapping rises, as evidenced by the generally higher performance improvements. For the same reason, two benchmarks (cg and is) that did not have gains in the previous experiment now show modest
CloudMaplat
ep
ft
RoundRobin
is
lu
Random
mg
sp
Fig. 8: Performance gains on 32 A7 instances (256 tasks), normalized to the default mapping policy, with input size B.
Performance gains
ep
CloudMapbw 100% 80% 60% 40% 20% 0% −20% bt cg
CloudMapbw 120% 100% 80% 60% 40% 20% 0% −20% −40% bt cg
CloudMaplat
ep
ft
RoundRobin
is
lu
Random
mg
sp
Fig. 9: Performance gains on 32 A7 instances (256 tasks), normalized to the default mapping policy, with input size C.
300% 250% 200% 150% 100% 50% 0%
CloudMapbw Performance gains
RoundRobin
Performance gains
CloudMaplat
Performance gains
Performance gains
CloudMapbw 40% 30% 20% 10% 0% −10% −20% −30% −40% −50% bt cg
bt cg ep ft is lu mg sp
(a) B input size.
CloudMaplat 80% 70% 60% 50% 40% 30% 20% 10% 0% −10% bt cg ep ft is lu mg sp
(b) C input size.
Fig. 10: Performance gains on 32 A8 instances (256 tasks), normalized to the default mapping policy. improvements with the B input. The other applications show similar behaviors as before. 3) A8: 32 instances, 256 tasks: The A8 instances have high-speed interconnections, which are 5× faster than those of A7. Figures 10a and 10b contain the performance results for this experiment with 256 tasks for each benchmark. Due to space limitations, we do not show the Random and RoundRobin results in the figures, but they are very similar to the results for the A7 instances. Despite the faster interconnection, task mapping is still very important to reduce the communication costs. As before, applications with a high heterogeneity benefit much more from mapping, with slightly lower gains with larger input sizes. 4) G5: 8 instances, 256 tasks: The G5 instance size focuses on High-Performance Computing and has large instances with 32 cores each. Its interconnection speed is between the A7 and A8 instances. The results of this experiment are shown in Figures 11a and 11b. For both input sizes, the highest overall improvements of all our experiments were achieved, with cg-B increasing performance by up to 11×. As previously, heterogeneous benchmarks profit more from task mapping.
bt cg ep ft is lu mg sp
CloudMaplat 200% 175% 150% 125% 100% 75% 50% 25% 0% bt cg ep ft is lu mg sp
(a) B input size.
(b) C input size.
Execution time (s)
Fig. 11: Performance gains on 8 G5 instances (256 tasks), normalized to the default mapping policy. 200 180 160 140 120 100 80 60 40 20 0
Baseline
CloudMapbw
CloudMaplat
Runs
Fig. 12: Execution time of multiple cg (C input size) runs on 32 A8 instances over 2 days. B. Performance Improvements over Time In order to show how the gains of our mechanism change over time, we performed a long-term experiment with the cg benchmark on 32 A8 instances, continually executing the application during two days. We measured execution time with the default mapping, CloudMapbw , and CloudMaplat , interleaving execution of the various mechanisms as before to maximize the fairness of the evaluation. The execution times of ∼600 runs are shown in Figure 12. Several interesting conclusions can be drawn from these results. First, the baseline results were very stable. This indicates that despite the changing communication behavior, the overall communication performance remains very similar over time, as indicated by our analysis in Section II-A. Second, considering the communication bandwidth leads to the highest gains, but in some cases latency achieves similar gains. Finally, despite these changes, overall performance improvements remain stable during the whole two days. C. Improvements from Intra- and Inter-Instance Task Mapping Communication-aware task mapping improves performance in two ways. By grouping tasks that communicate a lot on the same instance, which we refer to as intra-instance mapping, and by mapping the groups of tasks that have a lot of communication between groups to instances with a high interconnection speed, which we call inter-instance mapping. The impact of these two types of mapping is evaluated here. 1) Methodology: The two mapping policies, intra-instance only and inter-instance only, were evaluated separately. For intra-instance only, we use the Scotch mapping algorithm to divide the tasks of each application into groups with lots of communication within the groups. The size of the
Full Performance gains
CloudMapbw Performance gains
Performance gains
1,200% 1,000% 800% 600% 400% 200% 0%
Intra-instance only
Inter-instance only
40% 30% 20% 10% 0% −10% −20% bt
cg
ep
ft
is
lu
mg
sp
Fig. 13: Separate mapping using CloudMapbw on 8 A7 instances (64 tasks), normalized to the default mapping policy. group is equal to the number of tasks that each instance can execute, 8 in our case. Then, we map each group randomly to the instances. In this way, intra-instance communication is optimized, but communication between instances is not. For this mapping, no network profiling is necessary. For the inter-instance only mapping, we first map the tasks randomly to instances, and then create a new communication matrix for the communication between instances using the random assignment. This communication matrix is then used with Scotch to create an optimized mapping of the task groups to instances that optimizes the communication performance. In this way, the two mapping types form opposites and can be used to determine the importance of each optimization. We compare both mappings to our proposal, which performs both types of task mapping, and the default mapping policy. Results are shown for the 8 A7 instances system, but results are qualitatively similar on the other instance sizes. 2) Results: The results of this experiment are shown in Figure 13. For most benchmarks, running only 1 type of mapping has significantly lower gains than performing both types jointly. As mentioned before, the short execution time of is results in an overhead due to the network profiling, which is avoided by the intra-instance only mapping. All other applications benefit much more from the joint mapping. These results show that it is important to consider the intra- and inter-instance traffic for optimal improvements. In particular, most applications benefit from the network characterization to perform the inter-instance mapping. D. The BRAMS Application To show the benefits of our proposal for a large scientific application, we evaluate the BRAMS application on the three instance sizes with 256 tasks. The results of this experiment are shown in Figure 14. For the instance sizes with 8 cores per instance, A7 and A8, our proposal only results in modest speedups, while performance improvements are much higher for the G5 instance size with 32 cores per instance. This indicates that BRAMS is sensitive mostly to the intra-instance mapping, similar to the cg benchmark. As in most of the previous experiments, improvements are very similar with the bandwidth and latency metrics. E. Communication Improvements The results showing the amount of inter-instance traffic, calculated as described in Equation 2 (Section V-D), are
Performance gains
CloudMapbw CloudMaplat 60% 50% 40% 30% 20% 10% 0% A7 A8 G5
0% −10% −20% −30% −40% −50% −60% −70% −80% −90%
Time
Amount
Fig. 14: BRAMS results with 256 tasks, normalized to the default mapping policy.
bt cg ep ft is lu mg sp
(a) Amount of traffic.
0% −10% −20% −30% −40% −50% −60% −70% −80% −90% bt cg ep ft is lu mg sp
(b) Time spent to communicate.
Fig. 15: Inter-instance traffic improvements of CloudMap (64 tasks), normalized to a Random mapping.
shown in Figure 15a. The time required to send the messages between the instances, calculated using Equation 4, is shown in Figure 15b. Both types of values are normalized to the Random mapping. We do not show the amount of intrainstance communication as it is directly related to the amount of intra-instance communication (inversely proportional). We can observe that there is a very good correlation between the reduction of the amount of inter-instance traffic and the time spent sending the messages between the instances, explaining the performance gains of our proposal. F. Overhead Since we execute the profiling and task mapping algorithm on each execution, our proposal has a small runtime overhead before starting the parallel application. We discuss this overhead for the A7 cloud instances with 8 and 32 instances, which presented the highest overhead of the instance types that we evaluated, since the machines have a lower performance (both in terms of processing and network interconnection) than the A8 and G5 instances. Table II contains the overhead of the profiling and mapping phases in seconds. The overhead of the profiling phase depends on the number of instances that are characterized. The profiling makes up the main part of the total overhead. The time it takes to calculate the task mapping is independent of the actual communication or interconnection matrices, as well as the number of instances. It only depends on the number of tasks that need to be mapped. The results show that the overhead only has a small impact on the execution time of the parallel application, if the application takes at least several seconds to execute. In our experiments, this overhead affected the ft, is, and mg benchmarks, which have execution times of 5–10 seconds with
TABLE II: Overhead of our proposal, in seconds. Phase Profiling Task mapping
A7-8 instances (64 tasks)
A7-32 instances (256 tasks)
0.69 s 0.005 s
1.67 s 0.028 s
the C input size. All other applications have higher execution times and the overhead is negligible. G. Summary Our results have shown that on all instance sizes, our proposal achieved significant speedups compared to the default scheduler and to simple mapping techniques. As expected, applications with a heterogeneous communication behavior benefited much more from the task mapping than those with homogeneous communication. Furthermore, we have seen that when increasing the number of instances and tasks, gains are increasing as the importance of task mapping is rising. In most cases, considering bandwidth achieved slightly higher gains than considering latency. VII. C ONCLUSIONS One of the main aspects affecting the viability of cloud computing for large parallel applications is the network performance between the cloud instances, which impacts the performance of the communication in parallel applications. To improve communication performance, we can use a technique called communication-aware task mapping, which was traditionally employed in network clusters and parallel machines to improve communication efficiency. In cloud systems, the lack of information regarding the technical aspects of the underlying network structure represents a challenge for task mapping, as most solutions require such information and are therefore difficult to apply in commercial clouds. In this paper, we presented a novel solution that performs a short profiling phase to analyze the network topology of the cloud instances, and uses the information together with the communication pattern to execute the parallel application with an optimized task mapping2 . In this way, our mechanism allows users of commercial clouds to perform communicationaware task mapping with a minimal overhead, which is able to react to the changing usage patterns and network speeds common in cloud environments. We evaluated our proposal with a set of MPI-based parallel benchmarks and a large scientific application in several instance sizes and numbers in a public cloud. Results showed large performance gains of our proposal, with speedups of up to 11× compared to the default MPI scheduler. Our experiments showed that our proposal is an effective and practical solution to alleviate the network bottleneck in cloud environments. For the future, we will evaluate extending our proposal to handle network performance changes during application execution, possibly with runtime environments that directly support task migration between cloud instances. We also 2 CloudMap
is available at https://github.com/ediazc/CloudMap.
intend to further analyze communication performance and improve the task mapping within each instance. ACKNOWLEDGMENTS The authors thank Emmanuel Jeannot and the anonymous reviewers for their comments regarding the paper. This work was developed in the context of the HPC4E project of RNP/EU and was supported by CNPq and CAPES. Microsoft provided free Azure instances for the experiments. R EFERENCES [1] A. Saad and A. El-Mahdy, “Network Topology Identification for Cloud Instances,” in International Conference on Cloud and Green Computing, 2013, pp. 92–98. [2] E. Roloff, M. Diener, A. Carissimi, and P. O. A. Navaux, “High Performance Computing in the Cloud: Deployment, Performance and Cost Efficiency,” in IEEE International Conference on Cloud Computing Technology and Science (CloudCom), 2012, pp. 371–378. [3] A. Iosup, S. Ostermann, and M. Yigitbasi, “Performance analysis of cloud computing services for many-tasks scientific computing,” IEEE Transactions on Parallel and Distributed Systems, vol. 22, no. June, pp. 931–945, 2011. [4] A. Bhatele, A. R. Titus, J. J. Thiagarajan, N. Jain, T. Gamblin, P.-T. Bremer, M. Schulz, and L. V. Kale, “Identifying the Culprits Behind Network Congestion,” in IEEE International Parallel and Distributed Processing Symposium (IPDPS), 2015, pp. 113–122. [5] H. Ballani, K. Jang, and T. Karagiannis, “Chatty Tenants and the Cloud Network Sharing Problem,” in Nsdi, 2013, pp. 171–184. [6] J. Slawinski, U. Villa, T. Passerini, A. Veneziani, and V. Sunderam, “Issues in Communication Heterogeneity for Message-Passing Concurrent Computing,” in 2013 IEEE International Symposium on Parallel & Distributed Processing, Workshops and Phd Forum, 2013, pp. 93–102. [7] M. Deveci, K. Kaya, B. Ucar, and U. V. Catalyurek, “Fast and High Quality Topology-Aware Task Mapping,” in IEEE International Parallel and Distributed Processing Symposium (IPDPS), 2015, pp. 197–206. [8] L. Yin, J. Sun, L. Zhao, C. Cui, J. Xiao, and C. Yu, “Joint Scheduling of Data and Computation in Geo-Distributed Cloud Systems,” in 2015 15th IEEE/ACM International Symposium on Cluster, Cloud and Grid Computing, 2015, pp. 657–666. [9] J. Zhai, T. Sheng, and J. He, “Efficiently Acquiring Communication Traces for Large-Scale Parallel Applications,” IEEE Transactions on Parallel and Distributed Systems (TPDS), vol. 22, no. 11, pp. 1862– 1870, 2011. [10] I. Pagliai, “Azure Network Latency & SQL Server Optimization,” 2013. [Online]. Available: http://blogs.msdn.com/b/igorpag/archive/2013/12/ 15/azure-network-latency-test-and-sql-server-optimization.aspx [11] H. Chen, W. Chen, J. Huang, B. Robert, and H. Kuhn, “MPIPP: An Automatic Profile-guided Parallel Process Placement Toolset for SMP Clusters and Multiclusters,” in International Conference on Supercomputing (SC), 2006, pp. 353–360. [12] E. R. Rodrigues, F. L. Madruga, P. O. A. Navaux, and J. Panetta, “Multi-core aware process mapping and its impact on communication overhead of parallel applications,” in IEEE Symposium on Computers and Communications (ISCC), 2009, pp. 811–817. [13] M. Diener, E. H. M. Cruz, and P. O. A. Navaux, “CommunicationBased Mapping Using Shared Pages,” in IEEE International Parallel & Distributed Processing Symposium (IPDPS), 2013, pp. 700–711. [14] R. Azimi, D. K. Tam, L. Soares, and M. Stumm, “Enhancing Operating System Support for Multicore Processors by Using Hardware Performance Monitoring,” ACM SIGOPS Operating Systems Review, vol. 43, no. 2, pp. 56–65, apr 2009. [15] D. Xie and Y. C. Hu, “The Only Constant is Change : Incorporating Time-Varying Network Reservations in Data Centers,” Sigcomm, no. Vc, pp. 199–210, 2012. [16] L. Chen and H. Shen, “Consolidating complementary VMs with spatial/temporal-awareness in cloud datacenters,” in INFOCOM, 2014, pp. 1033–1041. [17] C. Bassem and A. Bestavros, “Network-Constrained Packing of Brokered Workloads in Virtualized Environments,” in 15th IEEE/ACM International Symposium on Cluster, Cloud and Grid Computing, 2015.
[18] D. Grove and P. Coddington, “Precise MPI performance measurement using MPIBench,” in Proceedings of HPC Asia, 2001, pp. 24–28. [19] R. Riesen, “Communication Patterns,” in IEEE International Parallel & Distributed Processing Symposium (IPDPS), 2006. [20] F. Wong, R. Martin, R. Arpaci-Dusseau, and D. Culler, “Architectural Requirements and Scalability of the NAS Parallel Benchmarks,” in ACM/IEEE Conference on Supercomputing (SC), 1999, pp. 1–18. [21] D. H. Bailey, E. Barszcz, J. Barton, D. Browning, R. Carter, L. Dagum, S. Fineberg, P. Frederickson, T. Lasinski, R. Schreiber, H. Simon, V. Venkatakrishnan, and S. Weeratunga, “The NAS Parallel Benchmarks,” International Journal of High Performance Computing Applications, vol. 5, no. 3, pp. 66–73, 1991. [22] F. Trahay, F. Rue, M. Faverge, Y. Ishikawa, R. Namyst, and J. Dongarra, “EZTrace: a generic framework for performance analysis,” in International Symposium on Cluster, Cloud and Grid Computing (CCGrid), 2011, pp. 618–619. [23] E. Jeannot, G. Mercier, and F. Tessier, “Process Placement in Multicore Clusters: Algorithmic Issues and Practical Techniques,” IEEE Transactions on Parallel and Distributed Systems, vol. 25, no. 4, pp. 993–1002, apr 2014. [24] F. Pellegrini, “Static Mapping by Dual Recursive Bipartitioning of Process and Architecture Graphs,” in Scalable High-Performance Computing Conference (SHPCC), 1994, pp. 486–493. [25] G. Ballard, E. Carson, J. Demmel, M. Hoemmen, N. Knight, and O. Schwartz, “Communication lower bounds and optimal algorithms for numerical linear algebra,” Acta Numerica, vol. 23, pp. 1–155, 2014. [26] G. Mercier and E. Jeannot, “Improving MPI Applications Performance on Multicore Clusters with Rank Reordering,” in European MPI Users’ Group Conference on Recent Advances in the Message Passing Interface (EuroMPI), 2011. [27] F. Broquedis, J. Clet-Ortega, S. Moreaud, N. Furmento, B. Goglin, G. Mercier, S. Thibault, and R. Namyst, “hwloc: A Generic Framework for Managing Hardware Affinities in HPC Applications,” in Euromicro Conference on Parallel, Distributed and Network-based Processing (PDP), 2010, pp. 180–186. [28] A. Gupta, L. V. Kal´e, D. Milojicic, P. Faraboschi, and S. M. Balle, “HPCaware VM placement in infrastructure clouds,” in IEEE International Conference on Cloud Engineering (IC2E), 2013, pp. 11–20. [29] J. Sonnek, J. Greensky, R. Reutiman, and A. Chandra, “Starling: Minimizing Communication Overhead in Virtualized Computing Platforms Using Decentralized Affinity-Aware Migration,” in International Conference on Parallel Processing (ICPP), sep 2010, pp. 228–237. [30] K. LaCurts, S. Deng, A. Goyal, and H. Blakrishnan, “Choreo: networkaware task placement for cloud applications,” in Internet Measurement Conference (IMC), 2013, pp. 191–203. [31] F. Cappello, A. Guermouche, and M. Snir, “On Communication Determinism in Parallel HPC Applications,” in International Conference onComputer Communications and Networks (ICCCN), 2010, pp. 1–8. [32] M. J. Rashti, J. Green, P. Balaji, A. Afsahi, and W. Gropp, “Multi-core and Network Aware MPI Topology Functions,” in Recent Advances in the Message Passing Interface, 2011. [33] T. Hoefler and M. Snir, “Generic Topology Mapping Strategies for Large-scale Parallel Architectures,” in International Conference on Supercomputing (ICS), 2011, pp. 75–85. [34] E. Gabriel, G. E. Fagg, G. Bosilca, T. Angskun, J. J. Dongarra, J. M. Squyres, V. Sahay, P. Kambadur, B. Barrett, and A. Lumsdaine, “Open MPI: Goals, concept, and design of a next generation MPI implementation,” in Recent Advances in Parallel Virtual Machine and Message Passing Interface, 2004. [35] The Open MPI project, “mpirun man page,” 2013. [Online]. Available: http://www.open-mpi.de/doc/v1.6/man1/mpirun.1.php#sect9 [36] Argonne National Laboratory, “Using the Hydra Process Manager,” 2014. [Online]. Available: http://wiki.mpich.org/mpich/index.php/ Using the Hydra Process Manager [37] B. E. Zant and M. Gagnaire, “Performance and Price Analysis for Cloud Service Providers,” in Science and Information Conference (SAI), 2015, pp. 816–822. [38] S. R. Freitas, K. M. Longo, M. A. F. Silva Dias, R. Chatfield, P. Silva Dias, P. Artaxo, M. O. Andreae, G. Grell, L. F. Rodrigues, A. Fazenda, and J. Panetta, “The Coupled Aerosol and Tracer Transport model to the Brazilian developments on the Regional Atmospheric Modeling System (CATT-BRAMS) – Part 1: Model description and evaluation,” Atmospheric Chemistry and Physics, vol. 9, no. 8, pp. 2843–2861, 2009.