Earth Syst. Sci. Data, 6, 285–295, 2014 www.earth-syst-sci-data.net/6/285/2014/ doi:10.5194/essd-6-285-2014 © Author(s) 2014. CC Attribution 3.0 License.
The GPCC Drought Index – a new, combined and gridded global drought index M. Ziese1 , U. Schneider1 , A. Meyer-Christoffer1 , K. Schamm1 , J. Vido1,* , P. Finger1 , P. Bissolli2 , S. Pietzsch3 , and A. Becker1 1 Deutscher
Wetterdienst, Global Precipitation Climatology Centre, 63067 Offenbach/M., Germany Wetterdienst, Regionale Klimaüberwachung, 63067 Offenbach/M., Germany 3 Deutscher Wetterdienst, Agrarmeteorologische Beratung, 63067 Offenbach/M., Germany * now at: Technical University Zvolen, Department of Natural Environment, 960 53 Zvolen, Slovakia 2 Deutscher
Correspondence to: M. Ziese (
[email protected]) Received: 27 March 2014 – Published in Earth Syst. Sci. Data Discuss.: 29 April 2014 Revised: 29 July 2014 – Accepted: 19 August 2014 – Published: 29 August 2014
Abstract. The Global Precipitation Climatology Centre Drought Index (GPCC-DI) provides estimations of
water supply anomalies with respect to long-term statistics. It is a combination of the Standardized Precipitation Index with adaptations from Deutscher Wetterdienst (SPI-DWD) and the Standardized Precipitation Evapotranspiration Index (SPEI). Precipitation data were taken from the Global Precipitation Climatology Centre (GPCC) and temperature data from NOAA’s Climate Prediction Center (CPC). The GPCC-DI is available with several accumulation periods of 1, 3, 6, 9, 12, 24 and 48 months for different applications. It is issued monthly starting in January 2013. Typically, it is released on the 10th day of the following month, depending on the availability of the input data. It is calculated on a regular grid with 1◦ spatial resolution. All accumulation periods are integrated into one netCDF file for each month. This data set is referenced by the doi:10.5676/DWD_GPCC/DI_M_100 and is available free of charge from the GPCC website ftp://ftp.dwd.de/pub/data/gpcc/html/gpcc_di_doi_download.html.
1
Introduction
Drought indices are a measure of the anomalies of available water with respect to long-term statistics. They can be based on station as well as on grid data, such as precipitation, temperature, wind speed, radiation and evaporation, but also on non-meteorological data, such as soil type, soil moisture or ground water level. It is common to classify three main conditions: drought, normal and wet. Drought conditions are refined as moderate, severe and extreme drought (Palmer, 1965). Drought indices allow us to distinguish easily between the different conditions. They provide information on the onset, end, length and severity of droughts. There are several types and definitions of droughts. Overall, droughts are defined as a shortage of available water (Heim, 2002; Wilhite and Glantz, 1985). In detail, droughts are, for example, defined as “a sustained extended deficiency Published by Copernicus Publications.
in precipitation” (WMO, 1986) or a “naturally occurring phenomenon that exists when precipitation has been significantly below normal recorded levels, causing serious hydrological imbalances that adversely affect land resource production systems” (UN, 1994). More definitions of drought are given, e.g., in Mishra and Singh (2010). The differences between aridity and drought have to be kept in mind (see also Mishra and Singh (2010)). For example, droughts are categorized as meteorological, agricultural or hydrological droughts, with a variety of definitions (Anderson et al., 2010; Heim, 2002; McKee et al., 1993; Wilhite and Glantz, 1985) for each category. They can also differ with regard to the time span of the water deficit. A precipitation deficit of 1 or 2 consecutive months usually has an impact on the agricultural yield, whereas longer lasting deficits have an impact on ground water levels and river runoffs (e.g., Sustek and Vido, 2013).
286 2
Some existing drought indices
Depending on the available data and the target application, specific drought indices were developed. Some of the most common are discussed in this section. A thorough review of drought indices is given in Heim (2002). One frequently utilized drought index is the Palmer Drought Severity Index (PDSI; Palmer, 1965). It is based on several empirical relationships. The PDSI uses precipitation, evapotranspiration, soil water recharge, runoff, water loss from soil and an empirical weighting factor (Lloyd-Hughes and Saunders, 2002). Also, the soil water storage capacity is needed. The evapotranspiration can be measured or calculated using several parameterizations. A strength of the PDSI lies in its high level of standardization. On the other hand, it is built on empirical relationships and comes with a high demand for input data that can hardly be addressed on the global scale (Lloyd-Hughes and Saunders, 2002). For monitoring purposes, not all necessary data for the PDSI are available on the global scale. Also, the aggregated temporal water deficit varies between regions within the PDSI (VicenteSerrano et al., 2010b). The self-calibrated PDSI (sc-PDSI) was developed by Wells et al. (2004) to avoid the abovementioned empirical relationships. Nevertheless, the number of necessary input data was not reduced. Another drought index is the Reconnaissance Drought Index (RDI; Tsakiris and Vangelis, 2005). It is based on the ratio of precipitation and potential evapotranspiration (PET). Again, the potential evapotranspiration can be calculated, applying several parameterizations, or measured (see Sect. 5). It is possible to standardize the RDI. However, the RDI is not defined if the PET is 0. The Standardized Precipitation Index (SPI) was developed by McKee et al. (1993). It is based on the anomaly of (monthly) precipitation divided by the standard deviation of precipitation for this time span (e.g., 1 month). Only precipitation data are needed, which is a big advantage. On the other hand, if the temperature changes due to climate change, the SPI does not have the ability to take the increased evapotranspiration into account. This also leads to misleading values in arid areas (Lloyd-Hughes and Saunders, 2002). An adjustment of the SPI by Deutscher Wetterdienst (DWD), called SPI-DWD, fixed this problem (Pietzsch and Bissolli, 2011). The usage of the SPI was recommended by WMO (2009). A user guide to the SPI is also given in WMO (2012). A recently developed drought index is the Standardized Precipitation Evapotranspiration Index (SPEI; VicenteSerrano et al., 2010a). It is based on the difference between precipitation and PET. As for the RDI and the PDSI, the calculation or measurement of the PET is the main challenge. The calculation of the SPEI is similar to the calculation of the SPI. The SPEI was suggested as an alternative to the SPI by WMO (2009).
Earth Syst. Sci. Data, 6, 285–295, 2014
M. Ziese et al.: GPCC Drought Index 3
Some existing drought index data sets and monitoring tools
There are a number of regional and global drought index data sets and monitoring tools. They differ in target region, input data, processing of input data (like regridding), utilized drought index, timeliness and the scope of the information and data provided (e.g., figures, bulletins or data files). Some of them are briefly described below, but this is not a comprehensive review. For instance, the “Drought Management Centre for Southeastern Europe” (DMCSEE) provides figures and bulletins based on the SPI for southeastern Europe (http:// www.dmcsee.org/en/drought_monitor/; last access: 9 December 2013). Precipitation data are taken from the GPCC (Global Precipitation Climatology Centre) and downscaled to a higher resolution of 0.01◦ . The data are available back to 1986. Another European drought data set is produced by the “Regional Climate Centre Network Offenbach Node on Climate Monitoring” (RCC-CM) for the WMO region RA VI (Europe and the Middle East). Maps and gridded data of the SPI-DWD (Pietzsch and Bissolli, 2011) are provided with 1◦ spatial resolution. Precipitation products of the GPCC were utilized (Pietzsch and Bissolli, 2011). The European Drought Observatory (EDO, http://edo. jrc.ec.europa.eu/edov2/php/index.php?id=1000; last access: 26 March 2014) provides drought-related information based on precipitation, temperature, soil moisture and vegetation response data for Europe. The analyses can be visualized as maps and time series for user-chosen locations. The time series can also be downloaded as text files, whereas the maps can be downloaded as graphs or GIS files (http://http://edo. jrc.ec.europa.eu/edov2/php/index.php?id=1165; last access: 28 May 2014). A comparison of several indicators is also possible on this website. Furthermore, the North American Drought Monitor (Lawrimore et al., 2002, http://www.ncdc.noaa.gov/ temp-and-precip/drought/nadm/index.php; last access: 26 March 2014) provides information on droughts for Mexico, the USA and Canada based on the SPI, PDSI and precipitation anomalies. Data can be downloaded as text files, including station-related data or maps. The US Drought Monitor provides drought information for the USA (Svoboda et al. (2002); http://droughtmonitor. unl.edu/Home.aspx; last access: 9 December 2013). It is based on meteorological observations as well as reports from observers. A monitoring tool for Australia is provided by the department of agriculture of the Australian Government (http:// www.daff.gov.au/abares/monitor/Pages/default.aspx; last access: 27 June 2014). Maps of total rainfall and percentiles as well as temperature analyses are provided, as are maps of the Normalized Difference Vegetation Index (NDVI; Tucker, 1979). www.earth-syst-sci-data.net/6/285/2014/
M. Ziese et al.: GPCC Drought Index
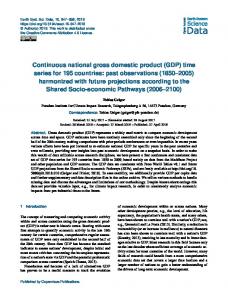
Figure 1. Monthly mean temperature in degrees Celsius for January 2014 from the NOAA NCEP CPC GHCN_CAMS gridded data set with the original 0.5◦ spatial resolution.
287
Figure 2. Monthly mean temperature in degrees Celsius as in
Fig. 1, but reduced to the GPCC grid with 1.0◦ spatial resolution.
4
The “SPEI Global Drought Monitor” provides global maps and gridded data of the SPEI with 0.5◦ spatial resolution (http://sac.csic.es/spei/; last access: 5 March 2014). There is a monitoring tool based on precipitation data from the GPCC and temperature data from the NOAA NCEP CPC GHCN_CAMS gridded data set (Fan and van den Dool, 2008). The estimation of the PET is based on the parameterization from Thornthwaite (1948). Additionally, an improved version for climatological applications is provided for 1901 to 2011, based on version 3.2 of the CRU (Climate Research Unit of the University of East Anglia) data set (Jones and Harris, 2013) with an enhanced estimation of the PET. One global drought monitor based on the SPI is provided by the International Research Institute for Climate and Society (http://iridl.ldeo.columbia.edu/SOURCES/ .IRI/.Analyses/.SPI/SOURCES/.IRI/.Analyses/.SPI/; last access: 25 March 2014). The spatial resolution is 2.5◦ . Several precipitation data sets are used as input data. Another global SPI data set with the same spatial resolution based on NOAA NCEP CPC CAMS_OPI monthly precipitation is also provided (http: //iridl.ldeo.columbia.edu/maproom/Global/Precipitation/ SPI.html?var=.SPI-CAMSOPI_12-Month#tabs-1; last access: 4 June 2014). The “Global Drought Portal Data” (http://gis.ncdc.noaa. gov/map/drought/Global#app=cdo; last access: 4 June 2014) provide gridded as well as station-based analyses on the SPI, soil moisture, precipitation percentiles and other parameters. Also, the “Global Integrated Drought Monitoring and Prediction System” (GIDMaPS; Hao et al., 2014) produce global analyses of the SPI and other drought-related indices. Additionally, predictions of drought conditions for the next months are provided.
Data used
The GPCC-DI (GPCC Drought Index) is based on gridded precipitation data and gridded monthly mean temperatures. Because of the high requirements regarding fast provision of data, only a limited number of data sets are currently available in the timely fashion necessary. The “First Guess Product” of the GPCC (Ziese et al., 2011, doi:10.5676/DWD_GPCC/FG_M_100) is available 3 to 5 days after the end of each month and used as precipitation input data. It is based on monthly totals calculated from SYNOP reports, interpolated to a regular grid with 1◦ spatial resolution using a modified SPHEREMAP scheme (Willmott et al., 1985) and a background climatology. A detailed description of the data set, data base and interpolation is given in Becker et al. (2013). Monthly mean temperatures were applied from the NOAA NCEP CPC GHCN_CAMS gridded data set (Fan and van den Dool, 2008), where the temperature data are taken from GHCN version 2 (Peterson and Vose, 1997) and CAMS (Ropelewski et al., 1984). Due to the higher timeliness of the CAMS data set (Fan and van den Dool, 2008), CAMS is more important for the drought index calculation. The station data are interpolated by means of a Cressman-based objective analysis scheme and a background climatology. The temperature data are delivered originally with 0.5◦ spatial resolution (see Fig. 1). The resolution of the original CPC data is reduced by means of a land portion and area weighting to match the 1◦ GPCC grid. This leads to a slight smoothing of spatial temperature peaks (see Fig. 2). 5
How to calculate the GPCC-DI
The calculation of the GPCC-DI is based on the abovementioned gridded data sets. We decided to use gridded data as input data and not station data because, for both data sets, a www.earth-syst-sci-data.net/6/285/2014/
Earth Syst. Sci. Data, 6, 285–295, 2014
288
M. Ziese et al.: GPCC Drought Index
Figure 3. The SPI-DWD for January 2014 with 1-month accumu-
Figure 4. The SPI-DWD for January 2014 with 3-month aggrega-
lation interval. Green means normal precipitation, blue wetter than normal and red drier than normal (drought). Grid cells without data are white.
tion interval. The color scale is the same as in Fig. 3.
lot of efforts have been spent to reach a high-quality level. Also, we think an interpolation of station-based drought indices is more error prone than the calculation based on gridded data. Additionally, station data suffers from gaps in time series due to the relocation, opening and closing of stations. The calculation of the GPCC-DI takes place in two steps. First, the SPI-DWD and SPEI are calculated independently on the grids where possible. Afterwards, the GPCC-DI is computed using the mean of both indices for each grid cell, where both indices are valid. For the other grid cells, the index that can still be calculated is taken. Although the DWD adaptation of the SPI (Pietzsch and Bissolli, 2011) was taken into account, the SPI-DWD cannot be computed in very arid regions. This is because the applied gamma distribution to describe the distribution of the precipitation amounts does not have a shape with a maximum above 0, which is necessary to calculate the SPI (see also Wu et al., 2007). Examples of the SPI-DWD with accumulation intervals of 1, 3 and 6 months are depicted in Figs. 3, 4 and 5. Green indicates precipitation around normal and blue precipitation above normal. Droughts occur in red areas, where precipitation is below normal. Grids without data are white. These areas are the oceans and Antarctica as well as areas where the SPI-DWD cannot be calculated due to the abovementioned limitations of the applied gamma function (see also Sect. 5). The PET is computed according to the algorithm from Thornthwaite (1948). This algorithm sets PET equal to 0 mm month−1 in areas where the mean temperature is near or below 0 ◦ C (see Fig. 6 and Figs. 1 and 2). But evapotranspiration also takes place at temperatures below 0 ◦ C. Some work-arounds exist that solve this problem by assuming arbitrary values for the PET, such as 1 mm month−1 or even lower values. Although other parameterizations for the computation of the PET exist, such as the FAO Penman–Monteith Earth Syst. Sci. Data, 6, 285–295, 2014
Figure 5. The SPI-DWD for January 2014 with 6-month accumulation interval. The color scale is the same as in Fig. 3.
equation (Allen et al., 1998), they need more input data than temperature and astronomical data. To our knowledge, no data sets exist that provide, for example, wind speed, radiation or humidity (dew point) with the same high timeliness, global coverage and spatial resolution as the applied temperature data set. Also, existing PET data sets are not applicable because they are provided as figures or files unemployable for further automated usage (e.g., http://earlywarning.usgs. gov/fews/global/index.php; last access: 9 December 2013). To estimate the SPEI, the PET data and precipitation data described above are utilized. In areas, where the PET is set to 0 mm month−1 , the SPEI is also not computed. This occurs north of roughly 30◦ N and south of about 50◦ S. Examples of the computed SPEI are shown in Figs. 7, 8 and 9 for 1-, 3and 6-months accumulation intervals. The color scale is the same as for the SPI (see Fig. 3), whereas droughts also occur if PET is above normal and precipitation is roughly normal (under normal conditions of the SPI-DWD). As mentioned above, the gridwise combination of the SPI-DWD and SPEI yields the GPCC-DI. Examples of the www.earth-syst-sci-data.net/6/285/2014/
M. Ziese et al.: GPCC Drought Index
289
Figure 6. PET calculated according to Thornthwaite (1948) for January 2014.
Figure 8. The SPEI with 3-month aggregation interval for January 2014. The color scale is the same as in Fig. 3.
Figure 7. The SPEI with 1-month accumulation interval for Jan-
Figure 9. The SPEI with 6-month aggregation interval for January 2014. The color scale is the same as in Fig. 3.
uary 2014. The color scale is the same as in Fig. 3.
GPCC-DI with accumulation periods of 1, 3 and 6 months are shown in Figs. 10, 11 and 12. The combination is possible due to the comparable indications of both indices (see for example Figs. 3, 7 and 10). A nearly global coverage is possible by the combination of both drought indices. Otherwise the one which can be computed is applied. Only cold arid areas cannot be covered with this approach (e.g., Tibet). The main improvement of the GPCC-DI is that it uses nearly no assumptions in comparison to other globally applied drought indices. It combines two existing indices in such a manner that both can be used in an optimal way without arbitrary settings, such as PET = 1 mm month−1 for temperatures below 0 ◦ C. How to calculate the parameters for the SPI-DWD and SPEI
To estimate the parameters of the distribution function of the SPI-DWD and SPEI, data from the reference period 1961 to 1990 were used, because this is currently the offiwww.earth-syst-sci-data.net/6/285/2014/
cial WMO reference period (see http://www.wmo.int/pages/ themes/climate/climate_data_and_products.php; last access: 4 June 2014). Temperature data were taken from the abovementioned temperature data set, regridded to the GPCC grid with 1◦ spatial resolution. Due to its higher data coverage and the more rigorous quality control applied, the Full Data Reanalysis Version 6 with 1◦ spatial resolution was utilized for the precipitation parameterization (Schneider et al., 2011, doi:10.5676/DWD_GPCC/FD_M_V6_100). The parameters for precipitation and PET were calculated separately for each grid box and accumulation interval. Depending on the parameters of the gamma distribution used, the distribution has a maximum at or above 0. Parameter sets leading to a maximum of the distribution at 0 cannot be applied in order to compute reliable SPI-DWD values (see for example Lloyd-Hughes and Saunders (2002) and Wu et al. (2007)). This occurs in areas with monthly mean precipitation of about 0 mm. Due to the aggregation of several months for the longer accumulation periods, the mean precipitation total for this period can result in a maximum of the Earth Syst. Sci. Data, 6, 285–295, 2014
290
M. Ziese et al.: GPCC Drought Index
Figure 10. The GPCC-DI with 1-month aggregation interval for
Figure 12. The GPCC-DI with 6-month accumulation interval for
January 2014. The color scale is the same as in Fig. 3.
January 2014. The color scale is the same as in Fig. 3. Table 1. Interpretation of GPCC-DI values, adapted from Lloyd-
Hughes and Saunders (2002).
Figure 11. The GPCC-DI with 3-month accumulation interval for January 2014. The color scale is the same as in Fig. 3.
distribution above 0, even if some months of this period have monthly totals of 0 mm. Therefore, the SPI-DWD could be calculated for some grid cells only for the longer sampling intervals, for instance in arid regions in India, China, Mongolia, southern and Central Africa or southern and Central America (see Figs. 3, 4 and 5). 6
How to interpret the index
The provided drought index is a standardized anomaly of available water. The value of the index corresponds to the σ value of a standardized normal distribution and can be interpreted as the SPI (see Table 1, Lloyd-Hughes and Saunders (2002)). Negative values correspond to precipitation totals less than normal or precipitation roughly normal but PET highly above normal – drought – whereas positive values conform with precipitation totals wetter than normal and/or PET below normal. Values between −1 and 1 match the 1σ environment and are defined as normal conditions or mild drought/wet. Earth Syst. Sci. Data, 6, 285–295, 2014
7
GPCC-DI value
Category
2.00 or more 1.50 to 1.99 1.00 to 1.49 0.00 to 0.99 −0.99 to 0.00 −1.00 to −1.49 −1.50 to −1.99 −2.00 or less
Extremely wet Severely wet Moderately wet Mildly wet Mild drought Moderate drought Severe drought Extreme drought
Comparison of the GPCC-DI with other SPI and SPEI data sets
The performance of the GPCC-DI was compared with the SPEI and the SPI from the European Drought Observatory (hereafter referred to as SPI-EDO) for January, February and August 2003. The year 2003 was characterized by several months with precipitation deficits in Europe and a large heat wave in August in central Europe (see, e.g., Schär et al., 2004). Whereas January was characterized by normal to above normal precipitation in most regions of Europe, February and August had large precipitation deficits in most regions of Europe. The SPEI data set Version 2.2 (see http://sac.csic.es/spei/ database.html; last access: 3 June 2014; data downloaded on 16 April 2014) is based on precipitation and PET data from the CRU TS 3.2 data set (Harris et al., 2014). The calibration period for the parameters is 1950 to 2010 (see http://sac.csic. es/spei/map/maps.html; last access: 3 June 2014). The SPI-EDO uses input data from the GPCC product suite (for 2003, the Full Data Reanalysis, doi:10.5676/DWD_GPCC/FD_M_V6_100) and E-OBS with a reference period from 1971 to 2010 (see http://edo. jrc.ec.europa.eu/documents/factsheets/factsheet_spi.pdf; last www.earth-syst-sci-data.net/6/285/2014/
M. Ziese et al.: GPCC Drought Index
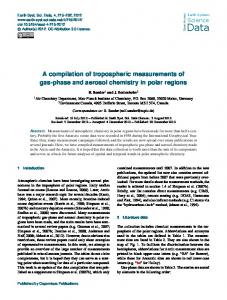
access: 2 June 2014). The SPI-EDO data were provided by Alfred de Jager on 20 May 2014 (personal communication). For January 2003, the GPCC-DI, SPEI and SPI-EDO indicate normal to wetter than normal conditions over Europe. Precipitation deficits occurred in Spitsbergen, the southeast of Sweden, the Caucasus Mountains, Ireland, Belarus, Ukraine, Russia and the Mediterranean coast of Spain, France and northern Italy. As depicted in Fig. 13, the GPCCDI detected drought conditions (GPCC-DI < −1) in Spitsbergen, Sweden, the Caucasus Mountains, northern Italy, Belarus and Russia. Additionally, the GPCC-DI detected drier than normal conditions (−1 < GPCC-DI < 0) in many regions in northern and eastern Europe and the western Mediterranean coast of Europe. Drought conditions were detected by the SPEI (SPEI < −1) for Spitsbergen, Ireland, Belarus, Russia, the Caucasus Mountains and Turkey. Drier than normal conditions were indicated by the SPEI (−1 < SPEI < 0) for Turkey, Belarus, northern Italy and the southern part of the Iberian Peninsula. The SPI-EDO detected drought conditions (SPI-EDO < −1) in Sweden, Ireland, Russia, Turkey, the Caucasus Mountains and east of the Caspian Sea. Drier than normal conditions (−1 < SPIEDO < 0) were detected in northern and eastern Europe and northern Italy. Spitsbergen is outside the monitoring area of the European Drought Observatory. The SPEI detected no drought conditions in Sweden and detected such conditions to a lesser extend than the GPCC-DI and SPI-EDO in Russia and Belarus. Also, larger parts of northern and eastern Europe were detected as drier than normal by the SPI-EDO and GPCC-DI than by the SPEI. The SPEI detected wetter than normal conditions in Scandinavia, where the GPCC-DI and SPI-EDO detected drier than normal conditions. Drought conditions were detected for Ireland by the SPEI and SPIEDO, whereas the GPCC-DI detected drier than normal conditions. As shown in Fig. 14, the GPCC-DI for February 2003 detected drought conditions in central Europe from Great Britain to the Baltic and from northern Italy to Scandinavia and in the western parts of Russia. Drought conditions were detected by the SPEI from central Europe to the Baltic, excluding, roughly, the Alps and central Germany, Scotland, central Scandinavia and western parts of Russia. The SPIEDO detected drought conditions for the same regions as the SPEI with some differences in the Czech Republic, France, Norway, Germany, Italy and Austria. Opposing detections, such as in January 2003, were not observed. In August 2003, precipitation deficits were related to a heat wave in central Europe, as mentioned above. Drought conditions (see Fig. 15) were detected by the GPCC-DI for the British Isles, the Mediterranean and Atlantic coast of France, the Netherlands, central Germany, some regions of Poland, the Czech Republic, Slovakia and Spain, as well as from Italy to Romania and also from eastern Greece to Turkey. Also, the SPI-EDO detected drought conditions in similar regions with some differences (mostly to a lesser extent) in Spain, www.earth-syst-sci-data.net/6/285/2014/
291
Figure 13. Comparison of the GPCC-DI (top), SPEI (middle)
and SPI-EDO (bottom) with 1-month aggregating interval for January 2003. The color scale is the same as in Fig. 3.
Earth Syst. Sci. Data, 6, 285–295, 2014
292
M. Ziese et al.: GPCC Drought Index
France, Italy, Scandinavia, Poland, former Yugoslavia, Hungary, Romania, Bulgaria, Greece and Turkey. Opposite detections occur in the southern parts of the Iberian Peninsula and in Scandinavia. The SPEI detected drought conditions in a belt from the British Isles and France to Romania and Hungary, in Italy, southern France and the southern parts of the Iberian Peninsula. As with the GPCC-DI, the drought detection in Spain and Portugal is the opposite of that of SPI-EDO. In summary, the three compared drought indices give comparable results, but in the details there are some differences. Overall, the GPCC-DI and the SPI-EDO are more drought prone in January and February 2003 than the SPEI. On the other hand, in August 2003 the SPEI detected a much larger area suffering from drought than the SPI-EDO and GPCCDI. This seems to be an effect of the larger influence of the PET (resulting from the temperature) in the SPEI than in the GPCC-DI, whereas the SPI-EDO does not take PET into account. Smaller differences in the detection occur due to the different applied data sets for precipitation and temperature and also due to the different reference periods for the parameter calculations, as mentioned above.
8
Figure 14. Comparison of the GPCC-DI (top), SPEI (middle) and SPI-EDO (bottom) with 1-month aggregating interval for February 2003. The color scale is the same as in Fig. 3.
Earth Syst. Sci. Data, 6, 285–295, 2014
Access to the GPCC-DI
The GPCC-DI can be downloaded as netCDF files (net, 2014) from the DOI-referenced website ftp://ftp.dwd.de/pub/ data/gpcc/html/gpcc_di_doi_download.html. No registration is required to download the data. The file for each month contains seven sets of GPCC-DI data for the different aggregation intervals. These aggregation intervals are 1, 3, 6, 9, 12, 24 and 48 months. The GPCCDI is provided on a regular, not a projected global grid (−180 to 180◦ longitude and −90 to 90◦ latitude) with a 1◦ latitude by longitude grid size. One zipped netCDF file has about 235 KB. NetCDF is a standardized, self-describing binary file format (net, 2014). In the header of each netCDF file the coordinates of each grid cell and missing values are encoded. We reference the coordinates to the center of each grid cell. The missing value is −99 999.99, but can be visualized with other values by visualizing software. Suitable software to analyze and convert netCDF files is listed on the GPCC-DI website ftp://ftp.dwd.de/pub/data/gpcc/html/ gpcc_di_doi_download.html. Table 2 summarizes the applied grid and Table 3 the variables in the netCDF file. The release of the DOI references implies that ISO 19115 compliant metadata are provided under web addresses constructed from the DOI proceeded by http://data.datacite.org. In addition, this product will also be included in the data set catalogue of the Climate Data Centre (CDC) of Deutscher Wetterdienst (DWD), which disseminates ISO 19139 compliant metadata on its data sets through the GeoNetwork software application. www.earth-syst-sci-data.net/6/285/2014/
M. Ziese et al.: GPCC Drought Index
293 Table 2. Properties of the grid used.
Property
Value
Gridtype Gridsize Xname Xlongname Xunits Yname Ylongname Yunits Xsize Ysize Xfirst Xinc Yfirst Yinc
Lonlat 64 800 Lon Longitude Degrees east Lat Latitude Degrees north 360 180 −179.50 1.0 −89.50 1.0
The data set is regularly updated on the 10th day of each month. It can be delayed if input data are not available in time. In this case, it will be delivered upon availability of the missing data. As the precipitation and temperature data used are not homogenized, the resulting GPCC-DI is also not homogeneous. With its high timeliness it is designed for monitoring purposes, but, owing to the non-homogeneous input data, it cannot be applied for climatological analyses (such as studies related to trends in the occurrence of droughts). 9
Figure 15. Comparison of the GPCC-DI (top), SPEI (middle)
and SPI-EDO (bottom) with 1-month aggregating interval for August 2003. The color scale is the same as in Fig. 3.
www.earth-syst-sci-data.net/6/285/2014/
Conclusions
The Global Precipitation Climatology Centre Drought Index (GPCC-DI) is a new gridded drought index with nearly global coverage. It is a combination of the SPI-DWD and SPEI and based on precipitation analyses from the Global Precipitation Climatology Centre (GPCC) and temperature data from the NOAA NCEP CPC. The spatial resolution is 1◦ latitude by longitude. Seven accumulation intervals are provided – 1, 3, 6, 9, 12, 24 and 48 months – to cover several applications, from meteorological droughts to hydrological droughts. All accumulation intervals are summarized in one downloadable netCDF file (ftp://ftp.dwd.de/pub/ data/gpcc/html/gpcc_di_doi_download.html). The download is free of charge and no registration is required. Due to limitations in the validity range of the underlying drought indices, the GPCC-DI cannot be provided for cold arid areas like the Southern Andes and the Himalayas, i.e., in regions with difficult environmental conditions. The GPCC-DI is available going back to January 2013. If the input data are available, the data set is updated regularly on the 10th of each month. It should only be used for monitoring purposes because the input data are not homogenized. Therefore, we don’t recalculate the data set for earlier years.
Earth Syst. Sci. Data, 6, 285–295, 2014
294
M. Ziese et al.: GPCC Drought Index
Table 3. Description of the variables used in the netCDF files. Name
Description
di_01 di_03 di_06 di_09 di_12 di_24 di_48
Global Precipitation Climatology Centre Drought Index version 1, aggregation time 1 month Global Precipitation Climatology Centre Drought Index version 1, aggregation time 3 months Global Precipitation Climatology Centre Drought Index version 1, aggregation time 6 months Global Precipitation Climatology Centre Drought Index version 1, aggregation time 9 months Global Precipitation Climatology Centre Drought Index version 1, aggregation time 12 months Global Precipitation Climatology Centre Drought Index version 1, aggregation time 24 months Global Precipitation Climatology Centre Drought Index version 1, aggregation time 48 months
Acknowledgements. First of all, we are most grateful to the data
suppliers, who are mostly the worldwide National Meteorological and/or Hydrological Services, but also other institutes. These data contributions have put the GPCC in the position to provide the underlying global precipitation analyses applied for the described data set, and we are looking forward to their further contributions, which are crucial in order to maintain and enhance the level of the GPCC’s products in terms of scope and quality. We would also like to thank NOAA NCEP CPC for providing the NOAA NCEP CPC GHCN_CAMS gridded data set and their permission to use these data. We want also thank three anonymous reviewers and Alfred de Jager for their comments to improve the article. Edited by: D. Carlson
References Allen, R., Pereira, L., Raes, D., and Smith, M.: Crop evapotranspiration – Guidelines for computing crop water requirements – FAO Irrigation and drainage paper 56, FAO – Food and Agriculture Organization of the United Nations, http://www.fao.org/docrep/ X0490E/x0490e00.htm#Contents, ISBN 92-5-104219-5, 1998. Anderson, M. C., Hain, C., Wardlow, B., Pimstein, A., Mecikalski, J. R., and Kustas, W. P.: Evaluation of Drought Indices based on thermal remote sensing of evapotranspiration over the Continental United States, J. Climate, 24, 2025–2044, doi:10.1175/2010JCLI3812.1, 2010. Becker, A., Finger, P., Meyer-Christoffer, A., Rudolf, B., Schamm, K., Schneider, U., and Ziese, M.: A description of the global land-surface precipitation data products of the Global Precipitation Climatology Centre with sample applications including centennial (trend) analysis from 1901–present, Earth Syst. Sci. Data, 5, 71–99, doi:10.5194/essd-5-71-2013, 2013. Fan, Y. and van den Dool, H.: A global monthly land surface air temperature analysis for 1948–present, J. Geophys. Res., 113, D01103, doi:10.1029/2007JD008470, 2008. Hao, Z., AghaKouchak, A., Nakhjiri, N., and Farahmand, A.: Global integrated drought monitoring and prediction system, Scientific Data, doi:10.1038/sdata.2014.1, 2014. Harris, I., Jones, P., Osborn, T., and Lister, D.: Updated high-resolution grids of monthly climatic observations, the CRU TS3.10 Dataset, Int. J. Climatol., 34, 623–642, doi:10.1002/joc.3711, 2014. Heim, R. R.: A review of twentieth-century Drought Indices used in the United States, B. Am. Meteorol. Soc., 83, 1149–1165, 2002.
Earth Syst. Sci. Data, 6, 285–295, 2014
Jones, P. and Harris, I.: University of East Anglia Climatic Research Unit (CRU), CRU TS3.20: Climatic Research Unit (CRU) Time-Series (TS) Version 3.20 of High Resolution Gridded Data of Month-by-Month Variation in Climate (January 1901–December 2011), available at: http://badc.nerc.ac.uk/view/badc.nerc.ac.uk__ATOM_ _ACTIVITY_3ec0d1c6-4616-11e2-89a3-00163e251233, last access: 1 November 2013. Lawrimore, J., Heim, R. R., Svoboda, M., Swail, V., and Englehart, P. J.: Beginning a new era of drought monitoring across North America, B. Am. Meteorol. Soc., 83, 1191–1192, 2002. Lloyd-Hughes, B. and Saunders, M. A.: A drought climatology for Europe, Int. J. Climatol., 22, 1571–1592, doi:10.1002/joc.846, 2002. McKee, T., Doesken, N., and Kleist, J.: The Relationship of Drought Frequency and Duration to Time Scales, Eighth Conference on Applied Climatology, available at: http://ccc.atmos.colostate. edu/relationshipofdroughtfrequency.pdf (last access: 11 May 2012), 1993. Mishra, A. K. and Singh, V. P.: A review of drought concepts, J. Hydrol., 391, 202–216, doi:10.1016/j.jhydrol.2010.07.012, 2010. NetCDF Overview, available at: http://www.unidata.ucar.edu/ software/netcdf/, last access: 25 March 2014. Palmer, W. C.: Meteorological Drought, Research paper no. 45, available at: http://www.ncdc.noaa.gov/temp-and-precip/ drought/docs/palmer.pdf (last access: 14 February 2012), 1965. Peterson, T. C. and Vose, R. S.: An overview of the Global Historical Climatology Network Temperature Database, B. Am. Meteorol. Soc., 78, 2837–2849, doi:10.1175/15200477(1997)0782.0.CO;2, 1997. Pietzsch, S. and Bissolli, P.: A modified drought index for WMO RA VI, Adv. Sci. Res., 6, 275–279, doi:10.5194/asr-6-275-2011, 2011. Ropelewski, C. F., Janowiak, J. E., and Halpert, M. S.: The Climate Anomaly Monitoring System (CAMS), Climate Analysis Center, NWS, NOAA, 1984. Schär, C., Vidale, P. L., Lüthi, D., Frei, C., Häberli, C., Liniger, M. A., and Appenzeller, C.: The role of increasing temperature variability in European summer heatwaves, Nature, 427, 332– 336, doi:10.1038/nature02300, 2004. Schneider, U., Becker, A., Finger, P., Meyer-Christoffer, A., Rudolf, B., and Ziese, M.: GPCC Full Data Reanalysis Version 6.0 at 1.0◦ : Monthly Land-Surface Precipitation from Rain-Gauges built on GTS-based and Historic Data, doi:10.5676/DWD_GPCC/FD_M_V6_100 (last access: 20 March 2014), 2011.
www.earth-syst-sci-data.net/6/285/2014/
M. Ziese et al.: GPCC Drought Index Sustek, Z. and Vido, J.: Vegetation state and extreme drought as factors determining differentiation and succession of Carabidae communities in forests damaged by a windstorm in the High Tatra Mts, Biologia, 68, 1198–1210, doi:10.2478/s11756-0130268-1, 2013. Svoboda, M., LeComte, D., Hayes, M., Heim, R., Gleason, K., Angel, J., Rippey, B., Tinker, R., Palecki, M., Stooksbury, D., Miskus, D., and Stephens, S.: The Drought Monitor, B. Am. Meteorol. Soc., 83, 1181–1190, 2002. Thornthwaite, C.: An approach towards a rational classification of climate, Geogr. Rev., 38, 55–94, 1948. Tsakiris, G. and Vangelis, H.: Establishing a Drought Index Incorporating Evapotranspiration, European Water, 9/10, 3–11, http: //ewra.net/ew/pdf/EW_2005_9-10_01.pdf (last access: 10 May 2012), 2005. Tucker, C. J.: Red and photographic infrared linear combinations for monitoring vegetation, Remote Sens. Environ., 8, 127–150, 1979. UN Secretariat General: United Nations Convention of Combat Drought and Desertification in Countries Experiencing Serious Droughts and/or Desertification, Particularly in Africa, 1994. Vicente-Serrano, S. M., Begueria, S. A. S., and Lopez-Moreno, J. I.: A multiscalar Drought Index sensitive to global warming: the standardized precipitation evapotranspiration index, J. Climate, 23, 1696–1718, doi:10.1175/2009JCLI2909.1, 2010a. Vicente-Serrano, S. M., Begueria, S., Lopez-Moreno, J. I., Angulo, M., and El Kenawy, A.: A New Global 0.5◦ Gridded Dataset (1901–2006) of a Multiscalar Drought Index: Comparison with Current Drought Index Datasets Based on the Palmer Drought Severity Index, J. Hydrometeorol., 11, 1033–1043, doi:10.1175/2010JHM1224.1, 2010b.
www.earth-syst-sci-data.net/6/285/2014/
295 Wells, N., Goddard, S., and Hayes, M. J.: A Self-Calibrating Palmer Drought Severity Index, J. Climate, 17, 2335–2351, 2004. Wilhite, D. A. and Glantz, M. H.: Understanding: the drought phenomenon: the role of definitions, Water Int., 10, 111–120, doi:10.1080/02508068508686328, 1985. Willmott, C., Rowe, C., and Philpot, W.: Small-scale climate maps: a sensitivity analysis of some common assumptions associated with grid-point interpolation and contouring, Am. Carthographer, 12, 5–16, 1985. WMO: Report on Drought and Countries Affected by Drought During 1974–1985, 1986. WMO: Lincoln Declaration on Drought Indices, available at: http://www.wmo.int/pages/prog/wcp/agm/meetings/wies09/ documents/Lincoln_Declaration_Drought_Indices.pdf (last access: 1 November 2013), 2009. WMO: Guide to Meteorological Instruments and Methods of Observation, 8, World Meteorological Organization, available at: http://library.wmo.int/pmb_ged/wmo_8_en-2012.pdf (last access: 1 November 2013), 2012. Wu, H., Svoboda, M. D., Hayes, M. J., Wilhite, D. A., and Wen, F.: Appropriate application of the standardized precipitation index in arid locations and dry seasons, Int. J. Climatol., 27, 65–79, doi:10.1002/joc.1371, 2007. Ziese, M., Becker, A., Finger, P., Meyer-Christoffer, A., Rudolf, B., and Schneider, U.: GPCC First Guess Product at 1.0◦ : Near Real-Time First Guess monthly Land-Surface Precipitation from Rain-Gauges based on SYNOP Data, doi:10.5676/DWD_GPCC/FG_M_100, available at: ftp://ftp. dwd.de/pub/data/gpcc/html/gpcc_firstguess_doi_download.html (last access: 20 March 2014), 2011.
Earth Syst. Sci. Data, 6, 285–295, 2014