EUROGRAPHICS 2008
STAR – State of The Art Report
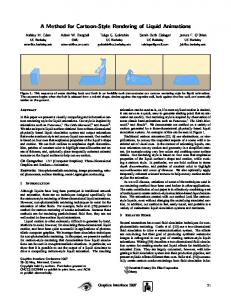
The Role of Perception for Computer Graphics Dirk Bartz1 , Douglas Cunningham2 , Jan Fischer 3 , and Christian Wallraven 4 1 University
of Leipzig, Germany of Tübingen, Germany 3 University of Victoria, Canada 4 Max-Planck-Institute for Biological Cybernetics, Tübingen, Germany 2 University
Abstract Traditionally, computer graphics strived to achieve the technically best representation of the scenario or scene. For rendering, this lead to the preeminence of representations based on the physics of light interacting with different media and materials. Research in virtual reality has focussed on interactivity and therefore on real-time rendering techniques that improve the immersion of users in the virtual environments. In contrast, visualization has focused on representations that that maximizes the information content. In most cases, such representations are not physically-based, requiring instead more abstract approaches. Recently, the increasing integration of the extensive knowledge and methods from perception research into computer graphics has fundamentally altered both fields, offering not only new research questions, but also new ways of solving existing issues. Against this backdrop of an increasing importance of perceptual research in all areas related to computergenerated imagery, we discuss the state of the art of perception in computer graphics. Categories and Subject Descriptors (according to ACM CCS): H.5.2 [Information Interfaces and Presentation]: User Interfaces, Evaluation/Methodology I.3.7 [Computer Graphics]: Three-Dimensional Graphics and Realism J.4 [Social and Behavioral Sciences]: Psychology and Perception
1. Introduction Traditionally, computer graphics strived to achieve the technically best representation of the scenario or scene. For rendering, this lead to the preeminence of representations based on the physics of light interacting with different media and materials. Research in virtual reality has focussed on interactivity and therefore on real-time rendering techniques that improve the immersion of users in the virtual environments. In contrast, visualization has focused on representations that that maximizes the information content. In most cases, such representations are not physically-based, requiring instead more abstract approaches. Recently, the increasing integration of the extensive knowledge and methods from perception research into computer graphics has fundamentally altered both fields, offering not only new research questions, but also new ways of solving existing issues. In rendering, for example, the integration can lead to the targeted allocation of computing resources to aspects of a scene that matter most for human c The Eurographics Association 2008.
observers [OHM∗ 04]. In visualization, the manner in which information is presented is now often driven by knowledge of low-level cues (e.g., preattentive features). Assumptions about how to best present information are evaluated by a psychophysical experiment. This same trend towards perceptually driven research has perhaps had the longest tradition in virtual reality, where the user’s response to specific interaction and rendering techniques is examined using a variety of methods.
Here, we will discuss how perception is used in the three major subfields of computer graphics to improve representation and interaction quality or provide a better resource consumption. The STA-report is organized into four parts (see Table 1). After the introductory part (Section 2) on the fundamentals of psychophysics, three application areas in computer graphics are discussed. In particular, we will discuss virtual reality (Section 3), rendering and animation (Section 4), and finally visualization (Section 5).
D. Bartz, D. Cunningham, J. Fischer, C. Wallraven / Perceptional Graphics
Presenter Cunningham Fischer Wallraven Bartz
Topic Fundamentals of Perception and Psychophysics Perception and Virtual Reality Perception and Rendering/Animation Perception and Visualization
2. Fundamentals of Perception and Psychophysics Imagine closing your eyes, inserting earplugs, and then trying to use a computer mouse to navigate through an unfamiliar virtual room or to pick up a virtual object. It is very unlikely that you will be successful. Without being able to see, hear, smell, taste, and feel the world around us, it would be nearly impossible to effectively interact with it. Indeed, without any input from the world, you would not be able to acquire new information. This has lead some philosophers to consider whether perception might be the source of all knowledge (e.g., [Kan03]). Regardless, it is clear that perception is central to the survival of most organisms. The goal of perception research, in general, is to understand how organisms (anything from flies to humans) process physical variations in the world to extract different patterns, and then subsequently interpret and use that information. After over 150 years of systematic, empirical research on perception, it is clear that no organism has a perceptual system that tries to create an exact representation of the world. All perceptual systems make a number of sometimes extreme shortcuts. As a result, organisms often perceive things to be very different than they really are. This is particularly true when the perceptual systems are placed in unusual circumstances (i.e., where the heuristics are no longer appropriate). In other words, perceptual reality is not the same thing as physical reality. Perception researchers have a long tradition of using visual illusions to demonstrate the different shortcuts and assumptions that the visual system uses. Here, we highlight three specific characteristics, focusing on how perceptual and physical reality differ. First, humans often see something in a manner that completely contradicts the physics of a scene. The classic example of this is the Café Wall Illusion, originally discovered by Gregory and Heard [GH79] (see Fig. 1). Most people insist that the lines are not parallel, when they in fact are. Second, humans often see things that are not there. One classic example of this comes from illusory contours, originally reported by Kanizsa [Kan55, Kan79]. Notice that in Figure 2 a triangle can be clearly seen in front of 3 circles. Physically, however, the image only contains 3 partial circles. Sharp, clearly defined contours can be seen between the circles, in a region that is in fact physically homogeneous. In other words, perception can add to reality. Third, the act of processing visual input can add structure
Figure 1: The café wall illusion. Are the lines parallel?
Figure 2: The Kanizsa triangle. Note that the edges of the triangle can be seen even between the 3 circles, although no edges are physically present there.
or organization. The concept of perceptual organization was critical to the Gestalt Psychologists, who formulated a number of laws describing how we perceptually structure information [Kof35, Köh29]. One classic example of this is how we group items in a regular grid (see Fig. 3). In Figure 3(a), the items that are closest together are grouped, giving the impression of a series of columns. When every other square in a column is changed to a circle (Fig. 3(b)), the items are grouped by similarity, giving rise to the impression of a series of rows). This type of addition to an image is often referred to as an “emergent property”, since none of the elements in the image contain, by themselves, any aspect of the addition. A clearer example of emergent properties can be seen in Figure 4, where a triangle (made up of a series of circles) can clearly be seen. Critically, none of the individual circles have anything “triangle like” about them. The triangle is an emergent property, caused by the interaction of elements. In other words, perceptual processing can combine neighboring elements into objects or effects that may or may not have been intended. The number of recognized illusions is very large, and new ones are discovered every year. Different illusions point out different heuristics, assumptions, and shortcuts. Failure to pay attention to the innate properties of a perceptual system will almost guarantee that any synthetic image or simulation will produce unintended perceptual effects. c The Eurographics Association 2008.
D. Bartz, D. Cunningham, J. Fischer, C. Wallraven / Perceptional Graphics
(a)
(b)
Figure 3: Grouping: by proximity (a) and by similarity (b)
In order to infer the non-observable properties of perception processes from the observable patterns of stimulation and behaviour, psychophysics requires absolute control over as many factors as possible. Without this degree of rigour, the results end up not only being extremely difficult to model, they are often not even (uniquely) interpretable. One needs, then, to know exactly what is shown, when and how it is shown, and to whom it is shown. One also needs to design the task so that only the processes one is interested in are involved. In particular, the tasks should not be influenced by higher mental functions (like the application of strategies). It should not be surprising, then that perception research has traditionally been conducted using rather abstract stimuli (such as simple lines or isolated objects). There are at least four critical advantages such stimuli:
Figure 4: An emergent triangle made of a series of dots.
Taking advantage of them, on the other hand, can lead to much more efficient algorithms. Recently, a number of researchers have made targeted use of perceptual shortcuts to produce what are sometimes referred [OHM∗ 04] to as “perceptually adaptive” computer graphics algorithms (see, e.g., [BM98, GIS03, OD01, PFFG98, VMKK00]). While illusions make for nice demonstrations, they do not answer the question of how one can systematically study perception. Perhaps the central difficulty in the study of perception is that we have no direct access to any stage of it. It is undeniably subjective. If perception cannot be publicly observed, how can it be studied? The answer lies primarily in realising that perception must, to some degree, influence an organism’s behaviour. Therefore, under the proper circumstances, we can use an organism’s behavior to infer properties of the hidden mechanisms of perception. 2.1. Perception Research and Psychophysics In the mid 1800’s a physicist by the name of Gustaf Theodor Fechner developed a set of techniques, resting on some very strict assumptions, that allow one to systematically and objectively study the hidden mechanisms of perception [Fec60]. This methodology is called “psychophysics”, and has as its central goal the empirical study and mathematical description of the functional relationships between physical stimulation and sensory or perceptual responses. Since its introduction, the success of psychophysics has lead to a natural evolution of the techniques. Moreover, some of the assumptions have been relaxed, expanded, or ignored, giving rise to the more general field of perception research. c The Eurographics Association 2008.
• They can be exactly reproduced as often as one wishes. This allows one to test different people’s responses to identical stimuli, as well as to retest anyone’s response. • They can be perfectly described mathematically. This allows one to construct exacting mathematical models of the stimulus-perception-response function. • They can be easily and systematically varied. This allows one to determine which factors affect different perceptual processes. • The variations can be perfectly described mathematically, allowing proper modeling. In perceptual experiments, it is important that the participant sees only the information we present to them. Thus, in classic psychophysical experiments, the images are shown in an otherwise completely dark room. In order to prevent searching or other interactive behaviours, the stimuli are presented for extremely brief periods of time (e.g., 20 ms), and the participant’s head is held in place (which also helps to ensure that the briefly presented stimuli are always presented to the same area of the retina). Finally, to ensure the accuracy and stability of the results, traditional psychophysical experiments consist of thousands or tens of thousands of repetitions (i.e., the exact same stimuli are seen repeatedly). The rigour required by psychophysics meant that the stimuli were originally presented on custom designed machines. Later, the precision and reliability computers offer made them ideal tools for generating and presenting even simple stimuli, and have thus become deeply entrenched within standard perception research. In modern psychophysics, as well as perception research in general, some of these traditions are no longer common. In particular, head stabilization and the large number of repetitions are no longer used. The desire for near absolute control over an experiment is, however, still critical. Thus, most perception research continues to use simple, abstract stimuli. As James J. Gibson pointed out, however, it is not clear if the results found in such studies generalize to the real world, which is vastly more complicated [Gib79]. The increasingly
D. Bartz, D. Cunningham, J. Fischer, C. Wallraven / Perceptional Graphics
common desire to study perception in real-world-like situations requires careful adaptation of the research methodology to deal not only with the high-dimensional nature of natural stimuli, but also to allow tasks that more directly address everyday issues (e.g., “closed loop”, or interactive, tasks). At the extreme, one might imagine using the real world itself in experiments. Unfortunately, events in the real world can not be exactly reproduced, can not be exactly described mathematically, and can not be easily or systematically varied. Thus, the fundamental requirements for perception research are not met. The tremendous advances in computer simulations of physical reality, however, seem to offer an elegant compromise. Computerized imagery and simulations can be very realistic, solving the generalization problem. They can be exactly reproduced as often as one wishes. They can be systematically varied (although it is not always easy to produce the exact perceptual change one is interested in [GCWB07]). They can be described mathematically. It is important to note that mathematical descriptions of naturalistic stimuli tend to be painfully complex. This makes the task of describing the functional relationship between stimuli and perception considerably harder. Fortunately, the variations in the stimuli are generally easy to describe, allowing one to at least describe the functional dependence of a given perceptual process on specific dimensions. Unfortunately, the high dimensionality of naturalistic scenes means that many different factors can be involved, and thus a complete understanding of which factors contribute to perception (and how they contribute) requires many experiments. The remainder of this section will provide an overview of the five specific aspects of any perceptual experiment: what gets shown (stimulus generation), who gets to see it (participant selection), how they get to see it (stimulus presentation), what they do with it (task design), and how we analyse the responses (data analysis). For a full account of some of the modern elements of classical psychophysics see [Ges97].
2.2. Stimulus Selection Although the choice of which images to show in an experiment might seem obvious, it is often the cause of many difficulties. The primary goal in stimulus design is to make sure that any change within the image set is due solely to the factor of interest. If one is interested in whether a specific dimension or factor can, in principle, affect a given perceptual process, then one will probably use a “reductionist” approach: reduce the stimuli to the point where nothing except the dimension one is interested in is present. For example, let’s say we are interested in how the spacing of the inducing elements (i.e., the partial circles) affects the strength of the illusory triangle in Figure 2. Thus, one might take that figure, and systematically move the inducing elements closer together and farther apart (see, e.g., Fig. 5). Note that the base figure contains
only the minimal information necessary to induce the triangle, and that the variations in that image contain changes in a single dimension: inter-element spacing. Thus, the changes in illusory contours strength seen in the image must be due to the changes in inter-element spacing.†
Figure 5: Four Kanisza triangles, with different spacings between the inducing elements. Knowing that a given dimension can, in principle, affect perception, does not necessarily mean that it will when the full complexity of a real world scene is present. To answer this type of question, one might choose an “eliminative approach”: take a natural scene and eliminate or vary the dimension of interest. For example, imagine that we are interested in facial expressions. Most research on faces is done with static photographs of faces. Previous research has shown that degrading the shape quality of a face (i.e., blurring the geometry) makes it much harder to recognize expressions [WBCB07]. Real faces, however, are rarely static. Just because shape quality can affect the perception of an expression, does not mean it does so in real-world contexts. To address this question, one would need to compare the effect of degrading shape information for both static and dynamic versions of the same expression. If we get the same pattern of performance drop with decreasing shape quality for dynamic faces as we do for static faces, then we know that the effect of shape quality generalizes to more naturalistic expressions. Interestingly, [WBCB07] performed this comparison, and found that changes in shape quality do not, in fact, affect the expression recognition for dynamic faces [WBCB07]. The information produced by a moving face seems to compensate for the information lost due to shape degradation. † Note that [KS91] performed a set of experiments along these line, albeit much more complex, and found that the strength of the illusory edge is determined by the ratio of length of the illusory part to the length of the entire edge (illusory and real). c The Eurographics Association 2008.
D. Bartz, D. Cunningham, J. Fischer, C. Wallraven / Perceptional Graphics
2.3. Participant Selection In order to know how all people would react to a given set of images, one would ideally have to show the images to all people. In practice, this is not possible. Thus, the goal of an experiment is to generalize from a subset of a population to the whole population. There are two issues which are critical here. The first is sample size. The more people there are in the subset, the more certain one can be that the effects will hold for the whole population. A corollary of this is that larger number of participants enables one to reliably detect smaller effects. In other words, One can find large effects with, for example, 2 people (e.g., can people see color), but smaller effects (e.g., what types of color blindness are there) require a much large sample size. Second, the sample should be representative of the population. If one were to study color perception using only female participants, the prevalence of certain deficiencies would be drastically underestimated. Likewise, if all of the participants are computer graphics experts, it not necessarily clear that the results will generalize to people who have never seen a computer. This latter example also serves to highlight the issue of “insider” knowledge. If the participants know a lot about the phenomenon or the research question that is being investigated, this could affect the way the interact with the stimuli, and thus influence their results. Thus, it is traditional to give the participants as little information about the research question as possible until after the experiment is over. 2.4. Stimulus Presentation Once we have a set of images and a group of people to show them to, we need to decide who gets to see what and how they will see it. The most obvious answer is that each participant gets to see every image (a “within-participants” design), and that the images are presented in order (i.e., “the method of limits”). For example, in the illusory contour experiment described above, one might show the images in order of decreasing inter-element spacing. This gives rise to potential order effects: The specific pattern of responses might be due either to the actual stimuli or to the presentation order. For example, participants might base their answer to the current stimulus based on their previous answer (e.g., the participant might, after saying “really strong” three times in a row, decide that they should probably say “weak” regardless of what the stimulus looks like). In such a case, we can not conclude that our manipulation had an effect. Furthermore, the image a participant just saw might bias how they interpret subsequent images. For example, the presentation of a high-quality image makes it much easier to recognize a subsequently presented low-quality version of the same image [NCWB05]. Thus, presenting all of the participants with a high quality image before a low-quality version will result in an over-estimation of how easily people can recognize degraded images. c The Eurographics Association 2008.
There are three ways to deal with order effects. The first solution is to avoid the problem entirely: Each person sees only the images from one condition. This is referred to as a “between-participants” design. Of course, if only one or two people see the images in any given condition, we can not be very sure that their results will generalize to the whole population. In other words, while a between-participants design avoids order effects, it introduces group effects: The responses from different conditions may be caused by the differences in the stimuli or by the differences between the groups. This can, of course, be mitigated (but not eliminated) by using a lot of participants. A second solution is to explicitly manipulate order as a factor. A “latin squares design”, for example, is a hybrid design were each person sees evey image (a within-participants design for the stimulus manipulations), but each possible order of the conditions is shown to a different group of participants (a between-participants design for order). The fact that each person sees each image avoids group effects regarding the stimulus manipulation. Since each order is seen by only one group, however, the group sizes need to be large enough to ensure generalizability. For an experiment with 1 factor of 4 levels (like the experiment with the illusory triangles above), there are 24 possible orders, so 24 groups are needed. Obviously, the exceedingly large number of participants required even for simple experiments means this is generally not a practical solution. One can, however, run simple versions of the experiment using a drastically reduced number of conditions to determine the size (if any) of an order effect. If the size of the order effect is smaller than the effect one is interested in, it can be safely ignored. Finally, one can use a within-participants design and randomize the trial order (also referred to as “the method of constant stimuli”). That is, each person sees each image, but different people get different orders. This is similar to a latin squares design, exact the order is randomized and order is not recorded. This means that it is quite possible that some orders are not shown, and there are not many people with any particular order. For this reason, one does not examine order as a specific factor, but pretends each person is in the same group. Order effects will still occur, but as as long as each person gets a different (random) order, the amount and direction of the order effect will be different for different people, and the influence of the different order effects will be averaged. Thus the order effect will be weakened for the group as a whole, and may be though of as “noise”. If, of course, the order effect is larger than the effect one is interested in, the “noise” of the order effect will mask it. 2.5. Task Design The task needs to be designed so that the results will allow us to answer a specific question. The range of tasks, then, is almost as large as the number of things people do. One can, however, classify tasks into six rough categories: Ques-
D. Bartz, D. Cunningham, J. Fischer, C. Wallraven / Perceptional Graphics
tionnaires, free description, scales, forced choice, physiology, closed loop. The most obvious type of task is to simply ask people for their opinion. This is the general idea behind questionnaires and free description tasks. Questionnaires can be seen as asking for “meta-knowledge”: That is, knowledge about how a person thinks they might react in a specific type of situation. For example, if we want to know which facial animation technique will produce the best results, we could show people several different expressions created using several different animation styles and ask people which one they feel would allow them to recognize expressions best, which one they felt was most aesthetic, etc. One of the primary concerns with questionnaires is that changing even seemingly insignificant aspects of the wording of a question can lead to drastically different answers. There is a very large field of research dedicated to the issue of how one reliably generates valid questionnaires. Moreover, it is by no means clear that people’s opinion about how they would react bears any correlation to how they actually react. For example, people’s opinions how well they thought different animation styles would allow them to recognize expressions was not even closely related to their actual performance on an actual recognition task [WBF∗ 07] In a free description task, one asks the participants to describe something in their own words. The main difficulty here lies in the interpretation of the results. Since we have a specific research question, we need to somehow map the wide range of responses the participants give us onto our specific categories. This is a highly subjective task. Imagine, for example, that we show participants an animation sequence of a person smiling. We want to know if they recognize the expression, so ask them to describe the expression. As response, we might see “Happy”, “Grimace”, “Sardonic”, “Smile”, “lips curled upwards”, and “As if they just ate something nice”. Clearly these descriptions are not identical, but are the difference important? Did the all of the participants recognize the expression? While some people might consider the last response to indicate that the participant saw a smile, not everyone would. To avoid the problems involved in the subjective mapping from response to category, one usually has several people perform the mapping, and then looks at the consistency of their mappings. This can be very time consuming. Moreover, if one does not get a high (90% or better, usually) inter-rater reliability, then the mappings can usually not be used). Another approach would be to employ a rating scale (these are sometimes referred to as “Likert” scales). For example, “On a scale of 1 to 7, how happy does this person look”. There are a few difficulties with such scales. The first relates to the anchoring of the scale. How happy is a 7? Does 1 mean neutral or Sad? If there is no explicit information about what exactly a 7 and a 1 would look like, then the participants must somehoe decide for themselves what the
numbers means. As a consequence, they generally require a number of trials before their mapping stabilizes. This means that the results from the first few trials cannot generally not be used. If one has used a number of repetitions of the images, this is not a problem. If one is only using one repetition, it means that not every participant will give a (useable) response to every condition, which is not good. It also means that different people may come up with very different mappings. Furthermore, the mapping may continue to change over the course of an experiment. Additionally, people tend to avoid using the extremes of any scale (in order to save them in case something more extreme shows up). This makes it very difficult to compare responses (either across participants, or within a participant over time). Thus, it is advisable to somehow anchor the scale whenever possible. Finally, it is not always easy to make reliable, exact numerical decisions. For example, how much happier must someone look to change from a 6 to a 7? This further serves to increase response variability. In general, then, the resolution, reliability, and sensitivity of Likert scales can be limited, especially if the scale is not anchored. An interesting variant on Likert scales is the semantic differential, which was first introduced by Osgood [OST57]. Here, the ends of the scale are opposite terms, such as "goodbad" or "strong-weak". The semantic differential technique has been extensively researched in a number of application domains, from marketing research [Min61] to determining the aesthetic dimensions of baroque music performances [SF06]. Three orthogonal dimensions can sufficiently describe most semantic judgements. The dimensions are often referred to as Evaluation (e.g., good-bad, heavy-light), Potency (e.g., strong-weak, powerful-powerless), and Activity (e.g., fast-slow, alive-dead). Most of the paired opposites scales that are traditionally used correlate very well with one of these dimensions, although some scales correlate with more than one dimension. To improve the reliability of the measurements, each of the three dimensions is measured more than once using similar (but not identical) scales. The most traditional task is the forced choice task. Here, a limited range of options is given, and the participant must choose one of them. For example, one might be asked to recognize an expression by choosing the response from a list of expressions. This avoids the mapping problem of free description by providing the categories one is interested in directly to the participants. Limiting the responses a participants can use, however, results in the loss of useful information (e.g., the variation in the free descriptions one got about the Smile expression above may inform us about subtle aspects of either the expression or the perceptual process). More critically, the mere fact that the label for an expression is seen might increase the participant’s chance of thinking that that expression might be present (this can be thought of as a form of order effect). Forced choice tasks can also lead to inflated recognition rates in other ways. For example, if one is not certain what an express is, one can somec The Eurographics Association 2008.
D. Bartz, D. Cunningham, J. Fischer, C. Wallraven / Perceptional Graphics
times deduce the correct answer by a process of elimination (e.g., determining which of the available options the expression is not, and then choosing the answer that remains). This can sometimes be avoided by the inclusion of a “none of the above” option, although this might interfer with the definition of “chance” performance (the recognition rate we would expect if a person randomly guessed). In designing forced choice tasks, it is advisable that the categories are equally probable. For example, one may wish to know if people can see the difference between a real and a synthetic image. If we were to present two images and ask if they are (a) same or (b) different, we would have asymmetric options. For any given image, there is only one image that would allow us to answer “same”. All other possible images fit into the “different” category. Statistically, then, the odds are very high that the answer is “different”. Thus, if we are uncertain of the correct answer, the safe guess would be different. Unless we suspect that the experimentor is not using real-world probabilities, but has ensured that half of the trials are, in fact, “same”. At this point, however, the performance of the participants is less influenced by perception than by some strategie (specifically, their estimate of how they think the eyperiment arranged the probabilities in the experiment). One could, instead, present both images, and ask which one was real. Since one is real and one is synthetic, the probability of any given answer being correct is the always 50%. Thus, if the participants do not know the answer or can not tell the difference, than they should be correct 50% of the time. All of the previous tasks require language. Since language is a rather high-level cognitive function, one might worry that it contaminates or biases perceptual responses. I may recognized an expression, and react to it properly, but have no idea what it is called. One way to avoid this is to find some physiological factor that varies with the task. For example, simulator sickness tends to affect heart rate, body temperature, and brain waves, so one might measure it using EKG, GSR, or EEG. Alternatively, we might ask the participants to directly perform some behavior. For example, rather than ask people if they think that falling snow will affect ability to keep a car in a given lane (questionnaire or free description method), we can simply ask them to drive a (virtual) car, alter the pattern of (virtual) snow and see what happens‡ 2.6. Data Analysis The exact method that is used to analyse the data depends strongly on the type of task and on the research question. In general, there are three types of analysis: Data reduction, descriptive statistics, and inferential statistics. For com‡ If the snow is not falling directly downwards, but instead to one side or the other, as if driven by the wind, people tend to drive into the direction from which the snow is falling [CCB00]. c The Eurographics Association 2008.
plex tasks, one might need to simplify the data to find patterns within it. The results of a semantic differential experiment, which consists of ratings along a number of pairedopposites scales, are usually subjected to factor analysis [Spe04] (which is related to PCA) in order to find out how the answers on the different scales relate to each other and to the stimuli. For other tasks, such as rating the similarity between a series of objects, one might run a Multidimensional Scaling [Ric38] on the data to get a mapping between the subjective space of perceptual responses and the physical space of parameter values. In other cases, one wishes to find a critical value or threshold. Thus, the tendecies of the data are extracted (e.g., mean, standard deviation, etc.). One might even perform some form of curve fit to better (such as a sigmoid curve for psychophysical functions, or linear regressions, etc.). Finally, there is in inferential statistics, which is the most common form of data analysis in perception research. Since there is some inherent variability in human behaviour, we wish to know whether a difference between two or more of the conditions in an experiment is reliable. That is, is the difference merely due to random chance, or did the differences in the stimuli cause it. Generally, if the difference is likely to occur only 5% of the time (or less) by pure chance, then we can assume that the difference was caused by our manipulation.
3. Perception in Virtual and Augmented Environments Virtual reality (VR) systems use advanced modes of display, usually immersive projection technologies, in order to present computer-generated graphical content to the user [Vin95]. These advanced displays typically offer large perceived display areas, which sometimes surround the user, and stereoscopic rendering. Examples of VR displays are head-mounted displays [FMHR86] (see Fig. 6 ), rooms made up of back-projected screens (CAVEs) [CSD93], tablelike display setups [KBF∗ 95], and domed projection systems [BAR08]. Virtual environments are typically used in specialized applications such as scientific and medical visualization and industrial design, but also in entertainment settings. As an extension of classical virtual environments, mixed and augmented realities (MR/AR) combine computergenerated graphical elements with a view of the real surroundings of the user [ABB∗ 01]. A defining characteristic of MR/AR systems is the three-dimensional registration. This means that the virtual objects in the scene remain consistently positioned and oriented relative to the real environment. Registration can be achieved using some form of camera or head pose estimation, e.g., with the help of magnetic or optical tracking [KB99]. The actual overlay of computergenerated graphics over the real world is accomplished either by capturing a digital video stream of the real environment as background for the graphical output, or by using specialized semi-translucent display hardware. The two
D. Bartz, D. Cunningham, J. Fischer, C. Wallraven / Perceptional Graphics
Figure 6: Head-mounted display (HMD), shown here in a configuration with a camera for use in augmented reality.
terms mixed reality and augmented reality are often used interchangeably. In the following, we will only use the term augmented reality. There is a mutual relationship between virtual/augmented reality and perception research. On the one hand, immersive environments are utilized as tools for studying aspects of human perception. For instance, Riecke and Wiener have used a high-end virtual reality setup to demonstrate that visual cues are sufficient for the fast updating of the perceived self-localization of a human observer [RvB05]. In a recent experiment, Seward et al. examined time-to-contact judgments of pedestrians when crossing a street with the help of different VR display systems [SAB07]. Among other findings, they were able to conclude that the type of the oncoming vehicle as well as the pedestrian viewpoint are not significant for the time-to-contact judgement, and that the same results are obtained in a desktop VR system as when using a head-mounted display. Lenggenhager et al. used a VR-inspired setup based on a head-mounted display showing video images in order to study human bodily selfconsciousness [LTMB07]. They found that under certain circumstances, participants in their experiment mislocalized themselves toward a virtual body seen from the outside. As a complement to using virtual reality systems as a tool for perception research, findings from psychophysical studies are used to improve the technical design of virtual and augmented environments. The main interest in this line of research is the question which design aspects of a VR/AR setup have a strong impact on the user experience. The following two sections will discuss in more detail the perceptual optimization of virtual and augmented environments, respectively. 3.1. Virtual Environments Insights gained through perception research have been used to evaluate and improve the fidelity of virtual environments. An overview of related research was for instance given by Bülthoff et al. [BCA∗ 05].
Luo et al. examined the visual factors influencing size perception in virtual reality [LKK∗ 07]. They used a singlesided cave (C-Wall) for their experiment. Subjects were shown a virtual representation of a familiar object (a coke bottle). They were asked to adjust its size so that it would correspond to the size of the analogous physical object placed at the same distance from the observer. For different trials, varying combinations of visual factors were enabled. Three factors were examined; the influence of stereoscopic versus monoscopic rendering, the influence of visually rich versus sparse virtual environments, and different types of motion parallax. Luo et al.’s results suggest that while stereo vision and scene complexity are significant factors for size perception, motion parallax might not be significant. A related topic was examined by Interrante et al. [IRLA07]. They investigated how the subjects’ estimation of the distance to a room wall was influenced by the accuracy of a virtual room model. Study participants were placed in an HMD-based virtual environment consisting of a virtual room scene modeled after a real room which they had been shown before. Different trials either used a virtual room model which corresponded exactly to the real room, or models being a little smaller or a little larger than the real room. The subjects’ distance perception was measured by having them walk blindly (i.e., without visual cues) towards the wall. Interrante et al. found that participants underestimated the distance in both the larger and the smaller room models, while the distance estimation was reasonably accurate in the realistic model. Lecuyer et al. studied methods for improving the sensation of walking in virtual environments [LBHD06]. In their experiment, different navigation trajectories through a virtual scene were shown to subjects in a monoscopic desktop VR system. Two types of additional camera motion were examined in order to convey a stronger sensation of walking in the virtual environment to the study participants. The first type of added camera motion consisted of a periodical displacement of the camera location from the center line of the navigation trajectory. The second type also rotated the camera, emulating compensating human head motions. Lecuyer et al. concluded that the subjects strongly preferred an oscillating camera position versus a linear navigation, and on average preferred added compensating camera rotations compared to pure positional oscillation. Like in other applications of computer graphics, the visual realism of the rendered images is one of the main factors for the quality of the user experience in virtual environments. Modern real time rendering systems rely on complex, programmable graphics pipelines in order to generate the output images. The hardware graphics subsystems found in professional workstations, as well as in commodity PCs have the capability to execute user-defined code at various stages of the image generation process. These geometry, vertex, and fragment shaders provide the flexibility and c The Eurographics Association 2008.
D. Bartz, D. Cunningham, J. Fischer, C. Wallraven / Perceptional Graphics
configurability required to make many advanced graphical effects possible in real time. The original principle of programmable graphics pipelines was described by Cook and Perlin [Coo84, Per85], and its realization in hardware for instance by Peercy et al. [POAU00]. In many scenarios, the computational complexity of the participating shaders effectively limits the rendering speed of a real time graphics pipeline. In virtual environments, short image generation times are essential, since high output resolutions and possibly stereoscopic rendering result in a high load on the graphics engine. Moreover, due to the highly interactive nature of many VR applications, short latencies between user input and graphical representation are desirable. Some researchers have investigated the automatic optimization of shader code for more efficient real time rendering. Examples of such work include the systems developed by Olano et al. [OKS03] and Pellacini [Pel05]. In a recently performed experiment, the connection between the computational complexity of shaders and the visual realism of the resulting renderings was investigated. Specifically, the perceived visual quality created by three different lighting models and varying accuracy levels of an image post-processing filter was examined. The so-called bloom image post-processing filter is inspired by highdynamic range imaging and adds feathers of light around the bright areas in the rendered image. In the experiment, the participants were shown various 3D objects textured with different texture and normal maps and rendered with different combinations of shader effects. They were asked to evaluate the subjective graphical quality of each rendering using a grade between 1 (worst) and 9 (best) with a key press. Figure 7 shows screen shots of two trials shown in the study.
Figure 7: Top: Hole punch model, Phong lighting, half resolution bloom effect. Bottom: Moose head model, CookTorrance lighting, quarter resolution bloom effect.
In augmented reality, a view of the real surroundings of the user is enriched by computer-generated elements. This principle poses a number of unique challenges for the development of augmented reality systems. Here again, insights from perception research can be used to inform and improve the design of such systems.
is the question how to visually integrate graphical augmentations into the output images. A relatively simple augmentation used in many AR and ubiquitous computing applications is the overlay of 2D text. When rendering text over an acquired video image, a good legibility is desired. At the same time, the portion of the video image covered by the text should not be too large. Gabbard et al. [GSH∗ 07] performed a user study examining the legibility of various types of text display for AR overlays. In their experiment, different text colors and different text drawing styles were combined. Here, the term drawing style denotes the method used to create a transition between the text and the background image, e.g., with an opaque billboard, a drop shadow, or a thicker text outline. Moreover, they tested two methods for automatically determining a color resulting in a high contrast between the drawing style elements and the video image. The results of their experiment indicate that complex interactions between the background texture, text color, and text drawing style exist. Specifically, their data suggests that a drop shadow behind the text improves reading performance, and that a color selection maximizing the brightness contrast is more effective than using the HSV color space contrast.
One of the main topics of interest in AR system design
Tönnis and Klinker have investigated the application of
The results of this experiment indicate that lighting models with greater computational complexity do not necessarily lead to a greater perceived realism. Moreover, study participants seemed to like the bloom post-processing. However, the experimental results do not strongly suggest a significant improvement through greater accuracy in the postprocessing stage. Studies such as this one can inform the design of virtual environments so that a better balance between image generation speed and perceived visual quality is achieved. 3.2. Augmented Reality
c The Eurographics Association 2008.
D. Bartz, D. Cunningham, J. Fischer, C. Wallraven / Perceptional Graphics
graphical augmentations in an automotive context [TK06]. The development of augmented reality technology for the use in cars is a growing research area. Here, the effectiveness of an AR overlay for alerting drivers of imminent dangers was examined. For their study, Tönnis and Klinker placed a semi-translucent head up display in a car simulator in order to mirror graphical objects into the driver’s environment. They presented two different types of AR visualization to the participants of their study. In one visualization mode, a superimposed arrow indicated the direction of imminent danger in a schematic bird’s eye view of the car. Alternatively, a specially designed 3D arrow was shown, which pointed in the direction of the imminent danger relative to the car. Moreover, the use of sound as an additional cue was also investigated. The experiment showed that the 3D arrow visualization resulted in shorter reaction times, as well as a smaller error in the identification of the direction of the danger. The use of the sound cue seemed to lead to a slightly shorter reaction time, but did not generally result in a more accurate driver response. Along with methods for displaying virtual content, user interaction mechanisms are an important component of AR system design. User interaction devices for augmented reality should be lightweight, ideally untethered, intuitive to use, and accurate. Thomas examined three different approaches to user interaction in wearable augmented reality [Tho06]. In this study, a handheld pointing device was compared with a purely gaze-directed method and an approach that combines gaze direction with a handheld pointing marker. The subjects were asked to use the pointing methods in order to select or annotate real objects in the environment. The results of this study suggest that the combined gaze-direction and pointing technique is the superior method for this type of task. One central factor influencing human perception in augmented reality is the fact that the degrees of visual realism in the virtual and the real elements of an augmented environment are dissimilar. Virtual graphical objects typically lack natural lighting, as well as camera image effects such as motion blur and image noise, which are present in video images. This makes them easily distinguishable from the real environment. Recent approaches to image generation for augmented reality try to eliminate this difference in visual realism. In Stylized Augmented Reality, artistic or illustrative stylization methods are applied to the entire augmented video stream [FBS05c]. This way, both the real and the computer-generated objects are rendered in the same visual style, making them much more difficult to distinguish. Different types of stylized augmented reality have been explored: cartoon-like stylization [FBS05b, HLB05], an artistic representation with brush strokes [FBS05a], as well as a rendering style emulating technical illustrations [FBS06]. Figures 8 - 10 illustrate the concept of stylized augmented reality using a conventional and two stylized representations of the same augmented scene.
Figure 8: Augmented reality scene showing a real tea pot (seen at right) and a virtual tea pot model (seen at left). This image shows a conventional AR representation.
Figure 9: Cartoon-like representation of the AR scene depicted in Fig. 8.
A psychophysical study was performed in order to measure the decreased discernability of virtual objects in stylized augmented reality [FCB∗ 06]. In this experiment, participants were shown recorded video clips and still images of various AR scenes containing either a real object or a virtual model at the center of the view. The recordings alternatively showed a conventional AR rendering or a cartoon-like representation. Subjects were asked to decide whether the central object is a physical object or a graphical model. Figure 11 depicts a virtual model shown in the study in the conventional AR mode, and Figure 12 shows its stylized representation. The results obtained in the study indicate that virtual and real objects are significantly more difficult to distinguish in a stylized augmented reality environment. The subjects required a longer time to reach a decision, and a significantly higher error rate was recorded in the cartoon-like representation of the AR scene. (See [FCB∗ 06] for more details.) Different applications for stylized augmented envic The Eurographics Association 2008.
D. Bartz, D. Cunningham, J. Fischer, C. Wallraven / Perceptional Graphics
Figure 10: Brush stroke rendering of the AR scene depicted in Fig. 8.
Figure 11: Conventional AR rendering of a graphical coffee maker model shown in the psychophysical study.
ronments have been proposed. These include the mobile outdoor AR visualization of landscapes for navigation [KHG07], as well as the use of selective stylization for a more visually uniform AR in tangible interfaces [FFS07]. Figure 13 shows an example image demonstrating selective stylization for tangible AR. 4. Perception and Rendering/Animation One of the primary goals of computer graphics is to produce realistic worlds. In this, computer graphics has so far largely relied on the physical modeling of object properties— examples range from the rendering equation [Kaj86] based on radiative heat transfer to facial animation based on physical simulation of muscles and skin tissue [SSRMF06]. Increasingly sophisticated algorithms together with an enormous increase in computing power have enabled researchers to produce amazing images of natural and artificial scenes and to set these into motion. A question that has emerged in recent years is, however: ”How do we know when to stop?”, or ”When is realism ‘realistic enough”? In this section, we approach the question of realism from the viewpoint of huc The Eurographics Association 2008.
Figure 12: Cartoon-like AR rendering of the graphical coffee maker model shown in the psychophysical study.
Figure 13: Selective stylization for augmented reality in a tangible user interface. This image shows an augmented urban planning application. The building model held by the user is a real object, while the city plan shown beneath the user’s arm is virtual.
man perception: What is needed in order to produce perceptually realistic environments? By asking this question, we have thus chosen the human visual system rather than physical accuracy as our ”gold standard”—after all, computer graphics produces images that humans look at and have to appreciate. As a full treatment of perceptual issues in computer graphics is outside the scope of this STAR, we have restricted ourselves to four different topics. More specifically, in this section, we will focus on recent studies that have looked at perceptual issues in rendering and animation in the areas of image fidelity metrics, selective rendering, material rendering, and facial animation. We have chosen these particular areas as they roughly span a range from low-level perceptual concepts (such as the notion of ”contrast” for fidelity metrics) to high-level perceptual concepts (such as the notion of ”believable” expressions for avatar animations).
D. Bartz, D. Cunningham, J. Fischer, C. Wallraven / Perceptional Graphics
4.1. Fidelity Metrics and Selective Rendering 4.1.1. Fidelity Metrics A strong focus of previous research has been on utilizing low-level properties of the human visual system for perceptually driven fidelity metrics (for a good overview, see [OHM∗ 04]). Existing algorithms such as the Visual Difference Predictor (VDP, [Dal93], as well as its High-DynamicRange extension [MDMS05]) or the Structural Similarity (SSIM, [WBSS04]), however, usually result in a much too conservative estimate of rendering fidelity, as some image differences will not matter in quality judgements of human observers. In a recent study [RFWB07], this issue was addressed by the development of a visual equivalence predictor, which focuses on appearance-preserving rendering. In [RFWB07], images are defined to be visually equivalent ”if they convey the same impressions of scene appearance, even if they are visibly different”. In the study, several perceptual experiments were conducted in which the interaction of illumination transforms with object shape and material were investigated using simple, spherical shapes. Participants had to do four tasks in which they were asked whether images were the same, depicted the same shape, were made of the same material, or were lit similarly to a reference shape. The results of the first task showed that the two different kinds of illumination transformations (blurring and warping) introduced different levels of detectability. In general, however, performance did correlate well with a standard visual difference predictor [MDMS05]. The results of the remaining three tasks were used to derive visual equivalence predictors for the three properties of shape, illumination, and material - indeed, some parameter changes even though physically noticeable, were not distinguishable perceptually. These predictors were then used on novel objects in order to derive illumination transforms that could be applied to those objects without resulting in perceptually noticeable differences. Even though the VDP predicted clear physical differences, perceptual differences for those novel renderings were found to be minimal. As illumination calculations are rather costly, this approach can also be used to reduce rendering time. 4.1.2. Selective Rendering Another important topic in perceptual graphics is the exploitation of limited human attentional resources for selective rendering purposes. The human visual system is not capable of spending equal amounts of processing power on all modalities and cues it receives from its sensory systems at any given time (leading also to well-known perceptual phenomena such as attentional, or change blindness). Instead, it relies on attentional mechanisms to highlight and select specific parts of the sensory input stream. In attention research, one generally divides between overt (that is, intentional, top-down controlled) and covert (that is, unconscious, bottom-up driven) attention processes. Overt processes are
controlled by our conscious brain and often make use of task-dependent knowledge (for example, when asked to look for a specific item, I know where to search, what color to look for, etc.), whereas covert processes ”grab your attention” based on input-driven properties (for example, a sudden flash in your peripheral vision will make you look in that direction). Much the same as the human brain, such resource management can also be leveraged in real-time computer graphics contexts, where limited resources (constrained by rendering speed, or input-output bandwidth, for example) force the system to compromise on rendering fidelity in order to enable real-time interaction with the system. The framework proposed by [CDdS06] therefore uses both bottom-up importance maps, and top-down task maps to compute ”realism in real-time”. Selective rendering in this case means to spend resources for rendering on those parts of the scene in which they will be perceptually most noticeable, rather than distributing rendering power equally across all objects. Of the three different selective renderers which are proposed in [CDdS06], we highlight two in the following: detection of key objects per frame, and selective componentbased rendering. The first approach is based on knowledge of important objects in an animation. The scene is first rendered to achieve a base quality (typically using one ray per pixel) - if present, the key object is detected by ray intersection in this step. In a second step, for frames containing the key object, the image is rendered using a gradually decreasing quality around the important objects. A data structure called the quality-buffer is then used to determine for each pixel how many additional rays need to be cast into the scene in order to achieve the desired fidelity. The second selective renderer extends this pipeline by being able to stop traversing cast rays depending on a pre-specified importance of each rendering component (such components are, for example, reflection, specular, and diffuse interaction). Light transport can then be stopped after a certain number of interactions with surfaces. Compared to the previous renderer, this framework was shown to scale better to lower time constraints, due to the more fine-grained resource scheduling. In [MDCT05], this approach was extended to include multi-sensory influences motivated by the fact that due to the band-width limitation of the perceptual system, the brain cannot process all sensory modalities with the same fidelity. When presenting participants with animations played at different frame rates, animations containing sound effects were consistently rated as having a smoother motion than those which did not. By exploiting this fact and extending it to other modalities as well, one could potentially relax rendering requirements further. 4.2. Material Rendering 4.2.1. Perceptual Reparametrization Research in computer graphics has spent a lot of time to develop efficient and at the same time realistic models for c The Eurographics Association 2008.
D. Bartz, D. Cunningham, J. Fischer, C. Wallraven / Perceptional Graphics
the interaction of light with materials. These models, however, are usually approximations of the physical laws rather than paying attention to how humans perceive materials. The relationship between the parameters of an algorithm and the resulting perceptual effect for most of these models is not straightforward which hampers the ability to produce specific effects for applications in visualization, art, and perception research. Following earlier studies by Pellacini et al. [PFG00], Cunningham et al. therefore pursued the idea of reparametrizing complex reflectance models in order to arrive at a perceptually uniform parameter space [CWFS07] . The basic idea is to first gather similarity ratings between two images rendered with different model parameters. This similarity data can then be analyzed using Multidimensional Scaling (MDS) to recover the dimensionality and topology of the underlying perceptual space. In addition, semantic differentials (that is, rating properties of an object based on opponencies such as ”hot - cold”, ”transparent - opaque”) were used to investigate which semantic object properties were taken into consideration when viewing such renderings. This approach was demonstrated on two datasets using state-of-the-art reflectance models which varied in two parameter dimensions, respectively. The first dataset consisted of glossy objects, for which MDS uncovered a twodimensional similarity space and five primary semantic factors. The second dataset, transparent objects, was accurately described by a one-dimensional similarity map and six semantic factors. In both cases, roughly half of the factors represented aesthetic aspects of the stimuli, and the other half low-level material properties. By extending this approach to other reflectance models, it will become possible to enable more efficient interaction of users with the complex, physicsbased models. 4.2.2. Perceptual Material Editing In a similar context, perceptual judgments on material properties have been applied for suggesting more efficient user interfaces for material rendering [VLD07]. Here, the main motivation for the study was that in standard user interfaces for material editing, the material is usually previewed on a point-lit sphere. This geometry, however, might not be the best to illustrate the effects of different materials, as the shape is too regular and therefore cannot accurately visualize more complex material properties. Additionally, the interaction of lighting with the material properties is complex, suggesting that it might be hard to generalize from a point light source for the preview to the final scene which might have a much more complex illumination setup. The study therefore set out to investigate material perception as an interaction of different object geometries, the scene in which the objects are depicted, different base materials, and small variations of each base material. The authors chose the WARD reflectance model [War92], as it was c The Eurographics Association 2008.
already used in an earlier study [PFG00], in which a perceptually uniform parametrization for glossiness was derived. In the experiments, two images selected from this space of stimuli were presented to participants who were asked whether the same material was depicted in both images or not. The results showed that accuracy of material perception was critically influenced by the geometrical shape: the sphere, for example, was the shape with one of the worst material discrimination thresholds suggesting that using it in material editors probably will not give correct impressions of the result. Going beyond this practical suggestion, the full set of results also extends our knowledge about the complex heuristics underlying material perception in humans [FDA03]. 4.2.3. Changing Materials in Images Perhaps one of the most extreme examples of the difference between ”physically correct” and ”perceptually correct” was given by [KRFB06] in which the material appearance of objects was changed dramatically (e.g., from opaque to transparent) by manipulation of simple image statistics. Usually, such a dramatic change would require an exact reconstruction of the three-dimensional object shape which could be rendered back into the image using a different Bi-directional Reflectance Function (BRDF). The core idea in this work, however, was to arrive at a reasonably exact estimation of the object geometry taking into account the so-called basrelief ambiguity [BKY99]. The ambiguity states that the human visual system cannot distinguish between surfaces that are affinely transformed along the line of sight and has been exploited by artists for centuries in bas-reliefs (for example, in wood and stone carvings in churches and temples). This means that for a perceptually correct estimation of object shape one needs only the distribution of the surface normals but not their absolute values. Such a shape reconstruction can be achieved by a simple 2D-filtering of the (isolated) object using a bi-lateral filter. The output of the filter is then taken directly as the reconstructed depth map of the object. It is important to note that the scale of the filtering (i.e., the coarseness or fineness of the reconstructed depth map) needs to correspond to the desired material structure - mismatches here result in noticeable artifacts. In order to turn an object transparent, it needs to reflect the background. A simple blurred pasting of the random bits of the surrounding background, however, was found to be enough to convey the impression of transparency. This filling-in procedure again only needs to pay attention to the distortions in the reconstructed shape rather than its physically correct depth values. Our visual system is apparently not able to do an inverse ray-tracing to derive the physically realistic reflections. This proof-of-concept work has shown that material judgements of an object seem to be made taking into account simple image and material statistics such as color and texture coarseness. This study provides an excellent example of a fusion of perceptual research and computer
D. Bartz, D. Cunningham, J. Fischer, C. Wallraven / Perceptional Graphics
a)
b) Figure 14: Material editing: a) Original Scene, b) Changed material properities to translucent - used with permission
graphics which results in novel approaches and findings for both fields. 4.3. Facial Animation The human face is capable of producing an astonishing variety of expressions—expressions for which sometimes the smallest difference changes the perceived meaning considerably [CKWB05]. Producing realistic-looking facial animations that are able to transmit this degree of complexity continues to be a challenging research topic in computer graphics. One important question that remains to be answered is: When are facial animations good enough? This section will discuss a series of recent studies that investigated both the perceptual evaluation of facial animations [WBCB07, WBF∗ 07] as well as their use in highly controlled psychophysical experiments on perception of expressions [GCWB07, WBCB07]. One of these studies also compares and contrasts the effectiveness of behavioral (taskbased) and introspective (questionnaire-based) approaches in the context of perceptual evaluation methods [WBF∗ 07]. 4.3.1. Perceptual Animation Fidelity In [WBCB07] psychophysical experiments were used to systematically evaluate the perceptual quality of several different computer-generated animations with respect to realworld video sequences. In a first psychophysical experiment, several animation techniques were evaluated with respect to their recognizability, intensity, sincerity, and typicality in order to determine the task-dependent, perceptual quality of the animations. A highly realistic avatar [BWCB03] (see Fig. 15a) was tested against several other, standard facial animation methods as well as against real-world video footage. The results demonstrated comparable performance for the avatar compared to the video footage showing that the facial animation was, indeed, perceptually valid. Furthermore, rigid head motion as well as internal facial mo-
tion were shown to critically affect all measures, exposing specific animation parameters that are important to achieve perceptual fidelity. Having access to a fully controllable, realistic avatar provides perceptual researchers with unprecedented possibilities for highly systematic experiments on the perception of facial expressions. In a second experiment, the benchmarked animations were therefore used to investigate the spatio-temporal characteristics in expression perception. This was successively degrading the fidelity of three different, fundamental properties of motion, shape, and texture in the experiments. A third experiment demonstrated how the perceptual measures developed in the first two experiments can be used to evaluate an improved version of the avatar. More specifically, it was shown that adding eyes (and teeth) results not only in an increase in recognition performance, but also affects the perceived intensity and sincerity of the facial expressions. 4.3.2. Using Animations for Perception Research This research was extended in [GCWB07] in which the facial animations were used to investigate the importance of single facial regions (mouth, eyes, and eyebrows) and head motion in the context of facial expression recognition. In three psychophysical experiments, spatiotemporal properties of the computer animated face performing seven basic facial expressions were manipulated in a highly controlled manner. By successively allowing more and more of the regions to move (see Fig. 15b), the experiments shed light on which region needs to move in order for a face to be recognized as ”happy”, for example. Surprisingly, head, eye and mouth motion is sufficient to induce real-world recognition performance - large areas of the face apparently need not to move in order to recognize something as a believable facial expression. Furthermore, the results showed the interplay of individual facial regions for recognition: recognition performance of an animation consisting of moving eyes and mouth, for example, could not be explained by a simple addic The Eurographics Association 2008.
D. Bartz, D. Cunningham, J. Fischer, C. Wallraven / Perceptional Graphics
a)
b)
c)
d)
Figure 15: Facial animations: a) Peak expression for ”thinking”, b) frozen expression with only eyes allowed to move, c) stylized version of a) for illustrative stylization, d) stylized version of a) for cartoon stylization
tion of the single-region results. This non-linear interaction of information is an important result for perception research as it examines and models the cue integration strategies of humans in face processing.
4.3.3. Perceptual Evaluation of Stylized Animations Going beyond the issue of perceptual realism, we now focus on abstraction in the context of animated facial expressions: a second series of experiments [WBF∗ 07] aimed at characterizing the perceptual impact and effectiveness of three different stylization techniques (see Fig. 15c,d for two examples). The goal of stylization is to provide an abstract, focused representation of the visual information in an image. Many varieties of stylized imagery spanning a wide range of visual appearances can be rendered very efficiently with current computer graphics techniques, making stylization into a useful technique not only for artistic, but also for visualization and perceptual applications. Going beyond the usual questionnaire approach, the experiments compared and evaluated three different stylization techniques according to subjective preference, or task-dependent measures, thereby allowing the comparison of behavioral and introspective approaches. The differences between the experiments were striking: the introspective task based on questionnaires in which the effectiveness of the animations for recognition was queried, yielded very clear preference for the original, unstylized animation. Similar results were obtained for the direct comparison task, in which two animations were shown side-by-side, and participants had to indicate which of the animations resulted in the more effective recognition of the expresion. In the behavioural task, however, in which participants directly had to recognize the depicted expression, differences between the stylized images and the original animations were less pronounced. On the contrary, the illustrative stylization (see Fig. 15c) actually turned out to give the best results in this experiment. The results therefore not only shed light on how stylization of image contents affects the perception but also shows that care should be taken when running perceptual validation experiments. c The Eurographics Association 2008.
5. Perception and Visualization Visualization as a discipline aims at the better understanding of abstract and scientific data. While a large number of techniques have been proposed, only a very small number of these techniques have been evaluated to see if they actually provide a measurable benefit for the users. Recently, van Wijk suggested how one might model the value of a visualization essentially based on the complexity involved in its development and application as well as how often it is actually successfully used [vW05]. An alternate approach, which an increasing number of research groups are using, is to use psychophysical experiments to show the added value of a method. This generally consists of an experiment that shows that a task is performed better (e.g., faster usage, higher percentage of correct interpretations). In this part, we will look into this class of approach, which either employ knowledge from perception for better understanding [Int05, HE96, HBW05, KSTE05], or which use psychophysical methods to show if a method is performing better than another one [KHI∗ 03, LKJ∗ 05, WT05, RHD∗ 06, BHW06, AL06, BH07]. Most psychophysical experiments focus on rather simple features to examine their influence on a visualization, since the respective experiments are easier to control and easier to analyze if there is a significant effect. Among those features are the choice of color, size and orientation of the features (glyphs), and the density and regularity of texture elements. In the focus of these experiments are questions if features with certain attributes generate "pop-out" effects that are detected by the lower level of the human visual system (HVS), and are hence detected much faster than features that require more processing like searching for those specific elements. Earlier work described the perception of these effects as "preattentive" processing, although more recent work (still disputed though) indicates that this awareness is through non-cognitive processing and does not affect the user’s attention. Current perceptual issues in visualization were discussed in the 2005 panel at IEEE Visualization [HIL∗ 05] and an overview was recently presented by Livingstone [Liv07].
D. Bartz, D. Cunningham, J. Fischer, C. Wallraven / Perceptional Graphics
Experimental design in the context of visualization was outlined by Kosara et al. [KHI∗ 03] and discussed in more depth by Swan [Swa07]. A good introduction into perception and (information) visualization is provided in Colin Ware’s book on information visualization [War00].
5.1. Color, Glyphs, and Textures for Scientific Visualization Early work in the context of perception and visualization basically dates back to the mid-nineties, when Healey et al. discussed the effects of certain perceptual features and lowlevel processing. These features in particular included color, textures, and glyphs [HBE96, HE96, HE98, HE99, Hea00]. Subject of the investigations was how quickly these features are processed and if they perceptually interact (or interfere) with each other, thus making the visual task more difficult. Note that perceptual interactions are often not symmetric, so that a problematic combination is less or no longer problematic if permuted. In essence, color was identified as a very strong cue, which "pops-out" immediately, if chosen appropriately [HBE96]. Healey et al. showed that the linear separation in the CIE LUV color model was an important factor to allow quasi immediate low-level processing [HE96]. Furthermore they showed that orientation of glyphs is more difficult to use, if the deviating angle is too small [HBE96]. More problematic are combinations of color and orientation, if the relevant information is encoded in the orientation of the glyph, since color strongly interferes (or perceptually interacts) with orientation, thus making the interpretation of the relevant information very difficult [HBE96]. Interestingly, this is not a symmetric effect, and hence, orientation does not interfere with color. Therefore, a good representation should choose color as main cue over orientation. In 1998, Healey et al. extended this work to the generation of "perceptual textures" and examined the influence of height, density, and regularity of the placement of texture elements [HE98]. They determined a significant lowlevel effect of the height (vertical size of the elements), with no significant interference with the other feature parameters (density, regularity). In contrast, the information was difficult to see using density or regularity as parameter, which furthermore had a strong interference with the other parameters. The relationship between texture and color was examined in [HE99], which showed that color is a stronger cue, while texture suffers of interference with color. A closer examination of the role of orientation was presented Weigle et al. [WEL∗ 00], who stated that an orientation deviation of more than 15o is required to provide good differentiation in multifield datasets. Most of these techniques were also discussed in an application case study for oceanography [Hea98]. Special hatching textures to interpret shape were suggested by Interrante et al. [Int05]. Here, they claimed that the use of principal curvatures as directions for the texture
hatches is most effective, which was later experimentally shown [KHSI03, KHSI04]. This effect was recently used by Schaller et al. to improve the depth perception in virtual endoscopy applications [SWBB08]. Interrante furthermore discussed the use of natural textures for visualization [Int00], and of color, halos, and line-integral-convolution methods (LIC) for flow visualization [IG98]. In particular the context of LICs for flow animations and the role of color in the estimation of the velocity of the flow was discussed by Weiskopf [Wei04]. Six different vector field visualization methods using different glyph styled primitives for three different tasks were compared by Laidlaw et al. [LKJ∗ 05]. Although no method was the clear winner for all tasks, one method – GSTR that traced streamlines from seeds on a regular grid – performed well for most tasks and better than most methods. Laidlaw et al. credited this to the clear representation of the flow structure and the direction of the represented streamlines. The role of the perceptual interaction or interference between different glyph parameters was examined by Acevedo and Laidlaw [AL06]. The described a framework to quantify interference between brightness, size, and spacing [AL06, ACL07]. Several researchers examined the effective visualization of layered surfaces using texture, colors, and glyphs. Bair et al. discussed in a series of experiments different configurations of textured surface visualizations to improve the interpretation of surface orientation of two nested surfaces [BHW05, BHW06, HBW06, BH07] and suggested good combinations of texture hatch orientation, density, and opacities for the upper and lower surface. Similar, Weigle et al. discussed methods to visualize intersecting surfaces using surface glyphs, shadows, and color, where glyphs demonstrated the strongest effect [WT05]. The question of a perceived uniform color space – where changes in the color diagram correspond to the perceived distance – is an important question for visualization. Rheingans et al. [Rhe92] discussed various color spaces for that property. The above mentioned CIE LUV space – where L represents luminance, and u and v together represent chromaticity – defines such a perceived uniform color space, in particular when L is kept constant [HE96]. However, the specification of isoluminant colors still remains difficult. Kindlmann et al. suggested to exploit face recognition abilities to specify two equal luminant colors [KRC02]. In their experiment, they could show that the face-based method product similar results as the competing method, but with a higher robustness or accuracy (lower standard deviation). Neumann et al. proposed a perceptually motivated approach to transform a color map into a gray map, and to resolve conflicts in a way to preserve good contrast [NCN07]. Other techniques to improve the perception of the shape of an object include shading methods to emphasize this information. Stewart used vicinity shading – taking into account neighborhood and distance information – to improve the perc The Eurographics Association 2008.
D. Bartz, D. Cunningham, J. Fischer, C. Wallraven / Perceptional Graphics
ception of volumetric data [Ste03]. Interrante discussed the use of shape halos to improve the shape perception of 3D flow visualization primitives [IG98]. Finally, stereoscopic rendering and transparency (opacity) were explored for improving depth perception. Kersten et al. observed in their experiment for volume datasets interpreted with pure absorptive media a significant correctness effect for stereoscopic rendering, but none for opacity or spatial frequency. Furthermore, no significant acceleration (time) effect was discovered with any method [KSTE05]. In the context of picture interpretation, Gooch and Gooch suggest to use matting to improve depth impression [GG05].
5.2. Illustrative Visualization (NPR) Illustrative visualization represents a direction in visualization that uses methods inspired from illustrators or artists to present meaningful information. In particular in rendering, this kind of techniques are called non-photorealistic rendering, or NPR. Since most visual representation methods in visualization are non-photorealistic, while not being illustrative, many researchers propose the name illustrative visualization instead. In this paper, we adopt this terminology. Illustrative visualization methods aim at extracting the relevant information from the vast quantity of information in large datasets. The validation of the success of this objective requires the application of psychophysical experiments, which in particular for illustrative visualization are largely missing, or are based only on questionnaire-based experiments. This, however, is different in other application fields of illustrative techniques, such as stylized augmented reality or stylized facial animation (see Sections 3 and 4). One of the first studies to qualify the benefit of illustrative visualization was presented by Tietjen et al., who examined the use of illustrative visualization techniques for liver surgery planning [TIP05]. They concluded that surgeons tend to prefer de-emphasized context information with silhouettes for the focus objects. Ritter et al. studied the effects of four visualization techniques for the perception of blood vessel trees [RHD∗ 06] and showed that distancebased methods could be used effectively, while no significant improvement was shown for specific hatching techniques emphasizing the shape of the blood vessels. In contrast to these medical settings, Tateosian et al. proposed a painterly rendering scheme for weather visualization, mapping stroke size, stroke orientation, and stroke density of physical properties [THE07]. While their approach was motived by perception, they did not conduct a psychophysical study to underline their approach. This motivation is similar to the approach of Salah et al., who used different illustrative rendering styles to emphasis focus- and near-focus objects in anatomical datasets [SBS05]. c The Eurographics Association 2008.
5.3. Focus and Context, Motion, and Scaling Several perception-motived methods have been proposed in the context of information visualization. Most of these methods address highlighting methods to emphasize elements of interests, such as nodes and links in graphs. Among those lines, Kosara et al. discussed a focus and context technique using blurring [KMH02]. This technique, called semantic depth of field (SDOF), was examined in a psychophysical experiment in which the subjects had to detect and locate objects. The summary of the results of this experiment (low response time) indicated low-level processing (called preattentive) and showed that SDOFs have no interference with color, thus enabling the use of both. The techreport providing the details of this experiment [GTS∗ 01] is, however, not available online. Other focus and context techniques are fisheye transformations [Fur86], where the center of the respective region is enlarged much larger than the vicinity. The region between is scaled with intermediate factors, which are non-linearly interpolated between the center and boundary factors. Lau et al. showed with a psychophysical experiment that a nocost zone exists, in which such highly nonlinear transformations do not lead to any performance degradation [LRR04]. Furthermore, they described a larger low-cost zone, where the additional perceptual costs are small. Their study also showed that an additional, superimposed grid to represent the fisheye transformation has only a negligible performance effect. In a follow-on study, two of the previous authors showed similar effects for more distortion techniques (scaling, rotation, rectangular, and polar fisheye transformations) and mapped out the respective no-cost zones [LRR06]. That study also showed that the accuracy loss outside of the nocost zone is smaller for the polar fisheye transformation than for the rectangular variation. In contrast to their earlier work, however, they found a positive effect for the superimposed transformed grid, which extended the no-cost zones for all transformations, except the polar fisheye. The authors suggested that the lack of this effect is due to the already better performance of the polar transformation over the rectangular transformation [LRR06]. Another highlighting technique was suggested by Bartram et al., who use motion for grouping effects [BW02]. They examined how much attention draw linear motion, circular motion, expansion/contraction motions, and combinations of linear motions, and concluded that circular motion draws the strongest attention. Combinations of linear motion performed only similar when the angular difference between consecutive motions is larger than 90o . They furthermore showed that motion highlighting performs better than static shape or color highlighting methods [BWC03]. Similar, Ware and Bobrow examined oscillating motion to highlight nodes in large graphs and compared them to static highlighting methods [WB04]. While they showed here that motion highlighting was more effective than static highlighting,
D. Bartz, D. Cunningham, J. Fischer, C. Wallraven / Perceptional Graphics
they reported equal effectiveness in [WB05]. They credited the differences to larger graphs in the second study [WB05] and to the lack of taking interaction time into account in the first study [WB04]. The second 2005 study furthermore showed that a comparison tasks for two subgraphs was performed best if one subgraph was highlighted by motion, while the other subgraph was highlighted by a static method. Finally, Huber and Healey studied the effectiveness of flicker, directed motion, and motion velocity to encode multifield datasets [HH05]. They concluded that minimum parameters had to be considered, which where a minimum cycle length of 120ms for flicker, a minimum directional difference of 20o , and a minimal velocity difference of 16 pixels/second.
5.4. Perception-driven Visualization The last class of perception-driven visualization methods tries to use perception insights to steer the choice of visualization methods. In contrast to the rather anecdotal approach in the previous section on illustrative visualization, they aim at largely automated methods. One of the first of such approaches of Healey et al. was a data visualization assistant that encodes perceptual rules for color, luminance, size, density, and regularity for a search engine, which in turn ranks the results according to a perceptual saliency [HAE99]. They extended their approach to illustrative visualization methods in [HKR∗ 08] and use a mixed-initiative interaction to steer the search process. A similar approach was proposed by House et al., who use a human-in-the-loop approach to generate a large set of rated visualizations [HBW05, BHW06]. Data mining techniques like cluster analysis and principal component analysis (PCA) are then used to determine the basis for the parameter space and to find a good solution.
6. Biographies Dirk Bartz, University of Leipzig ICCAS, Semmelweisstr. 14, Leipzig, D04103, Germany Email:
[email protected] WWW: http://www.dirk-bartz.de Dirk Bartz is professor for computer-assisted surgery and head of the research group on "Visual Computing" (VCM) at the University of Leipzig. His recent works covers data visualization, perception driven visualization, illustrative visualization, augmented/mixed reality environments, perceptual graphics, and man-machine interfaces. Dirk studied computer science and medicine at the University of Erlangen-Nürnberg and at Stony Brook University. He received a Diploma (M.S.) in computer science from the University of Erlangen-Nürnberg, a Ph.D. in computer science in 2001 and a habilitation in computer science in 2005
from the University of Tübingen (both in Germany). His three most relevant publications: [PB07,WFC∗ 07,FCB∗ 06]. Douglas Cunningham, University of Tübingen WSI/GRIS, Sand 14, Tübingen, D72076, Germany Email:
[email protected] WWW: http://www.kyb.mpg.de/∼dwc Douglas Cunningham is head of the "Perceptual Graphics" research group at the University of Tübingen. His current research focuses on the conceptual and practical integration of computer graphics and perception research, with particular emphasis on facial animation and recognition as well as sensorimotor adaptation and postural control in real and virtual environments. Douglas studied Psychology, receiving a B.S. from the University of Washington, a M.S from the University of Georgia, and in 1997 a Ph.D. from Temple University. In 2007 he received his habilitation in Cognition Science (an integration of Computer Science and Psychology) from the University of Tübingen (in Germany). He worked as a senior research scientist for Logicon Technical Services, the Max Planck Institute for Biological Cybernetics, and the University of Tübingen. His three most relevant publications: [BCA∗ 05, CKWB05, CWFS07]. Jan Fischer, University of Victoria Dep. of Computer Science, ECS Building, Room 504, PO Box 3055, STN CSC, Victoria BC, V8W 3P6, Canada Email:
[email protected] WWW: http://www.janfischer.com Jan Fischer is a post-doctoral researcher in the Graphics research group at the University of Victoria (B.C., Canada). His research focuses on visual realism in composited real and virtual images, illustrative and artistic depiction, and the fusion of image stylization techniques and augmented reality. Jan received a Diploma (M.S.) in Computer Science from the University of Ulm (Germany). For his Master’s thesis, he worked as a student assistant at the DaimlerChrysler Virtual Reality Competence Center (VRCC) in Ulm. He received a Ph.D. from the University of Tübingen (Germany) in 2006. He was awarded a two year post-doctoral research fellowship by the German Research Foundation (DFG) in 2006 and the Südwestmetallpreis for young researchers by the industry association of Baden-Württemberg in 2007. His three most relevant publications: [FBS05c, FCB∗ 06, FFS07]. Christian Wallraven, Max-Planck-Institute for Biological Cybernetics Cognitive Psychophysics Department, Spemannstr. 34, Tübingen, D72076, Germany Email:
[email protected] WWW: http://www.kyb.mpg.de/∼walli Christian Wallraven is a senior research scientist in the c The Eurographics Association 2008.
D. Bartz, D. Cunningham, J. Fischer, C. Wallraven / Perceptional Graphics
Cognitive Psychophysics Department at the Max Planck Institute for Biological Cybernetics. His research focuses on fusing computer vision, machine learning, computer graphics, and psychophysics to investigate the fundamental processes of human cognition and behavior that underlie face and object recognition as well as multi- sensory learning of objects. Christian received his Diploma and in 2006 his Ph.D. in Physics from the University of Tübingen for work conducted at the Max Planck Institute. He co-chaired an international conference on Biologically Motivated Computer Vision, as well as the fourth symposium on Applied Perception in Graphics and Visualization, and has authored multiple papers in the fields of computer vision, and CGdriven perception research. His three most relevant publications: [WBCB07, WFC∗ 07, GCWB07]. References [ABB∗ 01] A ZUMA R., BAILLOT Y., B EHRINGER R., F EINER S., J ULIER S., M AC I NTYRE B.: Recent Advances in Augmented Reality. IEEE Computer Graphics and Applications 21, 6 (2001), 34–47. [ACL07] ACEVEDO D., C HEN J., L AIDLAW D.: Modeling Perceptual Dominance Among Visual Cues in Multilayered Iconbased Scientific Visualizations. In IEEE Visualization Posters (2007). [AL06] ACEVEDO D., L AIDLAW D.: Subjective Quantification of Perceptual Interactions among some 2D Scientific Visualization Methods. In Proc. of IEEE Visualization (2006), pp. 1133– 1140. [BAR08] BARCO: Small Environment Enhanced Reality display system. http://www.barco.com/corporate/ en/products/product.asp?gennr=1517, 2008. [BCA∗ 05] B ÜLTHOFF H., C UNNINGHAM D., A DELSTEIN B., M AGNENAT-T HALMANN N., M ANIA K., M OURKOUSSIS N., T ROSCIANKO T., S WAN II E.: Human-Centred Fidelity Metrics for Virtual Environment Simulations. In IEEE Virtual Reality Tutorials (2005). [BH07] BAIR A., H OUSE D.: A Grid with A View: Optimal Texturing for Perception of Layered Surface Shape. In Proc. of IEEE Visualization (2007). [BHW05] BAIR A., H OUSE D., WARE C.: Perceptually Optimizing Textures for Layered Surfaces. In Proc. of Symposium on Applied Perception in Graphics and Visualization (2005). [BHW06] BAIR A., H OUSE D., WARE C.: Texturing of Layered Surfaces for Optimal Viewing. In Proc. of IEEE Visualization (2006), pp. 1125–1132. [BKY99] B ELHUMEUR P., K RIEGMAN D., Y UILLE A.: The Bas-Relief Ambiguity. Int. J. Comput. Vision 35, 1 (1999), 33– 44. [BM98] B OLIN M., M EYER G.: A Perceptually Based Adaptive Sampling Algorithm. In SIGGRAPH 98 Conference Proceedings, Annual Conference Series (1998), 299 – 310. [BW02] BARTRAM L., WARE C.: Filtering and Brushing with Motion. Journal of Information Visualization 1, 1 (2002), 66– 79. c The Eurographics Association 2008.
[BWC03] BARTRAM L., WARE C., C ALVERT T.: Moticons: Detection, Distraction and Task. International Journal of HumanComputer Studies 58, 5 (2003), 515–545. [BWCB03] B REIDT M., WALLRAVEN C., C UNNINGHAM D., B ÜLTHOFF H.: Facial Animation Based on 3D Scans and Motion Capture. In ACM SIGGRAPH Sketches Program (2003). [CCB00] C HATZIASTROS A., C UNNINGHAM D., B ÜLTHOFF H.: Can We Be Forced Off the Road by the Visual Motion of Snowflakes?- Immediate and Longer-Term Responses to Visual Perturbations. Perception 29 (2000), 118. [CDdS06] C HALMERS A., D EBATTISTA K., DOS S ANTOS L.: Selective Rendering: Computing Only What You See. In Proc. of GRAPHITE (2006), pp. 9–18. [CKWB05] C UNNINGHAM D., K LEINER M., WALLRAVEN C., B ÜLTHOFF H.: Manipulating Video Sequences to Determine the Components of Conversational Facial Expressions. ACM Transactions on Applied Perception 2, 3 (2005), 251–269. [Coo84] C OOK R.: Shade Trees. In Proc. of ACM SIGGRAPH (1984), vol. 18, pp. 223–231. [CSD93] C RUZ -N EIRA C., S ANDIN D., D E FANTI T.: SurroundScreen Projection-Based Virtual Reality: The Design and Implementation of the CAVE. In Proc. of ACM SIGGRAPH (1993), pp. 135–142. [CWFS07] C UNNINGHAM D. W., WALLRAVEN C., F LEMING R. W., S TRASSSER W.: Perceptual Reparameterization of Material Properties. In Proc. of International Symposium on Computational Aesthetics in Graphics, Visualization, and Imaging (2007), pp. 89–96. [Dal93] DALY S.: Digital Images and Human Vision. MIT Press, Cambridge, 1993, ch. The Visible Differences Predictor: An Algorithm for the Assessment of Image Fidelity, pp. 179–206. [FBS05a] F ISCHER J., BARTZ D., S TRASSER W.: Artistic Reality: Fast Brush Stroke Stylization for Augmented Reality. In Proc. of ACM Symposium on Virtual Reality Software and Technology (2005), pp. 155–158. [FBS05b] F ISCHER J., BARTZ D., S TRASSER W.: Reality Tooning: Fast Non-Photorealism for Augmented Video Streams. In Proc. of IEEE and ACM International Symposium on Mixed and Augmented Reality Posters (2005), pp. 186–187. [FBS05c] F ISCHER J., BARTZ D., S TRASSER W.: Stylized Augmented Reality for Improved Immersion. In Proc. of IEEE Virtual Reality (2005), pp. 195–202. [FBS06] F ISCHER J., BARTZ D., S TRASSER W.: The Augmented Painting. In ACM SIGGRAPH Emerging Technologies (2006). [FCB∗ 06]
F ISCHER J., C UNNINGHAM D., BARTZ D., WALL C., B ÜLTHOFF H., S TRASSER W.: Measuring the Discernability of Virtual Objects in Conventional and Stylized Augmented Reality. In Proc. of Eurographics Symposium on Virtual Environments (2006), pp. 53–61. RAVEN
[FDA03] F LEMING R., D ROR R., A DELSON E.: Real World Illumination and the Perception of Surface Reflectance Properties. Journal of Vision 3, 5 (2003), 347–368. [Fec60] F ECHNER G. T.: Elemente der Psychophysik. Breitkopf und Hartel, Leipzig, 1860.
D. Bartz, D. Cunningham, J. Fischer, C. Wallraven / Perceptional Graphics [FFS07] F ISCHER J., F LOHR D., S TRASSER W.: Seamless Tangible Interaction through Selective Stylization. In ACM SIGGRAPH Sketches Program (2007). [FMHR86] F ISHER S., M C G REEVY M., H UMPHRIES J., ROBI NETT W.: Virtual Environment Display System. In Proc. of the Workshop on Interactive 3D graphics (1986), pp. 77–87. [Fur86] F URNAS G.: Generalized Fisheye Views. In Proc. of Human Factors in Computing Systems (1986), pp. 16–23. [GCWB07] G RIESSER R., C UNNINGHAM D., WALLRAVEN C., B ÜLTHOFF H.: Psychophysical Investigation of Facial Expressions Using Computer Animated Faces. In Proc. of Symposium on Applied Perception in Graphics and Visualization (2007), pp. 11–18. [Ges97] G ESCHEIDER G. A.: Psychophysics: The Fundamentals. Lawrence Erlbaum Associates, Mahwah, 1997. [GG05] G OOCH A., G OOCH B.: Enhancing Perceived Depth in Images Via Artistic Matting. In Proc. of International Symposium on Computational Aesthetics in Graphics, Visualization, and Imaging (2005), pp. 83–89. [GH79] G REGORY R., H EARD P.: Border Locking and the Café Wall Illusion. Perception 8 (1979), 365 – 380. [Gib79] G IBSON J. J.: The Ecological Approach to Visual Perception. Lawrence Erlbaum, Hillsdale, NJ, 1979. [GIS03] G ORLA G., I NTERRANTE V., S APIRO G.: Texture synthesis for 3d shape representation. IEEE Transactions on Visualization and Computer Graphics 9 (2003), 512 – 524. [GSH∗ 07] G ABBARD J., S WAN II J., H IX D., K IM S., F ITCH G.: Active Text Drawing Styles for Outdoor Augmented Reality: A User-Based Study and Design Implications. In Proc. of IEEE Virtual Reality (2007), pp. 35–42. [GTS∗ 01] G ILLER V., T SCHELIGI M., S CHRAMMEL J., F RÖH LICH P., R ABL B., K. R., M IKSCH S., H AUSER H.: Experimental Evaluation of Semantic Depth of Field, a Preattentive Method for Focus+Context Visualization. Tech. Rep. VRVis-2001-21, VRVis Research Center Wien, 2001. [HAE99] H EALEY C., A MANT R. S., E LHADDAD M.: ViA: A Perceptual Visualization Assistant. In Proc. of Workshop on Advanced Imagery Pattern Recognition (1999). [HBE96] H EALEY C., B OOTH K., E NNS J.: High-Speed Visual Estimation Using Preattentive Processing. ACM Transactions on Computer-Human Interaction 3, 2 (1996), 107–135. [HBW05] H OUSE D., BAIR A., WARE C.: On the Optimization of Visualizations of Complex Phenomena. In Proc. of IEEE Visualization (2005), pp. 12–19. [HBW06] H OUSE D., BAIR A., WARE C.: An Approach to the Perceptual Optimization of Complex Visualizations. IEEE Transactions on Visualization and Computer Graphics 12, 4 (2006), 509–521. [HE96] H EALEY C., E NNS J.: Choosing Effective Colours for Data Visualization. In Proc. of IEEE Visualization (1996), pp. 263–270. [HE98] H EALEY C., E NNS J.: Building Perceptual Textures to Visualize Multidimensional Datasets. In Proc. of IEEE Visualization (1998), pp. 111–118.
[HE99] H EALEY C., E NNS J.: Large Datasets at a Glance: Combining Textures and Colors in Scientific Visualization. IEEE Transactions on Visualization and Computer Graphics 5, 2 (1999), 145–167. [Hea98] H EALEY C.: On the Use of Perceptual Cues and Data Mining for Effective Visualization of Scientific Datasets. In Proc. of Graphics Interface (1998), pp. 177–184. [Hea00] H EALEY C.: Building a Perceptual Visualization Architecture. Behaviour and Information Technology 19, 5 (2000), 349–366. [HH05] H UBER D., H EALEY C.: Visualizing Data with Motion. In Proc. of IEEE Visualization (2005). [HIL∗ 05] H OUSE D., I NTERRANTE V., L AIDLAW D., TAYLOR R., WARE C.: Panel 1: Design and Evaluation in Visualization Research. In Panel 1, IEEE Visualization (2005). [HKR∗ 08] H EALEY C., KOCHERLAKOTA S., R AO V., M EHTA R., A MANT R. S.: Visual Perception and Mixed Initiative Interaction for Assisted Visualization Design. IEEE Transactions on Visualization and Computer Graphics 14, 2 (2008), 396–411. [HLB05] H ALLER M., L ANDERL F., B ILLINGHURST M.: A Loose and Sketchy Approach in a Mediated Reality Environment. In Proc. of ACM International Conference on Computer Graphics and Interactive Techniques in Australasia and Southeast Asia (Graphite) (2005), pp. 371–379. [IG98] I NTERRANTE V., G ROSCH C.: Visualizing 3D Flow. IEEE Computer Graphics and Applications 18, 4 (1998), 49–53. [Int00] I NTERRANTE V.: Harnessing Natural Textures for Multivariate Visualization. IEEE Computer Graphics and Applications, 6 (2000), 6–11. [Int05] I NTERRANTE V.: Illustrating Surface Shape in Volume Data via Principal Direction-Driven 3D Line Integral Convolution. In Proc. of ACM SIGGRAPH (2005), pp. 109–116. [IRLA07] I NTERRANTE V., R IES B., L INDQUIST J., A NDER SON L.: Elucidating the Factors that can Facilitate Veridical Spatial Perception in Immersive Virtual Environments. In Proc. of IEEE Virtual Reality (2007), pp. xx–xx. [Kaj86] K AJIYA J.: The Rendering Equation. In Proc. of ACM SIGGRAPH (1986), pp. 143–150. [Kan55] K ANIZSA G.: Margini quasi-percettivi in campi con stimolazione omogenea. Rivista di Psicologia 49 (1955), 7 – 30. [Kan79] K ANIZSA G.: Organization in Vision: Essays on Gestalt Perception. Praeger, New York, 1979. [Kan03] K ANT I.: Kritik der reinen Vernunft, Sonderausgabe 200. Todestages, seitenidentisch mit Bd. 505 der Philosophischen Bibliothek ed. Felix Meiner Verlag, Hamburg, 1787/2003. [KB99] K ATO H., B ILLINGHURST M.: Marker Tracking and HMD Calibration for a Video-Based Augmented Reality Conferencing System. In Proc. of IEEE and ACM International Workshop on Augmented Reality (1999), pp. 85–94. [KBF∗ 95] K RÜGER W., B OHN C., F RÖHLICH B., S CHÜTH H., S TRAUSS W., W ESCHE G.: The Responsive Workbench: A Virtual Work Environment. IEEE Computer 28, 7 (1995), 42–48. [KHG07] K NÖDEL S., H ACHET M., G UITTON P.: Enhancing the mapping between Real and Virtual World on Mobile Devices through efficient Rendering. In Proc. of Mixed Reality User Interfaces: Specification, Authoring, Adaptation (2007), pp. 53–54. c The Eurographics Association 2008.
D. Bartz, D. Cunningham, J. Fischer, C. Wallraven / Perceptional Graphics [KHI∗ 03] KOSARA R., H EALEY C., I NTERRANTE V., L AID LAW D., WARE C.: User Studies: Why, How, and When? IEEE Computer Graphics and Applications 23, 4 (2003), 20–25. [KHSI03] K IM S., H AGH -S HENAS H., I NTERRANTE V.: Conveying Shape with Texture: An Experimental Investigation of the Impact of Texture Type on Shape Categorization Judgments. In Proc. of IEEE Symposium on Information Visualization (2003). [KHSI04] K IM S., H AGH -S HENAS H., I NTERRANTE V.: Conveying Shape with Texture: Experimental Investigations of Texture’s Effects on Shape Categorization Judgments. IEEE Transactions on Visualization and Computer Graphics 10, 4 (2004). [KMH02] KOSARA R., M IKSCH S., H AUSER H.: Focus and Context Taken Literally. IEEE Computer Graphics and Applications 22, 1 (2002), 22–29. [Kof35] KOFFKA K.: Principles of Gestalt Psychology. Lund Humphries, London, 1935. [Köh29] 1929.
K ÖHLER W.: Gestalt Psychology. Liveright, New York,
[KRC02] K INDLMANN G., R EINHARD E., C REEM S.: Facebased Luminance Matching for Perceptual Colormap Generation. In Proc. of IEEE Visualization (2002), pp. 299–306. [KRFB06] K HAN E., R EINHARD E., F LEMING R., B ÜLTHOFF H.: Image-based Material Editing. In Proc. of ACM SIGGRAPH (2006), pp. 654–663. [KS91] K ELLMAN P., S HIPLEY T.: A Theory of Visual Interpolation in Object Perception. Cognitive Psychology 23 (1991), 141 – 221. [KSTE05] K ERSTEN M., S TEWARD J., T ROJE N., E LLIS R.: Enhancing Depth Perception in Translucent Volumes. In Proc. of IEEE Visualization (2005), pp. 1117–1124. [LBHD06] L ECUYER A., B URKHARDT J., H ENAFF J., D ONIKIAN S.: Camera Motions Improve the Sensation of Walking in Virtual Environments. In Proc. of IEEE Virtual Reality (2006), pp. 11–18. [Liv07] L IVINGSTONE M.: Perceptual Issues for Visualization and Evaluation. In IEEE Visualization Tutorials (2007). [LKJ∗ 05] L AIDLAW D., K IRBY R., JACKSON C., DAVIDSON S., M ILLER T., DA S ILVA M., WARREN W., TARR M.: Comparing 2D Vector Field Visualization Methods: A User Study,. IEEE Transactions on Visualization and Computer Graphics 11, 1 (2005), 59–70. [LKK∗ 07] L UO X., K ENYON R., K AMPER D., S ANDIN D., D E FANTI T.: The Effects of Scene Complexity, Stereovision, and Motion Parallax on Size Constancy in a Virtual Environment. In Proc. of IEEE Virtual Reality (2007), pp. 59–66. [LRR04] L AU K., R. R ENSINK T. M.: Perceptual Invariance of Nonlinear Focus+Context Transformations. In Proc. of Symposium on Applied Perception in Graphics and Visualization (2004).
[MDCT05] M ASTOROPOULOU G., D EBATTISTA K., C HALMERS A., T ROSCIANKO T.: The Influence of Sound Effects on the Perceived Smoothness of Rendered Animations. In Proc. of Symposium on Applied Perception in Graphics and Visualization (2005), pp. 9–15. [MDMS05] M ANTIUK R., DALY S., M YSZKOWSKI K., S EIDEL H.: Predicting Visible Differences in High Dynamic Range Images: Model and its Calibration. In Human Vision and Electronic Imaging X. Proceedings of the SPIE (2005), vol. 5666, pp. 204– 214. [Min61] M INDAK W. A.: Fitting the Semantic Differential to the Marketing Problem. Journal of Marketing 25 (1961), 28 – 33. [NCN07] N EUMANN L., C ADÍK M., N EMCSICS A.: An Efficient Perception-based Adaptive Color to Gray Transformation. In Proc. of International Symposium on Computational Aesthetics in Graphics, Visualization, and Imaging (2007), pp. 73–80. [NCWB05] N USSECK M., C UNNINGHAM D., WALLRAVEN C., B ÜLTHOFF H.: Perceptual Validation of Facial Animation: The Role of Prior Experience. Perception 34 (2005), 186. [OD01] O’S ULLIVAN C., D INGLIANA J.: Collisions and perception. ACM Transactions on Graphics 20 (2001), 151 – 168. [OHM∗ 04] O’S ULLIVAN C., H OWLETT S., M ORVAN Y., M C D ONNELL R., O’C ONOR K.: Perceptually Adaptive Graphics. In STAR Proceedings of Eurographics 2004 (2004), pp. 141– 164. [OKS03] O LANO M., K UEHNE B., S IMMONS M.: Automatic Shader Level of Detail. In Proc. of Eurographics/SIGGRAPH Workshop on Graphics Hardware (2003), pp. 7–14. [OST57] O SGOOD C., S UCI G. J., TANNENBAUM P. H.: The Measurement of Meaning. University of Illinois Press, Urbana, 1957. [PB07] P REIM B., BARTZ D.: Visualization in Medicine - Theory, Algorithms, and Applications. Morgan Kaufman Publishers, Burlington, 2007. [Pel05] P ELLACINI F.: User-configurable Automatic Shader Simplification. In Proc. of ACM SIGGRAPH (2005), pp. 445–452. [Per85] P ERLIN K.: An Image Synthesizer. In Proc. of ACM SIGGRAPH (1985), pp. 287–296. [PFFG98] PATTANAIK S., F ERWERDA J., FAIRCHILD M., G REENBERG D.: A multiscale/model of adaptation and spatial vision for realistic image display. Proc. of SIGGRAPH 1998 (1998), 287 – 298. [PFG00] P ELLACINI F., F ERWERDA J., G REENBERG D.: Toward a Psychophysically-Based Light Reflection Model for Image Synthesis. In Proc. of ACM SIGGRAPH (2000), pp. 55–64. [POAU00] P EERCY M., O LANO M., A IREY J., U NGAR P.: Interactive Multi-pass Programmable Shading. In Proc. of ACM SIGGRAPH (2000), pp. 425–432.
[LRR06] L AM H., R. R ENSINK T. M.: Effects of 2D Geometric Transformations on Visual Memory. In Proc. of Symposium on Applied Perception in Graphics and Visualization (2006).
[RFWB07] R AMANARAYANAN G., F ERWERDA J., WALTER B., BALA K.: Visual Equivalence: Towards a new Standard for Image Fidelity. In Proc. of ACM SIGGRAPH (2007), p. 76.
[LTMB07] L ENGGENHAGER B., TADI T., M ETZINGER T., B LANKE O.: Video Ergo Sum: Manipulating Bodily SelfConsciousness. Science 317, 5841 (2007), 1096–1099.
[RHD∗ 06] R ITTER F., H ANSEN C., D ICKEN V., KONRAD O., P REIM B., P EITGEN H.: Real-Time Illustration of Vascular Structures. In Proc. of IEEE Visualization (2006), pp. 877–884.
c The Eurographics Association 2008.
D. Bartz, D. Cunningham, J. Fischer, C. Wallraven / Perceptional Graphics [Rhe92] R HEINGANS P.: Color, Change and Control for Quantitative Data Display. In Proc. of IEEE Visualization (1992), pp. 252–259.
[VLD07] VANGORP P., L AURIJSSEN J., D UTRÉ P.: The Influence of Shape on the Perception of Material Reflectance. In Proc. of ACM SIGGRAPH (2007), pp. 77–86.
[Ric38] R ICHARDSON M.: Multidimensional Psychophysics. Psychological Bulletin 35 (1938), 659 – 660.
[VMKK00] VOLEVICH V., M YSZKOWSKI K., K HODULEV A., KOPYLOV E.: Using the Visual Differences Predictor to Improve Performance of Progressive Global Illumination Computation. ACM Transactions on Graphics 19 (2000), 122 – 161.
[RvB05] R IECKE B., VON DER H EYDE M., B ÜLTHOFF H.: Visual cues can be sufficient for triggering automatic, reflexlike spatial updating. ACM Transactions on Applied Perception 2, 3 (2005), 183–215.
[vW05] VAN W IJK J.: The Value of Visualization. In Proc. of IEEE Visualization (2005), pp. 11–18.
[SAB07] S EWARD A., A SHMEAD D., B ODENHEIMER B.: Using Virtual Environments to Assess Time-to-Contact Judgments from Pedestrian Viewpoints. ACM Transactions on Applied Perception 4, 3 (2007), 18.
[War92] WARD G.: Measuring and Modeling Anisotropic Reflection. In Proc. of ACM SIGGRAPH (1992), pp. 265–272.
[SBS05] S ALAH S., BARTZ D., S TRASSER W.: Composite Rendering Styles for Emphasized Illustrative Visualization. Tech. Rep. WSI-2005-20, Wilhelm-Schickard-Institut für Informatik, Universität Tübingen, 2005.
[WB04] WARE C., B OBROW R.: Motion to Support Rapid Interactive Queries on Node-Link Diagrams. ACM Transactions on Applied Perception 1, 1 (2004), 3–18.
[SF06] S CHUBERT E., FABIAN D.: The Dimensions of Baroque Music Performance: a Semantic Differential Study. Psychology of Music 34 (2006), 573 – 587. [Spe04] S PEARMAN C.: ’General intelligence’ objectively determined and measured. American Journal of Psychology 5 (1904), 201 – 293.
[War00] WARE C.: Information Visualization. Morgan Kaufmann, 2000.
[WB05] WARE C., B OBROW R.: Supporting Visual Queries on Medium-sized Node-Link Diagrams. Journal of Information Visualization 4, 1 (2005), 49–58. [WBCB07] WALLRAVEN C., B REIDT M., C UNNINGHAM D., B ÜLTHOFF H.: Evaluating the Perceptual Realism of Animated Facial Expressions. ACM Transactions on Applied Perception 2, 3 (2007).
[SSRMF06] S IFAKIS E., S ELLE A., ROBINSON -M OSHER A., F EDKIW R.: Simulating Speech with a Physics-based Facial Muscle Model. In Proc. of the ACM SIGGRAPH/Eurographics Symposium on Computer Animation (2006), pp. 261–270.
[WBF∗ 07]
[Ste03] S TEWART J.: Vicinity Shading for Enhanced Perception of Volumetric Data. In Proc. of IEEE Visualization (2003), pp. 355–362.
[WBSS04] WANG Z., B OVIK A., S HEIKH H., S IMONCELLI E.: Image Quality Assessment: From Error Visibility to Structural Similarity. IEEE Transactions on Image Processing 13, 4 (2004), 600–612.
[Swa07] S WAN E.: Experimental Design and Analysis for Human-Subject Visualization Experiments. In IEEE Visualization Tutorials (2007). [SWBB08] S CHALLER C., W ELLEIN D., B ORN S., BARTZ D.: Hatch Textures for Virtual Endoscopy. In Proc. of Bildverarbeitung für die Medizin (2008), Informatik Aktuell. [THE07] TATEOSIAN L., H EALEY C., E NNS J.: Engaging Viewers Through Nonphotorealistic Visualizations. In Proc. of Symposium on Non-Photorealistic Animation and Rendering (2007), pp. 93–102. [Tho06] T HOMAS B.: Evaluation of Three Input Techniques for Selection and Annotation of Physical Objects Through an Augmented Reality View. In Proc. of IEEE and ACM International Symposium on Mixed and Augmented Reality (2006), pp. 33–36. [TIP05] T IETJEN C., I SENBERG T., P REIM B.: Combining Silhouettes, Shading, and Volume Rendering for Surgery Education and Planning. In Proc. of Eurographics/IEEE Symposium on Visualization (2005), pp. 303–310.
WALLRAVEN C., B ÜLTHOFF H., F ISCHER J., C UN D., BARTZ D.: Evaluation of Real-World and Computer-Generated Stylized Facial Expressions. ACM Transactions on Applied Perception 4, 3 (2007), 1 – 24. NINGHAM
[Wei04] W EISKOPF D.: On the Role of Color in the Perception of Motion in Animated Visualizations. In Proc. of IEEE Visualization (2004), pp. 305–312. [WEL∗ 00] W EIGLE C., E MIGH W., L IU G., TAYLOR R., E NNS J., H EALEY C.: Oriented Texture Slivers: A Technique for Local Value Estimation of Multiple Scalar Fields. In Proc. of Graphics Interface (2000), pp. 163–170. [WFC∗ 07] WALLRAVEN C., F ISCHER J., C UNNINGHAM D., BARTZ D., B ÜLTHOFF H.: The Evaluation of Real-World and Computer-Generated Stylized Facial Expressions. ACM Transactions on Applied Perception to appear, x (2007). [WT05] W EIGLE C., TAYLOR R.: Visualizing Intersecting Surfaces with Nested-Surface Techniques. In Proc. of IEEE Visualization (2005), pp. 64–71.
[TK06] T ÖNNIS M., K LINKER G.: Effective Control of a Car Driver’s Attention for Visual and Acoustic Guidance towards the Direction of Imminent Dangers. In Proc. of IEEE and ACM International Symposium on Mixed and Augmented Reality (2006), pp. 13–22. [Vin95] V INCE J.: Virtual Reality Systems. Addison-Wesley, 1995. c The Eurographics Association 2008.