Towards mapping the field of Non-Photorealistic Rendering Amy A. Gooch∗ University of Victoria
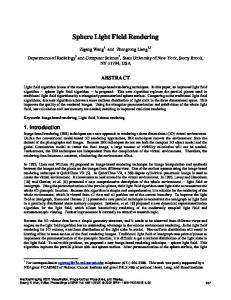
Figure 1: The first two images document high and low tide. A comparison between the first two images has a high cognitive overload. However, as shown in hand made example in the last image, mapping the difference between the two images to a easily distinguishable image feature such as multiple tide lines, color-coded by time of day provides the viewer with a much easier notion of tide levels in a single image. c Source photographs 2008 Erik Rasmussen. http://www.erik-rasmussen.com/blog/2008/07/01/timelapse-tides/.
Abstract
changes in position, intensity, shape, orientation, or depth of field in that film image.
Non-photorealistic rendering (NPR) as a field of research is generally described by what it is not and as a result it is often hard to embrace the strengths of non-photorealistic rendering as a discipline beyond digitizing or replicating traditional artistic techniques. Towards generating more discussion within the discipline, this paper provides a simple theory of NPR as a way of mapping perceived changes in a scene to perceived changes in a display. One can think of a photorealistic image as one that preserves a one-to-one mapping, such that parameters such as color, intensity, texture, edges, etc. in a scene are mapped to the same parameters in the display. NPR mappings are not one-to-one. For example edges in a scene may be mapped to black lines to generate a cartoon effect. Within this framework of mappings, a partial listing of previous techniques within the discipline is provided. The aim of this paper is to provide a type of road map to stimulate the future growth of the area of non-photorealistic rendering.
Removing the requirement of one-to-one mappings enables new opportunities for effectively conveying information in images. In the scene observing the tide levels above, a single image could capture changes in tide levels by denoting the tide levels with multiple lines, color-coded by time of day. In this example, illustrated in Figure 1, tide position in an image maps to line position and time maps to line color. In this paper, I will provide descriptions of several previous methods that have explored this vast domain of alternatives to traditional one-to-one mappings as well as set the stage for areas yet unexplored and put forth a challenge to the community to think about non-photorealistic rendering (NPR) as domain of mappings.
2
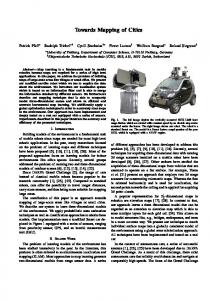
Change sensing is an intrinsic component of vision. Accordingly, recording and conveying change should be an intrinsic part of image creation. Vision scientists hypothesize that the human visual system does not perceive absolute values, and instead chrominance and luminance perception are based upon relative assessments, in part due to the center-surround organization of cells in the early stages of visual processing [Lotto and Purves 1999], as illustrated in Figure 2.
Keywords: non-photorealistic rendering, mapping
1
Introduction
While the human visual system is acutely sensitive to many kinds of visible change, until the advent of computable images these changes were largely restricted to simple one-to-one mappings from a scene to an image that represents the scene. For example, suppose we wish to depict a beach or seaside scene, and somehow capture changes in tide levels within a single photograph. If we only use photographic film, our abilities to capture these changes are severely restricted. We could not map tide level changes to ∗ e-mail:
Mapping NPR
I propose that preserving relationships between nearby pixels in an image is much more important than preserving the absolute pixel values themselves. Such relationships can be as simple as chrominance or luminance differences between nearby pixels, or as complex and abstract as context-based information. For example, a pixel’s membership in a region labeled as human, grass texture, or convex shadowed shape should affect any changes or manipulations to that pixel or its neighbors in order preserve contextual or semantic relationships. Based upon the idea that difference-preserving mappings enable the preservation of salient or important features, this paper explores mappings that preserve the semantic information contained in imagery even if pixel values of color and intensity from the scene are not strictly preserved.
[email protected]
Copyright © 2010 by the Association for Computing Machinery, Inc. Permission to make digital or hard copies of part or all of this work for personal or classroom use is granted without fee provided that copies are not made or distributed for commercial advantage and that copies bear this notice and the full citation on the first page. Copyrights for components of this work owned by others than ACM must be honored. Abstracting with credit is permitted. To copy otherwise, to republish, to post on servers, or to redistribute to lists, requires prior specific permission and/or a fee. Request permissions from Permissions Dept, ACM Inc., fax +1 (212) 869-0481 or e-mail
[email protected]. NPAR 2010, Annecy, France, June 7 – 10, 2010. © 2010 ACM 978-1-4503-0124-4/10/0006 $10.00
Typically, computer graphics algorithms map the color and inten-
159
color intensity texture position orientation shape edges motion light direction depth of field
si tex ty tu re po sit io or n ie nt a sh tion ap e ed ge s m ot io n lig ht di de rec tio pt h of n fie ld
in te n
lo r co
Changes in a Scene
Changes in a Display
1 1 1 1 1 1 1 1 1 1
Figure 3: Mapping from perceived visible parameters in a scene to a display. The ”1”s represent a one-to-one mapping. I believe that as long as the magnitude of the differences in the visible parameters (i.e. color, intensity, ..., motion) are preserved, there are many mappings off the diagonal to explore.
(a) Color Source
(c) New Color2Grey
Figure 4: Comparison of traditional and new color-to-grayscale conversion. a) Source color image. b) Converting the source image to grayscale by discarding all but the CIE Y channel results in the loss of important image features visible in the color image, such as the sun and its reflection in the water. c) Preliminary results of our algorithm incorporate changes available in the chrominance channels into a new luminance-only image. Image used with perc 2005 Amy Gooch and the ACM. mission,
Figure 2: Chrominance and luminance perception are based on relative assessments. Although the orange squares on the center top and the center front appear to have difference chrominance and luminance values (Left), their pixel values are exactly the c 2006 Lotto and Purves http://www. same (Right). Images lottolab.org.
sity viewed in a 3D scene to a pixel value on a display device with no other coupling between pixel values. In order to take a more general view and consider the set of all potential mappings, converting from changes in a scene to changes in an image for display can be organized as a matrix of mappings, as shown in Figure 3. The potential mappings in the matrix of Figure 3 include a partial set of the visible parameters sensed by the human visual system [Palmer 1999], as well a few common rendering parameters. The matrix is not complete; many more parameters could be included such as viewpoint, illumination, transparency, and reflectance.
a traffic sign, or a repair manual are different. In ”An Invitation to Discuss Computer Depiction”, Durand [Durand 2002] generalized Willat’s approach for basic depiction techniques, describing four kinds of system mappings: spatial, primitive, attributes, and marks. The spatial system, with respect to traditional computer graphics techniques, typically maps 3D spatial properties to 2D spatial properties. The primitive system maps object space primitives (points, lines, surfaces, volumes) to picture space primitives (points, lines, regions). The attribute system maps visual properties such as color, texture, and orientation to picture primitives. The mark system places primitives at their spatial location with the corresponding attributes. The goals of Durand and the work presented in this paper for optimizing image creation for the sake of communication are the same. However, I claim that although it is important to understanding and use these mappings carefully, enforcing mappings that preserve the changes they represent is of primary importance for maximizing communication content of images.
The main diagonal of this matrix represents the ideal of photorealistic rendering: every scene change is faithfully reproduced on the display. Photorealistic rendering copies changes in a scene to changes in a display, discarding other possibilities that may be equally or potentially more effective at communicating content and context, such as the technical illustrations in Figure 5. I believe nonphotorealistic rendering is an attempt to create effective imagery by exploring mappings off the main diagonal of this matrix.
3
(b) Default Grayscale
The computer graphics literature and the images around us provide many examples of effective imagery or imaging techniques that fit within the paradigm of off-diagonal change-based mappings.
Examples of mappings
The notion of images as a mapping of a view of the world is not new. Willats [Willats 1990] developed a structural language to describe ”how” pictures such as a work of fine art, a child’s drawing,
Color to Intensity. As shown in Figure 4, visible boundaries between isoluminant colors are lost in the default grayscale con-
160
(a) Edges to lines
(b) Lighting to Color
Figure 5: Examples of visually effective change-based mappings c 1999 Amy Gooch and the ACM. across different domains.
version. Gooch et al. [Gooch et al. 2005] presented a method to incorporate the perceived boundaries in the color image into the grayscale image.
Figure 6: Mapping luminance to line density. Computer-generated pen-and-ink illustrations map illumination changes to texture or c 1994 Winkenbach and Salesin, and the line density changes. ACM.
Color to Texture. Qu et al.[Qu et al. 2008] have an explicit goal of preserving the relative differences between colors in their bitonal Manga style images that map color to pattern. Given a color photograph, their technique generates a mapping between colors in the image and black and white screen patterns through multidimensional scaling in order to preserve the tone similarity, texture similarity, and chromaticity distinguishability. Edges to Lines. My previous research examined automatic creation of technical illustrations from 3D geometric models by mapping view-dependent and view-independent feature edges to lines [Gooch et al. 1998; Gooch 1998; Gooch et al. 1999], as shown in Figure 5(a). DeCarlo et al. [DeCarlo et al. 2003] generated additional lines in order to incorporate feature edges from nearby views, creating a mapping to lines from current edges and nearby viewdependent edges (Figure 7).
c 2003 Doug DeCarlo Figure 7: Mapping feature edges to lines. and the ACM.
Luminance to Line Density. Early non-photorealistic rendering techniques for computer-generated pen-and-ink illustration [Winkenbach and Salesin 1994; Salisbury et al. 1997] mapped illumination changes to texture or line density changes (Figure 6) in order to visually indicate light direction. While line features alone cannot show shading, line density or spacing can convey surface tone and therefore can effectively replace smooth shading effects.
strong), pressure (small to large for low to high), and precipitation (upright to flat for light to heavy) as shown in Figure 9. Such methods create a mapping from abstract quantities to shape and color, enabling the communication of complex, multi-dimensional ideas in a single image.
Lighting to Color. Spectral highlights and black edge lines often cannot be added to a fully shaded model because the highlights would be invisible in the light regions and the feature edges would be invisible in the dark or shadowed regions. To solve this problem, Gooch et al. [Gooch et al. 1998] created a new shading model which varies light chrominance and luminance based upon lighting direction, making lit regions more yellowish and shadowed regions more bluish, creating a mapping from lighting direction to light color (Figure 5(b)).
Texture to Motion. Using images projected onto 3D shapes, Raskar et al. [Raskar et al. 2002] created a cartoon-like environment in which a static 3D model of a car appears to move. Their method induced the appearance of motion using shadows, lighting, and texture, forcing temporary 3D interpretation errors. By changing the textures on the wheels and body of the car, instead of changing the backdrop, they were able to alter the apparent motion of the car moving forward, on bumpy surfaces, or even shearing to indicate sudden acceleration (Figure 10).
Shape to Texture. Research by Interrante and colleagues [Kim et al. 2004; Interrante 1997] derived a mapping from shape to texture and performed user studies demonstrating that users can more reliably infer the 3D structure of the underlying shape when their shape-texture techniques are applied (Figure 8).
Deviations in Shape to Exaggerations in Shape. Facial caricatures map deviations of features in a source face from an “average” face to exaggerations in the source face. Studies conducted by Gooch et al. [Gooch et al. 2004] show that these exaggerations in black-and-white illustrations, as shown in Figure 11, are as effective as photographs in recognition tasks. Additionally, the mapping of grayscale photographs to black-and-white illustrations and caricatures also decreases the learning time for new names presented with new faces.
Abstract Quantities to Shape. Glyphs, or specific symbols that represent a semantic unit, are a common method for mapping shapes to abstract or concrete ideas. Healey et al. [Healey et al. 2004] rendered glyphs representing temperature (dark blue to bright pink for cold to hot), wind speed (low to high coverage for weak to
Multiple Depths of Field mapped to Focus.
161
Agarwala et
al. [Agarwala et al. 2004] created an image with an extended focal range from a series of image taken with different depths of focus, as shown in Figure 12. This mapping creates a single image with a large depth of field from multiple images with different focal lengths. Time to Position. Line scan cameras capture the photo-finish of events, such as the race show in Figure 13, and create a mapping from time to position in the final image. This type of mapping records which body part crossed the finish line first; as can be scene with the seemingly impossible middle figure in Figure 13, the foot arrived at nearly the same time as the head, but stayed planted at the finish-line while the rest of the body proceeded forward. The line scan camera enables the capture and display of such finish line details in a single image. Position to Velocity. Blink comparisons map changes in position to changes or reversals in velocity. The American astronomer Clyde William Tombaugh discovered the planet Pluto in 1930 [Levy 2006] by capturing photographs of sections of the sky taken several nights apart and then comparing them via a blink comparator, shown in Figure 14. The blink comparator enabled Tombaugh to compare the two images with the assumption that any moving object such as a planet would appear to jump from one position to another, while the more distant objects such as stars would remain stationary.
4
Figure 9: Mapping multi-dimensional quantities to shape. Healey et al. [Healey et al. 2004] rendered glyphs representing temperature (dark blue to bright pink for cold to hot), wind speed (low to high coverage for weak to strong), pressure (small to large for low to c 2004 high), and precipitation (upright to flat for light to heavy). Christopher Healey and the ACM.
Conclusion
Although some off-axis mappings have been explored piecemeal and the proceeding research descriptions are not exhaustive, the matrix in Figure 3 reveals a much larger domain of maps that may hold valuable new image representations. Perhaps by methodical explorations of mappings from every domain to every other domain, many more new and important rendering possibilities may be found. For instance, mappings that preserve the magnitude of the difference between regions can yield images with a much larger number of visual cues due to the increase in freedom to map intensity and color values to a much larger set of parameters, such as texture, lines, or glyphs. More importantly, information in a scene can be conveyed by mapping scene region differences to differences, or changes, in nearly any renderable visual parameter. Considering image creation and modification as matrix of change-based mappings leads to several interesting research questions: instead of manipulating digital images as independent pixel values can I manipulate them in a way that preserves perceived changes? What does this type of image manipulation do to the semantic information in the image? The creation of change-based mappings for images may have a broad impact on the field of non-photorealistic rendering, especially with respect to image representation and manipulation.
idea of what has and has not been done. The same matrix could be explored with respect to art history with the notion areas not explored with respect to traditional media of art may be areas for future NPR techniques due to the benefits of technology and the removal of the limitations of traditional media. Perhaps some of the off-diagonal mappings have not been explored because they will not work, but as the old adage says, only in asking questions will we find answers.
Acknowledgements Thanks to Jack Tumblin for the many discussions relevant to my research and to the Northwestern University Graphics group of the past. Thanks to the University of Victoria’s Graphics group. Most importantly, thanks to Bruce for everything. This material is based upon work supported by the NSERC Discovery Grant. Any opinions, findings, and conclusions or recommendations expressed in this material are those of the author and do not necessarily reflect the views of NSERC.
Mapping the areas of the matrix covered by NPR may give us an
References AGARWALA , A., D ONTCHEVA , M., AGARWALA , M., D RUCKER , S., C OLBURN , A., C URLESS , B., S ALESIN , D., AND C OHEN , M. 2004. Interactive digital photomontage. ACM Trans. Graph. 23, 3, 294–302. ALGE S PORTS T IMING S YSTEMS, 2006. cambrian-timing.co.uk/.
http://www.
D E C ARLO , D., F INKELSTEIN , A., RUSINKIEWICZ , S., AND S ANTELLA , A. 2003. Suggestive contours for conveying shape. ACM Trans. Graph. 22, 3, 848–855. D URAND , F. 2002. An invitation to discuss computer depiction. In NPAR ’02: Proceedings of the 2nd international symposium on
c 1997 Victoria Interrante. Figure 8: Mapping shape to texture.
162
(a) Input 1
(b) Input 6
(c) Input 12
(d) Result
Figure 12: Mapping from images with different depths of field (Input 1 .. 12) to create a single image with an extended depth of field. c 2004 [Agarwala et al. 2004] and the ACM.
(a) Perceived horizontal forward motion, background texture moves backward, wheels rotate.
(b) Bumpy movement on a rough surface.
Figure 13: Mapping time to position. Line scan cameras capture the photo-finish of events such as the race show above and create a mapping from time to position in the final image. Image used with permission, ALGE Sports Timing Systems [ALGE Sports Timing Systems 2006].
Non-photorealistic animation and rendering, ACM Press, New York, NY, USA, 111–124. G OOCH , A. A., G OOCH , B., S HIRLEY, P., AND C OHEN , E. 1998. A non-photorealistic lighting model for automatic technical illustration. In SIGGRAPH ’98: Proceedings of the 25th annual conference on Computer graphics and interactive techniques, ACM Press, New York, NY, USA, 447–452.
(c) Shear during acceleration.
Figure 10: Mapping changes in texture to motion. Raskar et al. [Raskar et al. 2002] created apparent motion by changing textures on car body and wheels relative to the background (dashed c 2002 Ramesh Raskar lines indicated resultant apparent motion). and the ACM.
G OOCH , B., S LOAN , P.-P., G OOCH , A. A., S HIRLEY, P., AND R IESENFELD , R. 1999. Interactive technical illustration. 1999 ACM Symposium on Interactive 3D Graphics (April), 31–38. ISBN 1-58113-082-1. G OOCH , B., R EINHARD , E., AND G OOCH , A. A. 2004. Human facial illustrations: Creation and psychophysical evaluation. ACM Trans. Graph. 23, 1, 27–44. G OOCH , A. A., O LSEN , S. C., T UMBLIN , J., AND G OOCH , B. 2005. Color2gray: salience-preserving color removal. In SIGGRAPH ’05: ACM SIGGRAPH 2005 Papers, ACM, New York, NY, USA, 634–639. G OOCH , A. A. 1998. Interactive Non-photorealistic Technical Illustration. Master’s thesis, University of Utah.
(a) Photograph
(b) Illustration
H EALEY, C. G., TATEOSIAN , L., E NNS , J. T., AND R EMPLE , M. 2004. Perceptually based brush strokes for nonphotorealistic visualization. ACM Trans. Graph. 23, 1, 64–96.
(c) Caricature
Figure 11: Caricatures map deviations in shape to exaggerations c 2004 Bruce Gooch. in shape.
I NTERRANTE , V. 1997. Illustrating surface shape in volume data via principal direction-driven 3D line integral convolution.
163
W INKENBACH , G., AND S ALESIN , D. H. 1994. Computergenerated pen-and-ink illustration. In SIGGRAPH ’94: Proceedings of the 21st annual conference on Computer graphics and interactive techniques, ACM Press, New York, NY, USA, 91–100.
Figure 14: Mapping position to velocity. Blink comparator at Lowell Observatory used in the discovery of Pluto. Image from Wikipedia and permission to distribute is granted under GNU Free Document License.
In SIGGRAPH ’97: Proceedings of the 24th annual conference on Computer graphics and interactive techniques, ACM Press/Addison-Wesley Publishing Co., New York, NY, USA, 109–116. K IM , S., H AGH -S HENAS , H., AND I NTERRANTE , V. 2004. Conveying shape with texture: experimental investigations of texture’s effects on shape categorization judgments. IEEE Transactions on Visualization and Computer Graphics 10, 4, 471–483. L EVY, D. H. 2006. Clyde Tombaugh: Discoverer of Planet Pluto. Sky Publishing Corporation, March. L OTTO , R. B., AND P URVES , D. 1999. The effects of color on brightness. Nature Neurosci. 2, 11, 1010–1014. PALMER , S. E., Ed. 1999. Vision Science: Photons to phenomenology. Massachusetts Institute of Technology Press. Q U , Y., PANG , W.-M., W ONG , T.-T., AND H ENG , P.-A. 2008. Richness-preserving manga screening. In SIGGRAPH Asia ’08: ACM SIGGRAPH Asia 2008 papers, ACM, New York, NY, USA, 1–8. R ASKAR , R., Z IEGLER , R., AND W ILLWACHER , T. 2002. Cartoon dioramas in motion. In NPAR ’02: Proceedings of the 2nd international symposium on Non-photorealistic animation and rendering, ACM Press, New York, NY, USA, 7–ff. S ALISBURY, M. P., W ONG , M. T., H UGHES , J. F., AND S ALESIN , D. H. 1997. Orientable textures for image-based penand-ink illustration. In SIGGRAPH ’97: Proceedings of the 24th annual conference on Computer graphics and interactive techniques, ACM Press/Addison-Wesley Publishing Co., New York, NY, USA, 401–406. W ILLATS , J. 1990. The draughtsman’s contract: how an artist creates an image. In Images and Understanding, H. Barlow, C. Blakemore, and M. Weston-Smith, Eds. Cambridge University Press, Cambridge, 235–255.
164