Understanding Protocol Performance and Robustness of Ad Hoc Networks Through Structural Analysis Chris Barrett 1 Martin Drozda 2 Dale C. Engelhart 3 V. S. Anil Kumar 4 Madhav V. Marathe 1 Monique M. Morin 5 S. S. Ravi 6 and James P. Smith 4 Abstract— There has recently been renewed interest among various research communities in understanding the structure of social and infrastructure networks. Motivated by this line of research, we conduct an in-depth structural analysis of large ad hoc networks derived by placing nodes randomly as well as by placing them in realistic urban environments, a scenario that is rapidly gaining interest [13]. We use structural analysis in two illustrative settings. First, we use it to study the performance of network protocols. Our results indicate that structural analysis of interference graphs that model ad hoc networks can yield a good first order prediction of the overall protocol performance. Second, we study the robustness of a network to random node and edge failures. This study is important in the context of ad hoc networks wherein one expects nodes/edges to fail due various natural or system dependent reasons. The experimental results presented in this paper show the following: (i) Structural properties of ad hoc networks depend crucially on the spatial distribution of the nodes. (ii) Structural properties of the network significantly affect the performance of protocols. (iii) Graph theoretic measures can provide good first order insights into the network protocol performance. (iv) The measures are also useful in characterizing the robustness of such networks.
Keywords: Graph analysis, simulation, protocol performance, network capacity, robustness. I. I NTRODUCTION There is currently considerable effort in characterizing the structural properties of social networks from a graph theoretic viewpoint [2], [12]. The primary motivation for such studies is that by suitable abstraction, many different aspects of these social networks can be understood by viewing them as transport networks. For example, transmission of an infectious disease takes place via social contacts between individuals. Similarly, wireline and wireless networks act as transport networks for digital data in the form of packets. The intent is to relate the structural properties of such transport networks to their performance and robustness. This research includes 1 Virginia Bioinformatics Institute, Virginia Tech, Blacksburg, VA 24061. Email: {cbarrett,mmarathe}@vbi.vt.edu. 2 Universit¨ at Hannover, FG Simulation und Modellierung, Welfengarten 1, 30167 Hannover, Germany. Email:
[email protected]. 3 Dept. of Computer Science and Engineering, Pennsylvania State University, University Park, PA 16802. Email:
[email protected]. 4 Basic and Applied Simulation Science (CCS-5) and National Infrastructure and Analysis Center (NISAC), Los Alamos National Laboratory, MS M997, P.O. Box 1663, Los Alamos, NM 87545. Email: {anil, jpsmith}@lanl.gov. 5 Department of Computer Science, University of New Mexico. Albuquerque, NM 87131. Email:
[email protected]. 6 Department of Computer Science, University at Albany - SUNY, Albany, NY 12222. Email:
[email protected].
the following three interwoven efforts: (i) explaining how such networks are formed, (ii) designing such networks for optimal performance and (iii) understanding intrinsic vulnerabilities of such networks and obtaining methods derived from structural analysis for mitigating these vulnerabilities. Albert and Barabasi [2] have highlighted the fact that “real world” graphs have a fundamentally different structure than traditional random graphs.7 More importantly, structural properties can often be used to explain several characteristics of such networks. Structural properties assume even greater significance in the context of protocol design problems in wireless networks, where protocols are often studied and tuned for random distributions of points. Motivated by this line of research, we undertake a similar study of ad hoc networks formed by a group of individual transceivers (nodes) communicating through the wireless medium. There is a natural way to construct the interference graph induced by a collection of communicating transceivers. Each transceiver has an associated broadcast range, and it can communicate with all transceivers within its range. In this work, we make two assumptions: (i) All nodes have the same broadcast range. (ii) The decay in power levels is insignificant inside the range and falls to zero outside the range. Under these assumptions, this graph theoretic model associates a unit disk graph (also called the interference graph; see Section IIA for a definition) with a group of transceivers. Although this is a fairly simplistic model, it captures the essence of the communication among the transceivers. Various modifications are possible and we refer the reader to [19] and Section II-A for further discussion. Here we extend the study of structural properties of ad hoc networks begun in [8]. We focus on some global properties that have a significant influence on protocol performance in and robustness of such networks. The global properties studied are shortest path lengths, size of distance-2 matching, and balanced cuts. The first is representative of the end-to-end delay in an ad hoc network, the second is related to the capacity of the MAC layer, and the third to the maximum network packet flow. The main contributions of this paper are summarized below. (1) We study two different spatial distributions of transceivers. The first (called the random distribution), is obtained by 7 We refer here to the type of random graphs often called Erd¨ os-R´enyi random graphs which are defined with a number of nodes (n) and a probability (p) for the existence of each edge [9]. The existence of an edge is independent of the other edges.
initially placing nodes uniformly randomly in the plane and then allowing them to move around randomly according to the Random Waypoint mobility model. This distribution has been studied extensively and serves as a benchmark for our comparisons [8]. We also study another class of spatial distributions (called structured distributions) obtained by placing transceivers in a realistic urban environment, namely along the roadway system in the city of Portland, OR (see Section II-B). Our results show that these random and structured spatial distributions produce structurally different communication networks (and yield different performance). Additionally, even different parts of a structured distribution could have very different structure, in contrast to random distributions, which are pretty uniform. Contrary to common practice of studying protocols for random distributions of points, we demonstrate the importance of using realistic distributions when simulating scenarios that are inherently structured. (2) We study the effects of structural properties on the performance of network protocols. This is especially crucial since most protocols are studied and optimized for random distributions of points; our results suggest that with the same parameters, protocols perform very differently on structured distributions. This motivates the need for understanding the properties of structured distributions. (3) We study the spatial variation in basic properties in structured distributions, and observe that if we take different sections of the city of Portland, several measures such as degree, clustering coefficient and shortest path distributions, and distance-2 matching sizes vary quite a bit. This is in contrast to random distributions, which are more or less spatially homogenous. While this observation may seem obvious, to the best of our knowledge, this is the first such quantitative demonstration of this fact. From protocol performance point of view, this means that protocol parameters need to be set non-uniformly, based on the spatial constraints. (4) Our results show that graph theoretic measures can be used to understand the trade-offs between network structure and protocol performance. As the transmission range of the devices in the ad hoc network increases, paths become shorter while the number of simultaneously active edges decreases. Correspondingly, the latency and the number of MAC control packets go down while the goodput and routing control packets go up. The obvious connection between the graph metrics and performance, coupled with the fact that the graph analysis can be done much faster than simulations, suggests that graph analysis may be useful in designing and assessing networks and obtaining first order predictions of overall protocol performance. (5) We also study the implications of the network structure on the robustness of the network under node/edge failures. This study is important in ad hoc networks wherein one expects nodes to fail routinely due various natural or system dependent reasons. This study is carried out in two steps. In the first step, we study the graph theoretic properties of a sequence of induced networks as nodes/edges fail (equivalently, as
nodes/edges are removed from the network). We then use a network simulator to see if the variation in the values of graph parameters correlates with the degradation in protocol performance. The results show that the impact of node/edge failures on the performance can be predicted to a reasonable degree using graph theoretic tools. A. Related Work In general, it is rather difficult to analyze ad hoc communication networks consisting of a large number of nodes. One factor that contributes to this difficulty is the interaction among the various levels in the network protocol stack [6], [20] and the varied performance of the protocols. A significant volume of research focuses on designing good protocols for different network layers. Since these protocols are hard to analyze theoretically, they are often evaluated empirically. While studying mobile ad hoc networks, researchers use simple mobility models (e.g. points moving randomly in the plane) to generate the underlying interference graphs, which they then use as test beds for their protocols. Protocols that might work well in such situations may behave very differently in real settings. Our thesis is that a study of the structural measures as undertaken in this paper is a good way to get a rough estimate of the performance of protocols. In addition, as mentioned in [6], [7], cross layer protocol interaction is more significant than previously suspected in determining protocol performance. Our goal here is to connect the structural analysis of ad hoc networks to network protocol performance. Our results show that graph theoretic measures, although useful, have to be necessarily coupled with network simulation to understand the problem in a realistic setting. See Section IV for additional details. A recent paper by Jardosh et al. [15] attempts to develop a model for generating structured distributions of the sort we describe here; our measurements provide a useful way of calibrating such models. The work presented here is also related to earlier work on geometric random graphs and percolation theory. Several authors have investigated the structural properties of geometric random graphs and percolation theory based results for ad hoc networks; see [11], [16], [17], [18], [21] and the references therein. All these papers present probabilistic results showing that a certain graph property is likely to be true for geometric random graphs with high probability beyond certain values of broadcast range. Similarly, in percolation theory and its application to ad hoc networks, researchers are interested in proving that the graph continues to have a desired property until a certain threshold for node/edge failures is reached. These results are not applicable to structured node distributions. Our experimental results show useful connections between graph theoretic measures of structured distributions and the robustness of the corresponding networks. See Section V for additional details. Organization. The remainder of the paper is organized as follows. Section II contains background information. Section III presents the variation of some standard graph structural measures for random and structured node distributions.
Section IV examines some graph measures that can be used to estimate certain network performance limits as well as network simulation results. Section V presents our results concerning the robustness of ad hoc networks under node and edge failures. Finally, Section VI concludes the paper. II. P RELIMINARIES A. Graph Theoretic Model and Definitions Our setting consists of n points in the plane, denoted by the set V . Each point represents a transceiver. Given a radius R, Du denotes the disk of radius R centered at u ∈ V. The (directed) interference graph G(V, E) induced by these points is the following: the points in V form the vertex set of G. Edge (u, v) is in E if v ∈ Du ; this is the disk graph model of ad hoc networks (see also [19]). The radius associated with a node denotes the region of influence where the transceiver’s radio signal can be received. Though the radius is a complex function of the power level of the transceiver, the disk graph model has been frequently used in several papers as a first approximation. A popular transmission range used by the research community is 250 meters (abbreviated 250m), under the assumption that every device operates at maximum power. We now define some standard graph theoretic terminology used in the paper. See [9] for more details. The degree δv of a vertex (node) v in graph G(V, E) is the number of edges incident on v. The neighborhood N (v) of a vertex v is the set of vertices connected by an edge to v. Let ξv = |{(w, w0 ) : w, w0 ∈ N (v)}| denote the number of edges that exist among the neighbors of v and let ξvmax = δv (δv − 1)/2 denote the maximum possible number of such edges. The clustering coefficient cv of a vertex v is defined as the ratio ξv /ξvmax . A (simple) path P from u to v is a sequence of edges e1 , . . . , ek , where ei and ei+1 have a common end point, u and v are end points of e1 and ek respectively, and no vertices are repeated in P ; the length of P is k, the number of edges in it. The distance d(u, v) between nodes u and v in G is the length of a shortest path between u and v. The diameter of G is given by max{d(u, v) : u, v ∈ V }. For sets A, B ⊆ V , the distance d(A, B) between A and B is defined as min{d(u, v) : u ∈ A, v ∈ B}. For any two edges e1 = (u1 , v1 ) and e2 = (u2 , v2 ), the distance d(e1 , e2 ) between them is defined as the minimum distance between any pair of their vertices; that is, d(e1 , e2 ) = min{d(u1 , u2 ), d(u1 , v2 ), d(v1 , u1 ), d(v1 , v2 )}. A subset M ⊆ E of the edges is said to be a distance-2 matching if for any e1 , e2 ∈ M , d(e1 , e2 ) ≥ 2. B. Distributions in an Urban Environment We considered two different spatial distributions of transceivers in our experiments. The first is an equilibrium state of the Random Waypoint (RW) mobility model [10], which is widely used by the mobile networking research community. Basically, upon reaching a destination, a mobile device will pause, and then choose a new destination within the simulation area and a new speed, and move in a straight
Fig. 1.
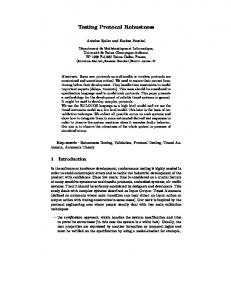
Simulated area of downtown Portland.
line. It yields a smooth density profile with a slight bulge in the middle [22]. To generate spatial distributions in an urban setting, we used the section of downtown Portland, OR, shown in Figure 1, measuring 2900m × 2950m. Spatial distributions of transceivers were obtained by running a realistic population mobility simulation program (TRANSIMS) developed at the Los Alamos National Laboratory [5], and taking a snapshot at one instant in time. It was assumed that each vehicle and pedestrian participates in the ad hoc network. The reason for doing this is twofold. First, it gives us a method for constructing non-uniform distributions in an urban setting. Second, the study can be naturally extended to ad hoc networks where the nodes are mobile instead of being stationary. For our experiments, the system has approximately 1520 vehicle transceivers along the roadway and 757 pedestrian transceivers in blocks between roads. To make a fair comparison between the two classes of spatial distributions, the grid size for the random distribution is fixed at 2900m × 2950m, and the number of nodes is kept the same in both classes of distributions. Note that the inclusion of walkers makes the realistic urban distribution much closer to the random one in topology and performance than only vehicles would, because walkers are more evenly distributed over the simulation area, while vehicles are constrained to the roads. For the remainder of the paper, we use the term random distribution (RD) to mean transceivers distributed in space using snapshots of locations produced by the random way point model. Similarly, we use the term structured distribution (SD) to mean that the transceivers are distributed in an urban environment as discussed above. We use the terms random ad hoc networks and structured ad hoc networks to mean ad hoc networks induced by random distributions and those induced by structured distributions respectively. III. S TRUCTURAL A NALYSIS In this paper, we focus on three structural measures of interference graphs. These are shortest path distribution, size of distance-2 matching, and balanced cuts. The first provides
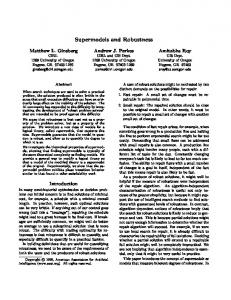
an indication of the number of hops needed for packets; the second provides an indication of the instantaneous capacity of the MAC layer, and the third has implications for the maximum amount of flow on the network. A thorough comparison of random and structured networks with respect to degree distributions and clustering coefficients can be found in [8]. An interesting result in [8] is that the two distributions have nearly the same mean degree, but the structured distribution has a much longer tail. A. Distribution of Shortest Path Distances The distribution of shortest path distances is likely to have a direct bearing on protocol performance. Figures 2(a) and (b) show how this varies with respect to model, radius and time. The hop count shown in Figure 2(a) is the number of traversed edges, which is determined by the topology of the network, which is in turn determined by the geometric distribution of the nodes. This explains why the patterns exhibited in Figure 2(a) also appear in Figure 2(b). B. Instantaneous Capacity of the MAC Layer In an ad hoc network, interference-free communication on a set of edges is possible only if the edges form a distance-2 matching, as defined in Section II-A. Balakrishnan et al. [4] show that this quantity can be used as a good approximation of the instantaneous MAC capacity of 802.11 type of protocols. For the spatial distributions considered in this paper, we study how the size of the distance-2 matching (computed by a greedy algorithm) varies with radius. (It is shown in [4] that the value computed by the greedy algorithm is within a constant factor of the optimal.) This variation (Figure 2(c)) shows an interesting behavior - up to a certain threshold, the matching size increases as radius increases and after this threshold, the matching size starts to decrease, as the interference among the edges increases. In practical terms, this means that maximum network capacity cannot be achieved by nodes increasing their power levels arbitrarily. C. Balanced Cuts Because network traffic has a flow like semantics, one quantity that has important implications to the amount of flow that can be sent is the cut size. This quantity is a dual of the flow [1]. The global minimum cut is not the right notion, however, because for many different power ranges, the graph might not even be connected, and the minimum cut would be 0 in that case. A better notion is that of balanced partitions. A balanced k-partition is a partition of the node set V of a graph G(V, E) into parts V1 , . . . , Vk so that |Vi | ≤ dn/ke, where n = |V |. The cost of such a k-partition is the number of edges with end points in different parts. A minimum balanced k-partition is one that minimizes this cost. A ρ-approximate balanced partition relaxes this requirement of every part being at most dn/ke to each |Vi | ≤ ρn/k, where ρ is a parameter. With respect to k-partitioning, the structured ad hoc networks and random ad hoc networks display very different behavior. This is due to the fact that random networks are
generated using a random distribution of points and such points are more uniformly spatially distributed. On the other hand, structured networks have nodes correlated to the existing urban infrastructure, and hence form a very non-uniform distribution of nodes in the geographic area. This structure leads to smaller cuts, compared to the random networks, as depicted in Figure 2(d). Computing a low cost balanced kpartition is a hard problem, but the METIS software [23] is known to work well in practice. Figure 2(d) shows how the cut size for 2-partition varies with increase in radius. The cutsize for random ad hoc networks is consistently larger, especially as the broadcast range increases. D. Spatial Variation in Structural Properties We also studied the spatial variation in structural properties. For this purpose, we take the whole city of Portland, and partition it into several parts, and consider the structured distribution restricted to those parts (as was done with the downtown part in Section II-B). We compare the degree, clustering coefficient and shortest path distributions, and the instantaneous MAC capacity (Figure 3). These results imply that the spatial distributions of these basic measures vary significantly. This fact needs to be considered carefully during protocol design and the protocol parameters need to be set accordingly. IV. P ROTOCOL P ERFORMANCE The previous section discussed how the two types of node distributions differ with respect to some standard graph theoretic measures. These differences provides a good indication of the fundamental trade-offs associated with with packet transport within each topology. In this section, we relate how those fundamental structural differences manifest themselves in the case of a wireless ad hoc network. We simulated some real protocols using the GloMoSim simulator [3] to study measures such as fairness, latency and the number of MAC and routing control packets, as the radius (power level) varies. The results show that there are trends in ad hoc network performance associated with the graph analysis measures, including the expected trade-off between the overheads due to MAC and routing layers. The same networks were used for simulation and structural analysis. The simulation setup is as follows: Network Topology: Snapshots from the structured (SD) and random (RD) distributions. Number of connections: 10 connections, < 15 hops between source and destination. Protocols: IEEE 802.11 DCF at the MAC layer and DSR at the routing layer. Traffic: 4,000 packets injected per connection over the simulation time. Packet size was 128 bytes, and injection rate 0.025 second. Simulated time was 100 seconds. Radio propagation model: (i) Propagation path-loss model: two ray, (ii) Channel bandwidth: 2 Mb, (iii) Channel frequency: 2.4 GHz, (iv) Topography: Line-of-sight, (v) Radio
Shortest Path Distribution r=150m
Geometric Distance Distribution t=28800 0.0007
SD t=25200 (7am) RD t=25200
0.16
SD t=28800 (8am) RD t=28800 (8am)
0.0006
0.14 0.0005 prob(distance)
prob(degree)
0.12 0.1 0.08 0.06
0.0004 0.0003 0.0002
0.04 0.0001
0.02 0
0 0
20
40
60
80
100
0
500
1000 1500 2000 2500 3000 3500 4000 4500
path (num hops)
240
distance (m)
Cut Size
instantaneous per channel capacity(RD) instantaneous per channel capacity(SD)
220
12000
200
RD SD
10000
180 8000 cut size
160 140 120
6000 4000
100 2000
80 60
0 60
80
100 120 140 160 180 200 220 240 260 radius
50
100
150
200 250 radius
300
350
400
Fig. 2. Interference Graph Analysis: (a) Shortest path distribution for a broadcast radius of 150m, (b) Geometric distance distribution at a fixed time, (c) Variation of Capacity with radius, (d) Variation of Cut size with radius for 2-partition by METIS.
clustering coefficient vs degree
degree distribution 5000 4500
part 1 part 2 part 3 part 4
0.8
part 1 part 2 part 3 part 4
4000 number of nodes
clustering coefficient
1
0.6 0.4 0.2
3500 3000 2500 2000 1500 1000 500
0
0 0
10
20
30
40
50
60
70
80
90
1
10
size of neighborhood
D-2 matching vs radius for different parts of the city
shortest path distribution 0.25
0.00035
0.00025
D-2 matching/number of nodes
part 1 part 2 part 3 part 4
0.0003 fraction of node pairs
100
size of neighborhood
0.0002 0.00015 0.0001 5e-05 0 0
10
20
30
40
50
60
70
80
90
path length
part 1 part 2 part 3 part 4
0.2 0.15 0.1 0.05 0 0
100
200
300 r (in m)
400
500
600
Fig. 3. Spatial variation of measures across different parts of Portland: (a) Clustering coefficient, (b) Degree distribution, (c) Shortest path distribution, (d) Instantaneous capacity.
type: Accnoise, (vi) Network protocol: IP, (vii) Connection type: UDP, (viii) In-band data and control, i.e., a single channel for both data and control packets. (ix) Transmission range chosen from [100, 800] meters. Simulator: GloMoSim 2.03. Simulation statistics: Five runs with independent simulation seeds for every combination of input parameters. Performance Measures: The following information was collected to measure the performance: (i) Average end to end delay (latency) for each packet as measured in seconds, (ii) Total number of packets received, (iii) Throughput in
bits/second, and (iv) Total number of control packets at the MAC and routing levels. Figure 4 shows the results of our simulation. Each panel shows the variation of the above performance measures with the transmission radius for the two models. The details regarding the measures are given below. For the computation of (long term) fairness q (Figure 4(a)) we use Jain’s Fairness Index [14]. Suppose xi is the number of data packets received by connection i and n is the of connections. The value Pnnumber ( x 0 )2 xi 0 i=1 i P and where q is then computed as n 0 2 , with xi = n
i=1
xi
x ¯i
x ¯i is the number of packets that should have been received
0.6 0.4 0.2 0
Average Packets Received Measure [%]
20
SD RD
Average Latency Measure [s]
Average Jain’s Fairness Measure
1 0.8
SD RD
18 16 14 12 10 8 6 4 2 0
100
200
300
400
500
600
700
800
100
200
300
Radius [m]
500
600
700
SD RD
80 60 40 20 0
800
100
200
300
Radius [m]
180000
Routing Control Packets
140000 120000 100000 80000 60000 40000
400
500
600
700
800
Radius [m]
10000
SD RD
160000 MAC Control Packets
400
100
SD RD
8000 6000 4000 2000
20000 0
0 100
200
300
400
500
600
700
800
Radius [m]
100
200
300
400
500
600
700
800
Radius [m]
Fig. 4. Results of Simulations: (a) The fairness measure, (b) The latency measure, (c) The average number of packets received (d) The number of control packets for MAC layer, and (e) The number of control packets for Routing layer. Note that larger radii drive both graphs toward a complete graph, explaining the convergence of behaviors.
according to user provided “fair” packet allocation. In all our computations, we have assumed that such a fair allocation would be an equal number of data packets received for each connection. This allocation arguably disregards different levels of contention that each connection is facing due to the position of respective source-sink pair but is easy to compute, especially for non-mobile networks. The value of q shows fairness of allocation on a h0.0, 1.0i scale, where 0.0 and 1.0 denote unfair and fair respectively. Average fairness measure is computed as the arithmetic mean over the independent simulation runs. Average latency (Figure 4(b)) and number of packets received (Figure 4(c)) are simply measured as the mean over the independent simulation runs. These two quantities were collected for each of the 10 connections and then averaged for each simulation run. The total number of MAC layer control packets for a node (Figure 4(d)) was computed as a sum of control packets sent out; for IEEE 802.11, this number is the sum of RTS, CTS and ACK packets. The total number of routing layer control packets for a node (Figure 4(e)) was computed as the total number of routing control packets sent out; for DSR, this number is the sum of RREQ, RREP and RERR packets. The total number of MAC (or routing layer) control packets for a simulation run was the total of the MAC layer packets (or the routing layer packets) over all nodes, respectively. The average number of either kind of control packets was computed as an arithmetic mean over the simulation runs. Subsequently, this average measure was adjusted to the number of connections and to the number of packets. Specifically, we divided the average number of control packets (for any of the two layers) by 10 to reflect the number of connections, and by 4 to obtain number of control packets per 1,000 data packets8 . This was
8 Note
that there are 4,000 data packets per connection.
done in order to make comparison easier9 . Figure 4(a) shows that for both random and structured node distributions, the value of fairness increases to 1 as the radius is increased. This is because as radius increases, the path lengths of the various connections become smaller and roughly equal. Thus, the number of packets in each of the paths tends to be the same. The decrease in path lengths with increasing radius is also the reason for the decreasing trend shown by average latency and the increasing trend shown by the average number of received packets (Figure 4(b) and (c) respectively). The number of MAC layer packets decreases with increasing radius (Figure 4(d)) since the number of times a packet needs to be forwarded to a neighbor decreases. On the other hand, the number of routing layer packets increases with increasing radius (Figure 4(e)). This is because as the graph becomes denser (i.e., as the node degrees increase), many nodes have short paths to the destination and all of them send RREP packets in response to an RREQ packet. V. N ETWORK ROBUSTNESS In the final analysis section, we study the robustness of the ad hoc networks to random edge and node failures. The basic experimental setup is as follows. In the node deletion experiment, we delete each node independently with a probability p. We then measure the structural properties of the modified network as a function of increasing p value. As before, we study: (i) average degree, (ii) average size of distance-2 matching and (ii) average diameter. Figure 5 shows the results for these quantities for random and structured distributions. We also studied two other classical quantities studied earlier in percolation theory: (i) the probability that the graph is 9 This adjustment ignores the fact that some control packets were used to negotiate transport for data packets that were later dropped. In general, the number of packets received and optimal path lengths for all packets should be considered to assess the performance accurately.
(1) The average degree of random distribution and structured distributions were quite close throughout the process of removing nodes. The distributions were set up so that the average degrees were close to begin with, but it was a bit surprising to see them so close as we removed nodes from the graphs.
the numbers can be off by a constant factor (approximately 4). (3) The average number of components and probability of graph being disconnected show clear differences between random and structured distributions. Random distributions are much more uniform and thus exhibit a greater level of robustness than structured distributions. Note that for particular instances, it is not a problem if one gets disconnected components, so far as the source sink pairs are in the same component and there are at least a few pathways between the source and destination. In fact, breaking the system into disconnected components can sometimes be useful, as is appears in Figure 6. The intuitive reason is that this reduces MAC layer interference. The performance of the protocols is a complicated combination of these factors. It also depends on the amount of traffic and the spatial distribution of the source sink pairs. (4) Simulations done in conjunction with graph theoretic analysis yield potentially interesting insights. The graph theoretic results suggest that one should expect performance degradation as nodes/edges are removed. But the precise point appears to be hard to predict. The main reason is that protocol performance is a function of multiple variables. Specifically, graph theoretic analysis shows that diameter of the system increases and the matching size decreases with increasing node failure, suggesting that the performance should steadily worsen. But, note that the graph theoretic parameters are properties of the entire network while simulations allow us to study these deletion effects on each connection. The results show that ad hoc networks as considered here are structurally very different compared to many other infrastructure networks that were shown to be scale-free networks. An important implication of this distinction as discussed in the literature has to do with robustness of such systems. Scale-free networks are quite robust to random failures but are sensitive to deliberate attacks. On the other hand, ad hoc networks formed by structured node distributions appear to be robust for both such attacks. Structured Distribution 20
Active Connections
(2) The average sizes of the distance-2 matching were also very close in the case of random and structured distributions throughout the node deletion process (Figure 5(d)). The result is a bit surprising at first. But the result can be explained at least intuitively as follows: to begin with, the size of the distance-2 matching for both distributions was close. Every time a node is deleted, the matching size can decrease by at most 1, since only one of the incident edges can be in the optimal matching. We thus see a steady decrease in the ratio of matching size by the number of nodes. Note also that the best value of this ratio can only be 0.5, since each matching edge consumes two nodes. The result shows that initially the ratio is roughly 0.15, meaning that the number of matched nodes is roughly 1/6 of the total number of nodes. The final value of the ratio is around 1/10. It should be noted that we are computing an approximately optimum matching and thus
200m 250m 300m
15
10
5
0 0.1
0.2
0.3
0.4 0.5 0.6 0.7 % Nodes Removed
0.8
0.9
Average Packets Received Measure [%]
disconnected after deleting nodes with probability p and (ii) the average number of components that the node deletions yield. To calculate these quantities, we ran each experiment with 1000 different random node deletions for a fixed value of p and took the average. Figures 5(a) and (c) show the results for this experiment for the node deletion process and Figure 5(b) shows the results for edge deletion. While the probability of getting disconnected under random deletions varies quite continuously in Figure 5(a), there seems to be a threshold like phenomenon in the case of random edge deletions. The experimental simulation setup that we used to argue about robustness of ad hoc networks is similar to setup in Section IV with the following differences. (i) We had 20 connections instead of 10 since this allowed us to better see the effect of network breaking into more than one connected component. (ii) We set the bandwidth to 11 Mb/s. (iii) We decreased the injection rate to 0.1 second thus injecting only 1,000 data packets over the 100-second simulation time; the data packet size was the same (128 bytes). (iv) There were 10 simulation runs instead of 5. (v) We used transmission radii of 200, 250, 300 meters. Nodes or edges were removed randomly and independently for each simulation run. Corresponding simulation results are shown in Figure 6. The experiments were set up with two basic goals: (i) to investigate how the performance of protocols deteriorates with increasing node/edge failures, and (ii) investigate this as a function of varying broadcast range. Intuitively one expects the following behavior. The overall network performance will degrade slowly until a certain threshold point, after which there would be a rapid drop in its performance. Our results appear to be the first of its kind where the structural theory of percolation is integrated with a simulator level study in the context of communication networks. The important observations and possible insights and explanations are summarized below.
Structured Distribution 100
200m 250m 300m
80 60 40 20 0 0.1
0.2
0.3
0.4 0.5 0.6 0.7 % Nodes Removed
0.8
0.9
Fig. 6. Variation in performance as nodes are deleted. (a) Average number of active connections (b) Average number of packets received.
VI. C ONCLUSIONS
AND
F UTURE D IRECTIONS
We analyzed the structural properties of ad hoc networks formed by random placements as well as those formed by placing nodes in an urban infrastructure. Our results show that first order understanding of the system can be obtained via
prob of getting disconnected
prob of getting disconnected
prob of getting disconnected vs edge deletion probability 1
RD SD
0.8 0.6 0.4 0.2
RD SD
0.8 0.6 0.4 0.2
0
average number of components vs node deletion probability average number of components
prob of getting disconnected vs node deletion probability 1
0 0
0.1 0.2 0.3 0.4 0.5 0.6 0.7 0.8 0.9 node deletion probability
1
0.08 0.06
0.3
0.4
0.5
0.6
0.7
0.8
0.9
1
0.1
0.2
0.3 0.4 0.5 0.6 0.7 node deletion probability
0.8
0.9
1
average diameter vs edge deletion probability RD SD
30 28
23 22 21 20
26 24 22 20 18
18 0.2
5
32
19
0.04
10
0
avg diameter
avg diameter
0.1
15
1
RD SD
24
0.12
20
average diameter vs node deletion probability
0.14
0.02 0.1
0.1 0.2 0.3 0.4 0.5 0.6 0.7 0.8 0.9 edge deletion probability
25
RD SD
0.16
RD SD
25
0 0
average instantaneous capacity/number of nodes vs p 0.18
30
16 0
0.1
0.2
0.3
0.4
p
0.5 p
0.6
0.7
0.8
0.9
1
0
0.1
0.2
0.3
0.4
0.5 p
0.6
0.7
0.8
0.9
1
Fig. 5. (a),(b) Probability of the graph becoming disconnected under random node and edge deletions, vs node/edge deletion probability (p). (c) Average number of components in the case of random node deletions, vs node/edge deletion probability. (d) Average instantaneous capacity (size of distance-2 matching/number of nodes) vs node deletion probability. (e),(f) Variation of average diameter under node and edge deletions vs node/edge deletion probability.
graph theoretic analysis; the results also point out the need for simulations to better understand the overall performance of the induced communication network. Our end-to-end analysis on network robustness is new and demonstrates the usefulness of structural analysis combined with simulations. The current analysis does not take into account occlusions; a subsequent study will take this important parameter into consideration. Nevertheless, the process of edge deletion is a first step in understanding such effects. Another direction for future work includes study of mobile nodes in an urban environment and allowing non-uniform broadcast ranges for the nodes. R EFERENCES [1] R. Ahuja, T. Magnanti and J. Orlin. Network Flows: Theory, Algorithms and Applications, Prentice-Hall, Englewood Cliffs, NJ, 1993. [2] R. Albert and A. Barab´asi, Statistical Mechanics of Complex Networks, Rev. Mod. Phys. 74, 47-97 (2002). [3] L. Bajaj, M. Takai, R. Ahuja, K. Tang, R. Bagrodia, and M. Gerla. GloMoSim: A Scalable Network Simulation Environment. UCLA Computer Science Department Technical Report 99-0027, May 1999. [4] H. Balakrishnan, C. Barrett, V. S. Anil Kumar, M. Marathe, S. Thite, The distance-2 matching problem and its relationship to the MAClayer capacity of ad hoc networks. IEEE Journal on Selected Areas in Communication, 22(6), pp 1069-1079, 2004. [5] C. Barrett, et al. TRANSIMS (TRansportation ANalysis SIMulation System) 3.0 LA-UR-00-1724, 1725, 1755, 1766, and 1767. Los Alamos National Laboratory, 2000. (URL: http://transims.tsasa.lanl.gov.) [6] C. Barrett, M. Drozda, A. Marathe, and M. Marathe, Characterizing the Interaction Between Routing and MAC Protocols in Ad-Hoc Networks, Proceedings of the Third ACM International Symposium on Mobile Ad Hoc Networking and Computing (MOBIHOC 2002) Lausanne, Switzerland, June 2002. [7] C. Barrett, M. Drozda, A. Marathe and M. Marathe. Analyzing Interaction Between Network Protocols, Topology and Traffic in Wireless Radio Networks. Proc. IEEE Wireless Communications and Networking Conference (WCNC’03), New Orleans, Louisiana, IEEE Press, 2003. [8] C. L. Barrett, M. V. Marathe, S. S. Ravi, and J. P. Smith. A Mobility and Traffic Generation Framework for Modeling and Simulating Ad Hoc Communication Networks. Proceedings of the 2002 ACM Symposium on Applied Computing, Madrid, Spain, 2002. (Complete version appears in Scientific Programming, Vol. 12, No. 1, 2004, pp. 1–23.)
[9] B. Bollobas, Modern Graph Theory, Springer-Verlag, New York, NY, 1998. [10] J. Broch, D. Maltz, D. Johnson, Y. Hu, and J. Jetcheva. Performance Comparison of Multi-Hop Wireless Ad Hoc Network Routing Protocols. Proc. 4th Annual ACM/IEEE International Conference on Mobile Computing and Networking, ACM, Dallas, TX, Oct. 1998. [11] J. Dall, M. Christensen, Random Geometric Graphs. Phys. Rev. E Vol. 66, 016121 (2002). [12] S. Eubank, V.S. Anil Kumar, M. Marathe, A. Srinivasan and N. Wang. Structure of Social Contact Networks, and their impact on Epidemics. LANL Technical Report LA-UR-04-6778. To appear in the ACMDIMACS Special Issue on Epidemiology, 2005. [13] K. Jain, J. Padhye, V. Padmanabhan, L. Qui, Impact of Interference on Multi-hop Wireless Network Performance. Proc. Ninth International Conference on Mobile Computing and Networking (MOBICOM 2003), San Diego, CA, Sep. 2003, pp. 66-80. [14] R. Jain, The Art of Computer Systems Performance Analysis: Techniques for Experimental Design, Measurement, Simulation and Modeling, John Wiley & Sons, New York, NY, 1991. [15] A. Jardosh, E. Belding-Royer, K. Almeroth, S. Suri, Towards realistic mobility models for mobile ad hoc networks. Proc. of the Ninth Annual International Conference on Mobile Computing and Networking (MOBICOM), pp 217-229, 2003. [16] X. Li, P. Wan, Y. Wang, C. Yi, Fault Tolerant Deployment and Topology Control in Wireless Networks, Proc. 4th ACM International Symposium on Mobile Ad Hoc Networking and Computing (MobiHoc’03), pp. 117128, 2003. [17] R. Meester and R. Roy, Continuum Percolation, Cambridge University Press, 1996. [18] M. Penrose, On k-connectivity for a Random Geometric Graph, Random Structures and Algorithms, 15, pp. 145-164, 1999. [19] T. Rappaport, Wireless Communication: Principles and Practice, Prentice-Hall, Upper Saddle River, NJ, 2001. [20] E. Royer, S. Lee and C. Perkins. The Effects of MAC Protocols on Ad hoc Network Communications. Proc. IEEE Wireless Communications and Networking Conference, Chicago, IL, September 2000. [21] S. Shakkotai, R. Srikant and N. Shroff, Unreliable Sensor Grids: Coverage, Connectivity and Diameter. Proc. IEEE INFOCOM, April 2003. [22] J. Yoon, M. Liu, B Noble, Sound Mobility Models. Proc. Ninth International Conference on Mobile Computing and Networking (MOBICOM 2003), San Diego, CA, Sep. 2003, pp. 205-216. [23] http://www-users.cs.umn.edu/∼karypis/metis/