The typical acoustic signature of a sonic boom is the ... teristics of boom pressure signatures underwater, are scarce. ..... In practical terms this resulted in excel- ..... 16 B. J. Sotirin and J. A. Hildebrand, ''Large aperture digital acoustic array,''.
Field measurements of sonic boom penetration into the ocean R. A. Sohn Woods Hole Oceanographic Institution, Woods Hole, Massachusetts 02543
F. Vernon, J. A. Hildebrand, and S. C. Webb Scripps Institution of Oceanography, La Jolla, California 92093-0205
共Received 21 October 1999; accepted for publication 3 March 2000兲 Six sonic booms, generated by F-4 aircraft under steady flight at a range of altitudes 共610–6100 m兲 and Mach numbers 共1.07–1.26兲, were measured just above the air/sea interface, and at five depths in the water column. The measurements were made with a vertical hydrophone array suspended from a small spar buoy at the sea surface, and telemetered to a nearby research vessel. The sonic boom pressure amplitude decays exponentially with depth, and the signal fades into the ambient noise field by 30–50 m, depending on the strength of the boom at the sea surface. Low-frequency components of the boom waveform penetrate significantly deeper than high frequencies. Frequencies greater than 20 Hz are difficult to observe at depths greater than about 10 m. Underwater sonic boom pressure measurements exhibit excellent agreement with predictions from analytical theory, despite the assumption of a flat air/sea interface. Significant scattering of the sonic boom signal by the rough ocean surface is not detected. Real ocean conditions appear to exert a negligible effect on the penetration of sonic booms into the ocean unless steady vehicle speeds exceed Mach 3, when the boom incidence angle is sufficient to cause scattering on realistic open ocean surfaces. © 2000 Acoustical Society of America. 关S0001-4966共00兲03106-4兴 PACS numbers: 43.28.Mw, 43.30.Nb, 43.30.Hw 关DLB兴
INTRODUCTION
Objects traveling faster than the speed of sound generate shock waves that result in impulsive acoustic signatures known as sonic booms. The typical acoustic signature of a sonic boom is the ‘‘N-wave’’ 关Fig. 1共a兲兴, which is characterized by sharp pressure jumps at the front and back of the waveform, with a slow pressure drop in between. It has been recognized from the early days of supersonic flight that sonic booms generate undesirable environmental impacts over populated areas,1 primarily because of startle response to the shock wave pressure rise, and low-frequency building response 共i.e., vibration, rattle兲. The undesirable acoustic qualities of sonic booms led to legislation in the U.S. 共and most countries internationally兲 forbidding supersonic flight and the generation of sonic booms over land, except in designated military corridors. As a result, most sonic booms are currently generated over the ocean. Sources of sonic booms over water include the Concorde, which flies routinely between Paris and New York, and rocket launches associated with satellite deployments. The restriction of supersonic flight to air spaces over water has refocused sonic boom environmental impact research to the marine habitat, and to marine mammals, in particular. While the characteristics of sonic booms in air are well understood and supported by a vast body of research 共e.g., Carlson and Maglieri,2 Darden3兲, data constraining the penetration of sonic booms into the ocean, and the characteristics of boom pressure signatures underwater, are scarce. The original theory for the propagation of sonic booms across the air/sea interface was developed by Sawyers,4 and by Cook.5 For level flight, booms generated by objects traveling at speeds less than that of sound in water 共1500 m/s, or Mach ⬃4.4兲 create an evanescent wavefield in the water 3073
J. Acoust. Soc. Am. 107 (6), June 2000
column, decaying exponentially with depth. The decay is wavelength dependent, with short wavelengths 共high frequencies兲 attenuating faster than long wavelengths 共low frequencies兲. The Sawyers and Cook theories were validated with laboratory experiments involving spherical blasts6 and small, high-speed projectiles.7 Early attempts to validate the theory with field experiments, however, were unsuccessful. Young8 and Urick9 attempted to quantify the penetration of sonic booms in the ocean 共in separate experiments兲 by measuring boom pressure signatures immediately above, and at several depths below, the air/sea interface. Underwater sonic boom pressure measurements from these experiments exhibit different decay rates with respect to depth, and neither matches the analytical theory or laboratory data. Urick’s results deviated enough to cause him to question the validity of the evanescent wave theory for sonic booms in water. Disagreement between the field data and the analytical theory introduced some uncertainty regarding the validity of the theory and its underlying assumptions in real world as opposed to laboratory conditions. In particular, the theories of Sawyers4 and Cook5 both assume a perfectly flat ocean surface, but the ocean surface is continually perturbed by ocean waves. The possible effects of a realistic ocean roughness on the penetration of booms into the water was recently investigated using numerical methods by Rochat and Sparrow,10 and Cheng and Lee,11 with each arriving at different conclusions. Rochat and Sparrow concluded that roughness has a negligible effect, with underwater pressure level variations from a flat interface of 1 decibel or less. In contrast, Cheng and Lee concluded that the sea surface roughness exerts a first-order effect on boom penetration, particularly at large depths and low frequencies. At issue is the magnitude of the scattered component of sonic boom
0001-4966/2000/107(6)/3073/11/$17.00
© 2000 Acoustical Society of America
3073
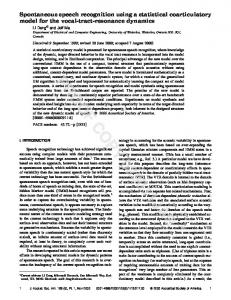
FIG. 2. Sonic boom measured by Urick 共Ref. 7兲 in the air and in the water at a depth of ⬃15 m. The effective pass-band of these measurements is 75–150 Hz.
FIG. 1. Characteristics of a typical ‘‘N-wave’’ sonic boom measured on the ground. 共a兲 Simple N-wave time series. The straight-line approximation is parameterized by a ‘‘rise time’’ 共t兲 which is the time from the onset of the boom to maximum pressure, and the total duration 共D兲 of the waveform. Rise times typically range from 2–20 ms, and durations are typically 100– 400 ms. 共b兲 Theoretical energy spectrum of an N-wave boom with a rise time of 8 ms and a duration of 350 ms.
energy in the water column, and its proportion to the evanescent signal. The lack of consistency between the numerical studies,10,11 and disagreement between the analytic theory4,5 with the field experiments,8,9 underscores the need for reliable measurements of sonic booms underwater to serve as a benchmark for the validation of theoretical models, and to provide a foundation for environmental impact assessments. The early data of Young and Urick suffer from the technologic limitations of their day. Specifically, the data acquisition systems employed in the experiments did not have adequate low-frequency response, and the pressure measurements are likely contaminated by the interaction of the sonic boom with the mechanical systems used to suspend the hydrophones in the water column. A sonic boom measured by Urick9 is shown in Fig. 2. The pressure signatures bear little resemblance to an N-wave, primarily because the measurement system lacked the low-frequency response to measure 3074
J. Acoust. Soc. Am., Vol. 107, No. 6, June 2000
the slow pressure decay between the fore and aft shocks. In addition, the ringing observed in the water column measurement indicates that the data are contaminated by mechanical interactions with the suspension system. Instrumentation has improved dramatically since the experiments of Young and Urick, and modern systems are capable of making high-fidelity measurements of sonic booms underwater. For example, a Concorde boom was serendipitously recorded in 1996 by a hydrophone array off Nova Scotia,12 and the underwater boom waveform contains the low-frequency components missing in the Young and Urick measurements. However, correlation of this measurement with theoretical results is difficult because the boom waveform was not measured in air, and because the underwater waveform is curiously complicated by ringing that may have resulted from the excitation of a low-frequency seismic mode in the shallow seabed. In this paper we present the results of a field study that provides the first simultaneous, high-fidelity measurements of sonic booms in the air and ocean. We take advantage of modern instrumentation systems to extend the frequency range of the measurements down to a few Hz, and use data telemetry from a small spar buoy to avoid contaminating the incoming sonic boom as it crosses the air/sea interface. We measured six sonic booms at five depths in the water 共down to 112 m兲, and just above the air/sea interface. We find that the pressure signatures we measured are in excellent agreement with the analytical theory of Cook5 共as implemented by Sparrow and Ferguson13兲 down to ⬃40–50 m, where the signal is lost in the ambient field.
FIELD PROGRAM
The field experiment was conducted on May 11–12, 1999 in the East Cortez Basin 共32.2 °N, 118.7 °W兲, approximately 140 km W-SW of San Diego, CA. The location provided deep water 共1600 m兲 within a military air space. SurSohn et al.: Sonic boom penetration into the ocean
3074
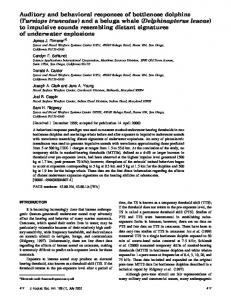
FIG. 3. Schematic illustration of instrumentation employed in this experiment. Details of the near surface package and the suspension system are shown in inset.
face support for the experiment was provided by the R/V NEW HORIZON. Flight support was provided by the Naval Air Station at Pt. Mugu, CA. During the course of the experiment, the sea-state and weather were essentially constant. The NOAA environmental buoy near Catalina Island 共33.75 °N, 119.08 °W兲 reported a significant wave height and period of 1.2 m and 8 s, respectively, an air temperature of 14 °C, and an average wind speed of 2 m/s. Wind and swell estimates made on station aboard the R/V NEW HORIZON were somewhat greater, with prevailing winds of 4.5–9 m/s 共10–20 kts兲 and a swell of 2–3 m at a predominant period of 8–10 s. The conditions during the experiment fall into the Beaufort Force 4–5 category. Wind and waves generally grew during the day. By afternoon scattered white caps were present, but breaking waves were not observed. Instrumentation
The instrument package consisted of a 115-m vertical hydrophone array suspended from a small spar buoy 共6.5-m tall, 0.4-m diameter兲 at the sea surface 共Fig. 3兲. The vertical array contained nine hydrophone elements 共Benthos/ Aquadyne AQ-1 cartridges兲, with one phone mounted in air on top of the buoy 共⬃2 m above the water兲, and eight phones at 15-m intervals in the water column. The shallowest and deepest phones were located at 7 and 112 m depth, respectively. The hydrophones’ signals were sampled at 500 Hz and analog bandpass filtered. The in-air hydrophone provided a flat response from 1–60 Hz, a 10-dB/decade roll-off between 60 and 150 Hz, and a ⬃50 dB/decade roll-off above 150 Hz. The water hydrophones had a flat response from 3–200 Hz, with a steep roll-off 共⬃70 dB/decade兲 above 200 Hz. Annular vibration isolators with a nominal resonant frequency of ⬃1 Hz were utilized to decouple the vibration of the suspension line from the hydrophone elements 共see Fig. 3, inset兲. A 20-kg weight was attached to the bottom of the hydrophone array with a length of shock cord to maintain a 3075
J. Acoust. Soc. Am., Vol. 107, No. 6, June 2000
vertical profile in the water column, and to move the resonant frequency of the suspension system 共⬃0.1 Hz兲 outside the frequency range of the measurements. A GPS receiver was mounted on top of the buoy to provide position updates once a minute, with a nominal error of 100 m. The hydrophone data were digitized at the buoy, and then telemetered in real-time to a receiving station aboard the R/V NEW HORIZON. A buoy telemetry system was employed to avoid contaminating the sonic boom as it crossed the air/ sea interface. During the supersonic passes the R/V NEW HORIZON stood off several kilometers from the buoy with the engines idling and the propellers de-clutched. The bandwidth of the telemetry system permitted the digitization of six data channels 共out of nine hydrophone stations兲 at a 500-Hz sample rate. Different channel configurations were employed for the first and second day of the experiment 共see Results, below兲. Measurements of the in-air sonic booms generated during the experiment were also made by personnel from NASA Dryden using the SABER system.14 These measurements are not reported here, but provided redundancy should the in-air sensor on the data buoy have failed. The SABER measurements 共with a sampling rate of 10 kHz兲 were also used to examine the high-frequency characteristics of the booms entering the water column.
Flight plan
Six supersonic passes were made with U.S. Navy F-4 aircraft over the two days of the experiment. The overflight altitude was varied from 610–6100 m 共2000–20 000 ft兲 to provide a range of boom pressures 共96–530 Pa, or 2–11 psf兲 at the air/sea interface. Aircraft speeds ranged from Mach 1.07–1.26, corresponding to the aircraft’s best speed at each altitude. After transiting from Pt. Mugu to the experimental site, the aircraft established radio contact with the R/V NEW HORIZON and were given an updated target position. Once a Sohn et al.: Sonic boom penetration into the ocean
3075
FIG. 4. Pressure measurements and theoretical predictions from Pass 1, Mach 1.07 at 610-m altitude. Time series 共left side兲 and amplitude spectra 共right side兲 are shown for each measurement. Sensor depth is shown on the far left side. For time series plots, data are shown as a solid line and theoretical predictions 共based on in-air measurement at top兲 are shown as a dashed line. For spectral plots, boom amplitude spectra are shown as a solid line and ambient noise spectra are shown as a dashed line. Note that the pressure scale 共y-axis兲 used for the time series plots varies with depth.
supersonic run was underway, the test pilots noted the speed, altitude, and heading of the aircraft, along with a single position 共latitude/longitude兲 at the beginning of the run. The aircraft position and magnetic heading 共accurate to within 3 deg兲 at the beginning of the run were used to estimate a flight track for each supersonic pass. Since the aircraft did not have GPS data loggers, it is impossible to know the exact lateral distance between the flight track and the data buoy. Based on straight-line flight track estimates, all of the tracks pass over the buoy within the tolerance of the estimates, except for one 共Pass 2兲. The straight-line estimate for Pass 2 runs ⬃1 km west of the buoy. This is significant given that the horizontal error is only slightly less than the aircraft altitude 共1.5 km兲. However, no aircraft had an automatic heading-hold system, and 3076
J. Acoust. Soc. Am., Vol. 107, No. 6, June 2000
therefore the actual flight tracks 共for all the supersonic runs兲 may have varied from the straight-line estimates. Results
Time series and spectral plots of each sonic boom measured during the experiment 共Pass 1–6兲 are shown in Figs. 4–9. Data from six hydrophones were recorded during each run. Measurements made during the first day of the experiment 共Pass 3, 5, 6; Figs. 6, 8, 9兲 recorded hydrophone data in-air, and at 7, 22, 37, 82, and 112 m beneath the sea surface. Measurements made during the second day of the experiment 共Pass 1, 2, 4; Figs. 4, 5, 7兲 recorded data in-air, and at 7, 22, 37, 52, and 67 m beneath the sea surface. The shift toward shallower depths on the second day was made after it Sohn et al.: Sonic boom penetration into the ocean
3076
FIG. 5. Pressure measurements and theoretical predictions from Pass 2, Mach 1.15 at 1525-m altitude. Plots as in Fig. 4.
was realized that the booms were failing to generate detectable signals near the bottom of the hydrophone array. The time series data for the in-water measurements are compared with the linear, analytical theory of Sparrow and Ferguson,13 which is based on the work of Cook.5 The method assumes a flat air/sea interface, and no interaction with the seafloor 共deep water兲, but allows for arbitrary boom wave shapes. To generate the theoretical pressure signatures in the water column, the spectrum of the in-air pressure signature was calculated, weighted by an exponential decay with respect to wavelength and depth, and then transformed back into the time domain. A Blackman window was applied to the in-air data segment before calculating the fast Fourier transform 共FFT兲 to reduce Gibbs phenomenon associated with truncating an infinite series. The theoretical waveforms shown in Figs. 4–9 were bandpass filtered 共3–200 Hz兲 to mimic the analog circuitry of the in-water hydrophones. This 3077
J. Acoust. Soc. Am., Vol. 107, No. 6, June 2000
filtering slightly distorts the theoretical wave shapes, but is required to provide an equal comparison to the measurements. The amplitude spectrum of the boom waveform and the ambient noise field at each hydrophone channel are shown on the right side of Figs. 4–9. The amplitude spectrum of the ambient noise field represents the FFT of a randomly selected segment of data immediately preceding the boom arrival. A Gaussian window was applied to both the boom pressure signature and the ambient noise segment prior to estimation of the amplitude spectrum. Discussion
The primary experimental objective of this work was to make high-fidelity measurements of sonic booms at the air/ sea interface and at several depths in the water column. We Sohn et al.: Sonic boom penetration into the ocean
3077
FIG. 6. Pressure measurements and theoretical predictions from Pass 3, Mach 1.17 at 2135-m altitude. Plots as in Fig. 4.
begin the discussion by assessing the extent to which this objective was met. We then compare our measurements to theoretical predictions, and discuss the implications of the similarities/differences for the validation of the theory under real ocean conditions. We conclude with a brief review of some remaining issues and unanswered questions regarding the penetration of sonic booms into the ocean. Fidelity of sonic boom pressure measurements
We begin by examining the fidelity of the in-air measurement, which is important considering that it is used as a source function for the theoretical predictions of boom pressures underwater. All of the in-air pressure signatures in this experiment are characterized by fairly simple N-waves, and the amplitude spectra of the in-air signals have the expected shape, with two separate corner frequencies corresponding to 3078
J. Acoust. Soc. Am., Vol. 107, No. 6, June 2000
the boom duration and rise time 关compare top right panels of Figs. 4–9 with Fig. 1共b兲兴. The low-pass filter applied to the in-air pressure data 共60 Hz corner frequency兲 removes any contributions from reflected phases at the microphone. It appears that our in-air measurements adequately characterize the sonic boom impinging the air/sea interface above the vertical hydrophone array, especially at low frequencies, which are of primary importance to this study. Several of the supersonic passes made during the experiment were at fairly low altitudes, and under these conditions individual shocks from the various aerodynamic features 共e.g., nose, wings, cockpit兲 would not be expected to have coalesced into single bow and tail shocks 共e.g., Hayes15兲. Uncoalesced shocks create extra spikes in the acoustic signature. These extra spikes generate relatively high-frequency pressure perturbations that are removed by the low-pass filters, and in these cases we expect that the simple N-waves Sohn et al.: Sonic boom penetration into the ocean
3078
FIG. 7. Pressure measurements and theoretical predictions from Pass 4, Mach 1.13 at 2865-m altitude. Plots as in Fig. 4.
rendered by the in-air sensor do not perfectly represent the actual booms at the sea surface. Indeed, the SABER measurements made aboard the R/V NEW HORIZON for the lowaltitude passes contain spikes embedded in the N-wave signature 共although these measurements also contain spikes from reflections off the ship’s superstructure兲. It will be seen in the following section that the failure to capture highfrequency spikes in the in-air measurement is not a significant shortcoming since these features are almost immediately removed from the evanescent wavefield beneath the sea surface. The principle concern for the underwater boom measurements is to keep noise levels on the individual sensors as close to ambient as possible. Achieving low noise levels on a hydrophone array suspended at shallow depths is difficult because the hydrophones are mechanically linked to the mo3079
J. Acoust. Soc. Am., Vol. 107, No. 6, June 2000
tion of the surface wavefield. The suspension system decouples the hydrophones from the jerking of the array by motions of the buoy and from strum 共e.g., Sotirin and Hildebrand16兲 induced by current flowing past the array. Inspection of the ambient noise pressure spectra in Figs. 4–9 indicates that our attempts to minimize noise levels on the hydrophone array using vibration isolators and shock cord 共Fig. 3兲 were fairly successful. The pressure variance of the ambient field on individual hydrophone elements was typically less than 100 Pa2 in the relevant band from 3–200 Hz. This corresponds to a dynamic head of less than 1 mm of water, root-mean-square 共rms兲. Ambient noise pressure variance on the deepest phones is especially small, with typical values of 2–5 Pa2. In practical terms this resulted in excellent signal-to-noise levels for boom measurements down to about 40–50-m depth. At this depth the amplitude of the Sohn et al.: Sonic boom penetration into the ocean
3079
FIG. 8. Pressure measurements and theoretical predictions from Pass 5, Mach 1.21 at 4570-m altitude. Plots as in Fig. 4.
boom pressure signal is equal to or less than the ambient levels on the hydrophone array. Additionally, the underwater boom signatures do not contain any ringing as do those measured by Urick9 or Desharnais and Chapman.12 Nor does the acoustic field contain any measurable perturbation from the surface buoy. This demonstrates that by using a small diameter spar buoy as a surface mooring for the data acquisition system we avoided contaminating the boom waveform with mechanical coupling down the suspension line. By conducting the experiment in deep water, we also appear to have avoided interaction with the seabed. We conclude that the pressure measurements made during the course of this experiment provide accurate renderings of the sonic boom wavefields generated at the instrument array, especially at low frequencies. 3080
J. Acoust. Soc. Am., Vol. 107, No. 6, June 2000
Agreement between data and theory
The agreement between our data and the analytical method of Sparrow and Ferguson,13 which is based on the theory of Cook,5 can be observed by comparing the solid and dashed lines in the time series plots of Figs. 4–9. Data and theory are in agreement at all depths and for all booms within the limitations of the signal-to-noise ratio. The signal is above the noise to depths of 37 m for all booms, and to greater depths for lower altitude flights with stronger booms. Examination of spectral attenuation provides additional insight into the agreement between our data and linear theory. The evanescent decay of a sonic boom underwater4,5 scales as e ⫺k 0 z , where k 0 is the wavelength in air divided by Mach number, z is depth, and ⫽ 冑1⫺M 2 /W 2 , where M is Mach number and W is the ratio of sound speed in air to Sohn et al.: Sonic boom penetration into the ocean
3080
FIG. 9. Pressure measurements and theoretical predictions from Pass 6, Mach 1.26 at 6100-m altitude. Plots as in Fig. 4.
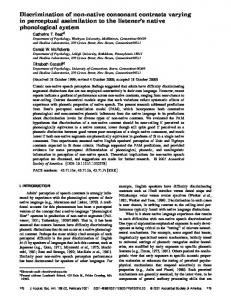
water. The correlation between this theoretical expression and our Pass 1 measurements 共strongest boom兲 is shown in Fig. 10. The data follow the theoretical decay curves until they approach the noise floor, at which point ambient noise overwhelms the signal. The agreement between the predicted waveform and the signal measured at the deeper hydrophones precludes the existence of a scattered component of the sonic boom signal propagating as an acoustic wave in the water with an amplitude greater than 4 Pa peak to peak. The largest sonic boom measured in air had a peak-to-peak amplitude of 800 Pa, demonstrating that the scattered component in the water was no more than 0.5% of the incident boom amplitude. In order for an airborne acoustic wave to enter the ocean it must have a grazing angle of at least 77° 共from the horizontal兲. The grazing angles of booms generated during this experiment 共i.e., Mach cone angle兲 range from ⬃20–30°. 3081
J. Acoust. Soc. Am., Vol. 107, No. 6, June 2000
This means that, in the high-frequency approximation, ocean waves had to be 50–60° steep to generate a meaningful scattered component and cause significant deviations from a flat interface assumption. However, waves in the open ocean break if their steepness exceeds ⬃8° 共Stokes17兲. Indeed, observations of wave steepness in the open ocean from a variety of sea states give values of 0.5–6° 共Khandekar18兲. Given the low supersonic speeds, and hence low grazing angles of the booms generated during our experiment, our failure to measure a significant scattered component of the boom signal underwater is not surprising. Indeed, we only expect a significant scattered component if the boom incidence angle is within a few degrees of 77, or just below the angle required for acoustic transmission. If we allow for a maximum wave steepness of 6°, then we expect a detectable scattered component at incidence angles of 71°, corresponding to a vehicle speed of Mach ⬃3. Sohn et al.: Sonic boom penetration into the ocean
3081
FIG. 10. Evanescent attenuation of sonic booms underwater. Pressure data from the top three hydrophones from Pass 1 共Fig. 4兲 are compared with linear theory 共Refs. 4 and 5兲. Mean spectral noise levels at 22-m depth are shown for comparison. Attenuation is referenced to the spectral levels of the in-air measurement, such that the noise floor would move up on this plot for the smaller booms of Passes 2–6.
Thus the scattered boom signal is expected to be negligible until vehicle speeds reach Mach ⬃3. At Mach ⬃3 very rough sea states have the potential to scatter significant amounts of boom energy into the water column. Between Mach 3 and Mach 4.4 the magnitude of the scattered signal will increase with vehicle speed and sea state. Above Mach 4.4 standard acoustic transmission theory applies.
Remaining issues
The results of this experiment demonstrate that the penetration of sonic booms into deep water from level aircraft flight at velocities significantly less than 1500 m/s 共Mach ⬃4.4, the speed of sound in water兲 can be accurately predicted with analytical theory. We found that the presence of a ‘‘real’’ surface wavefield at the air/sea interface did not cause any observable differences between the data and the theory. Thus there is now uniform agreement between the original theories of Sawyers4 and Cook,5 laboratory tests,6,7 the numerical method of Rochat and Sparrow,10 and the field results of our experiment. As a result we consider the firstorder physics of the penetration of sonic booms across the air/sea interface to be well understood and validated. There are three special cases of sonic boom penetration into the ocean that were not addressed in this experiment: penetration into shallow water, penetration from booms propagating at speeds greater than Mach ⬃3, and penetration from booms generated during unsteady flight 共maneuvers兲. Penetration of booms into shallow water is a phenomenon that will almost certainly require experimental data owing to the difficulties associated with incorporating a realistic seafloor into numerical computations.19 In addition, a single experiment may not suffice in this regard since the shallowwater problem may be site-specific owing to the diversity of seabed compositions found offshore the United States 共and globally兲. For example, the continental margins of the eastern U.S. have a different composition, and hence different 3082
J. Acoust. Soc. Am., Vol. 107, No. 6, June 2000
geoacoustic characteristics, than the continental slope of the western coast. As discussed above, significant amounts of scattered energy from booms are expected if vehicle speeds exceed Mach 3, and if they exceed Mach 4.4 then sonic boom penetration into the water is governed by standard plane wave transmission theory. These high speed scenarios are associated with much more efficient boom penetration into the water, and may generate underwater pressure levels substantially larger than those measured in this experiment. However, few vehicles in existence today travel faster than Mach 3, and those that do tend to do so at very high altitudes 共e.g., space shuttle reentries兲. Consequently, these types of booms are both rare and of low amplitude. Therefore, it is not clear whether or not this particular scenario warrants a concerted experimental program. Flight maneuvers have the potential to modify the penetration of sonic booms into the ocean by changing the angle of incidence of the booms at the air/sea interface. In this case maneuvers are broadly interpreted to include any unsteady flight operations, including climb, descent, and acceleration. We are concerned not so much with classic focusing effects,20 but rather with phase matching of the acoustic signal at the air/sea interface. Under the proper conditions, an object traveling at relatively low supersonic speeds 共a 29° dive at Mach 1.5, for example兲 can generate a boom pressure field that phase matches along the horizontal air/sea interface. This is physically equivalent to the conditions resulting from steady flight at speeds greater than Mach 4.4 as described in the previous paragraph. A survey of the potential for routine rocket launches and aircraft operations to maneuver and generate phase-matched booms over the ocean is beyond the scope of this work. However, if the flight track parameters for a given mission are known, the phase velocity of the boom pressure field at the air/sea interface can be Sohn et al.: Sonic boom penetration into the ocean
3082
easily checked. A field experiment to measure the penetration of phase-matched booms from maneuvering objects would be significantly more complicated than that conducted in this work, but might be warranted, for example, if routine rocket launches generate phase-matched booms. CONCLUSIONS
We measured six sonic booms from Navy F-4 aircraft under steady flight with sensors located just above the air/sea interface and at five depths in the upper 115 m of the water column. Boom pressures exhibit a frequency-dependent decay with depth, with low frequencies penetrating significantly farther than high frequencies. All of the boom pressure signals measured in this experiment decay to ambient levels in all frequency bands by 40–50 m. Boom waveforms measured at individual depths in the water column exhibit excellent agreement with analytical theory that assumes a flat air/sea interface. At supersonic speeds significantly less than Mach 3, we conclude that the ocean wavefield does not significantly affect boom penetration into the ocean, and that analytical theory 共e.g., Sawyers,4 Cook,5 Sparrow and Ferguson 13兲 is a valid tool to estimate underwater sonic boom pressures. In particular, these theories can be confidently used to estimate potential environmental impacts of sonic booms underwater. ACKNOWLEDGMENTS
We thank Jacques Lemire and Glenn Offield for superb engineering support during the instrumentation development and field experiment, Bill Gaines for facilitating the experimental logistics and clearances, Jo Griffith for graphics, and the test pilots at the Naval Air Station Pt. Mugu for their flight support during the experiment. We thank Vic Sparrow for helpful discussions, and two anonymous reviewers for suggestions that have improved the manuscript. This work was funded by the NASA Langley Research Center 共Technical Monitor, Dr. Kevin Shepherd兲.
3083
J. Acoust. Soc. Am., Vol. 107, No. 6, June 2000
1
P. N. Borsky, ‘‘Community reactions to sonic booms in the Oklahoma City area,’’ AMRI-TR-65-37, U.S. Air Force 共Feb. 1965兲. 2 H. W. Carlson and D. J. Maglieri, ‘‘Review of sonic-boom generation theory and prediction methods,’’ J. Acoust. Soc. Am. 51, 675–685 共1972兲. 3 ‘‘Status of sonic boom methodology and understanding,’’ NASA Conference Publication 3027 edited by C. M. Darden 共1988兲. 4 K. Sawyers, ‘‘Underwater sound pressure from sonic booms,’’ J. Acoust. Soc. Am. 44, 523–524 共1968兲. 5 R. K. Cook, ‘‘Penetration of a sonic boom into water,’’ J. Acoust. Soc. Am. 47, 1430–1436 共1970兲. 6 J. F. Waters and R. E. Glass, ‘‘Penetration of sonic boom energy into the ocean: An experimental simulation,’’ Hydrospace Research Corp. Final Report on Contract FA70WAI-185, HRC TR 288 共June 1970兲, available from NTIS/DTIC as AD 711 963. 7 P. Intrieri and G. Malcolm, ‘‘Ballistic range investigation of sonic-boom overpressures in water,’’ AIAA J. 11, 510–516 共1973兲. 8 R. W. Young, ‘‘Penetration of sonic booms into the ocean,’’ J. Acoust. Soc. Am. 44, 392 共1968兲. 9 R. J. Urick, ‘‘Sonic booms in the sea,’’ Naval Ordinance Laboratory Technical Report NOLTR 71-30 共1971兲. 10 J. L. Rochat and V. W. Sparrow, ‘‘Two-dimensional focusing of sonic boom noise penetrating an air-water interface,’’ AIAA J. 35共1兲, 35–39 共1997兲. 11 H. K. Cheng and C. J. Lee, ‘‘A theory of sonic boom noise penetration under a wavy ocean,’’ AIAA Paper 98-2958, 2nd AIAA Theoretical Fluid Mechanics Meeting, Albuquerque, NM 共1998兲. 12 F. Desharnais and D. M. F. Chapman, ‘‘Underwater measurements of a sonic boom,’’ Proc. Oceans 97 MTS/IEEE, 592–596 共1997兲. 13 V. W. Sparrow and T. Ferguson, ‘‘Penetration of shaped sonic boom noise into a flat ocean,’’ AIAA Paper 97-0486, 35th Aerospace Sciences Meeting and Exhibit, Reno, NV 共1997兲. 14 S. R. Norris, E. A. Haering, Jr., and J. E. Murray, ‘‘Ground-based sensors for the SR-71 sonic boom propagation experiment,’’ NASA Dryden Flight Research Center, NASA-TM-104310 September 1995. 15 W. D. Hayes, ‘‘Brief review of the basic theory,’’ Sonic Boom Research, edited by A. R. Seebass in NASA SP-147 共April 1967兲, pp. 3–7. 16 B. J. Sotirin and J. A. Hildebrand, ‘‘Large aperture digital acoustic array,’’ IEEE J. Ocean Eng. 13, 271–13,281 共1988兲. 17 G. G. Stokes, ‘‘Supplement to a paper on the theory of oscillatory waves,’’ Mathematical and Physical Papers 共Cambridge University Press, Cambridge, 1880兲, pp. 314–326. 18 M. L. Khandekar, Operational Analysis and Prediction of Ocean Wind Waves 共Springer-Verlag, New York, 1989兲, pp. 214. 19 V. W. Sparrow, ‘‘Determination of aircraft sonic boom noise penetration into seas, bays, and lakes for environmental assessment,’’ Pennsylvania State University Final Technical Report on Contract F41624-96-1-0006, February 1998. 20 D. L. Lansing and D. J. Maglieri, ‘‘Comparison of measured and calculated sonic boom ground patterns due to several different aircraft maneuvers,’’ NASA TN D-2730 共1965兲.
Sohn et al.: Sonic boom penetration into the ocean
3083