Study of mechanical motions in the basal region of the chinchilla cochlea William S. Rhodea) and Alberto Recio Department of Physiology, University of Wisconsin, Madison, Wisconsin 53706
共Received 12 December 1999; accepted for publication 28 February 2000兲 Measurements from the 1–4-mm basal region of the chinchilla cochlea indicate the basilar membrane in the hook region 共12–18 kHz兲 vibrates essentially as it does more apically, in the 5–9-kHz region. That is, a compressive nonlinearity in the region of the characteristic frequency, amplitude-dependent phase changes, and a gain relative to stapes motion that can attain nearly 10 000 at low levels. The displacement at threshold for auditory-nerve fibers in this region 共20 dB SPL兲 was ⬃2 nm. Measurements were made at several locations in individual animals in the longitudinal and radial directions. The results indicate that there is little variability in the phase of motion radially and no indication of higher-order modes of vibration. The data from the longitudinal studies indicate that there is a shift in the location of the maximum with increasing stimulus levels toward the base. The cochlear amplifier extends over a 2–3-mm region around the location of the characteristic frequency. © 2000 Acoustical Society of America. 关S0001-4966共00兲01506-X兴 PACS numbers: 43.64.Kc 关LHC兴 INTRODUCTION
Studies of cochlear mechanics have shown there is a compressive nonlinearity in the vibration of the basilar membrane 共e.g., Rhode, 1971; Sellick et al., 1982; Robles et al., 1986兲. These studies have, in large part, avoided measurements in the hook region of the cochlea, with a few exceptions 共Khanna and Leonard, 1982; Cooper and Rhode, 1992; Xue et al., 1995; Narayan and Ruggero, 1999兲. This avoidance appears to be due to the fact that the highest-frequency region of the cochlea is more sensitive to insult and to date has not yielded measurements of comparable sensitivity and nonlinear compression to those just a few millimeters apical to the round window region. Lack of a compressive nonlinearity in the vibration of the basilar membrane is generally thought to imply the cochlea was damaged before measurements were made. There have also been few systematic observations of the spatial distribution of the vibration of the basilar membrane for a set frequency. An exception is the study by Russell and Nilsen 共1997兲 that showed the spatial pattern of a 15-kHz tone in the guinea pig cochlea. They concluded that there was no movement of the position of the maximum vibration along the cochlear length with increasing stimulus level, even though a compressive nonlinearity was obtained. This result is at odds with the results of noise damage studies of the cochlea, where it is known that the maximum damage occurs at a location tuned ⬃0.5 octave higher than the exposure frequencies 共Cody and Johnstone, 1981; McFadden, 1986; Ruggero et al., 1996兲. In addition, everything known about the displacement transfer curves for a given location in the cochlea indicates that there is a shift to lower frequencies of the maximum in the transfer function as level is increased, a result also found by Nilsen and Russell. This frequency shift should translate into a longitudinal shift of the location of the maximum vibration with level. The shift is attributed a兲
Electronic mail:
[email protected]
3317
J. Acoust. Soc. Am. 107 (6), June 2000
to the compressive nonlinearity in the region of the resonant frequency for a region that only extends in frequency about 0.5 octave below the characteristic frequency 共CF兲. Another contentious issue is the radial pattern of vibration of the basilar membrane. The basilar membrane is far from a homogeneous mechanical structure and much evidence indicates that outer hair cells 共OHCs兲 induce motion 共Brownell et al., 1985兲. As such, there have been attempts to determine whether there are higher-order modes of vibration in the basilar membrane. Direct measurements in the 15-kHz region of the guinea pig cochlea indicate that there is a 180° phase difference between regions of the basilar membrane 共Nilsen and Russell, 1999兲 supporting the existence of higher-order modes. Some cochlear model and hair cell studies have come to a similar conclusion 共Kolston, 1999; de Boer, 1990; Hubbard, 1993; Mountain and Cody, 1999兲. In contrast, Cooper 共1999a兲 found no higher-order modes of vibration in the 30-kHz region of the guinea pig cochlea. The octave difference in the regions investigated in the two sets of measurements 共15- vs 30-kHz tuning兲 could be a factor in the different outcomes. The present set of studies was undertaken to address these issues using the basal region of the chinchilla cochlea as the venue. As will be shown, our results indicate that the basal region of the cochlea behaves similarly to the more apical region 共9 kHz兲 that has been extensively studied 共e.g., Robles et al., 1986; Ruggero et al., 1997兲. Further, there is a basal shift in the location of the maximum vibration with level increases. Finally, there are no 180° phase shifts in the radial direction of the basilar membrane over the range of levels that was used in the present series of experiments, suggesting that only a simple beam model of these vibrations of the basilar membrane in the radial direction is adequate. I. METHODS
Methods have been previously described in greater detail than here 共Cooper and Rhode, 1992兲. Seventeen chinchilla cochleas were studied at several locations that were
0001-4966/2000/107(6)/3317/16/$17.00
© 2000 Acoustical Society of America
3317
within 4 mm of the basal origin of the cochlear partition. All procedures were approved by the Animal Care and Use Committee of the University of Wisconsin-Madison. Each animal was initially anesthetized using a dose rate of 75 mg/kg of pentobarbital. Additional doses were administered to maintain the animal in a deeply areflexive state. All anesthetics were administered intraperitoneally. A tracheotomy was performed to ensure an open airway. After the ear was surgically removed, four screws were implanted in the skull and cemented in to form a rigid base. A bolt was also cemented to the base to provide for a stable fixation of the skull to a headholder with six degrees of freedom for positioning the cochlea under the microscope objective. The bulla was opened widely and a silver ball electrode was positioned so as to touch the round window for the purpose of recording the compound action potential 共CAP兲 of the auditory nerve in response to short duration tones 共16 ms兲 for each animal. Since we recorded only in the highfrequency region of the cochlea, the stimulus was stepped in 2-kHz increments from 2 to 20 kHz. At each frequency a visual detection threshold for N 1 was determined by viewing an average of 20 repetitions as the stimulus level was varied in 1-dB steps. If the thresholds were above our best threshold curve by more than 30 dB, no data were collected. High CAP thresholds equated to little or no compression in the hook region 共Sellick et al., 1982兲. CAPs were not typically recorded after mechanical measurements were initiated except to verify that they increased whenever mechanical sensitivity decreased. In the hook region, surgery involved either cutting the round window membrane with a tungsten microelectrode that had a curved tip, or if a more apical location 共3–4 mm from the base兲 was to be included in the study, the overlying cochlear bone was shaved down using a microchisel until the remaining tissue and/or bone debris could be removed with the microelectrode pick. Gold-coated polystyrene beads 25 m in diameter served as retroreflectors. They were placed in the perilymph and allowed to sink to the basilar membrane. They have a specific gravity of 1.05 that should minimize any loading of the basilar membrane. In the more apical locations, a glass cover slip was then placed over the opening with no hydromechanical seal. The cover glass served to avoid the problem of an unstable air–fluid interface. When measurements were made in the hook region, a glass cover was laid over the bony cochlea and extended out over the round window. Perilymph wicked up to the glass and the beads could then be imaged without the detrimental effects on the measurements that occur through an unstable interface between the perilymph and air. An opening in the bony ear canal, immediately over the tympanic membrane, was made so that the probe tube of a 1/2-in. Bruel&Kjaer condenser microphone could be visualized as it was positioned parallel to the tympanic membrane within 1 mm of the tip of the malleus. The opening was sealed with a glass cover after a 45-m bead was placed on the tympanic membrane at the tip of the malleus 共or umbo兲. The bead was used as a retroreflector for the interferometer and allowed the measurement of the transfer function of the malleus. A probe tube was inserted through the ear canal 3318
J. Acoust. Soc. Am., Vol. 107, No. 6, June 2000
along with the sound source and fixed in place with dental cement forming a closed-field acoustic system. The sound source was a reverse-driven condenser microphone cartridge with digital compensation for the nonlinearity resulting in all harmonics being ⬍⫺50 dB relative to the fundamental for stimulus levels between 80 and 100 dB SPL and ⬍⫺70 dB re the fundamental for levels ⬍80 dB SPL. The stimuli were presented by a 16-bit D/A at a 200-kHz rate (TDT® ). The temperature of the cochlea can have an effect on the operation of the cochlea, especially in the hook region. Cooling the guinea pig cochlea to 36° caused CAP thresholds to increase for frequencies above 24 kHz 共Brown et al., 1983兲. Thresholds of auditory-nerve fibers 共ANFs兲 are usually increased by 20 to 30 dB when the temperature of the cochlea is reduced by ⬃5 °C to 29–32 °C 共Ohlemiller and Siegel, 1994兲. In order to be certain that results were not being compromised by cochlear temperature, it was measured with a microthermister in several experiments. The chinchilla’s core temperature was ⬃35.6 °C when measured in a resting 共sleep兲 state. The temperature was manipulated in a few experiments to determine if normal variation in temperature was a cause for concern. While cooling the cochlea down to 31 °C significantly increased the CAP thresholds, temperatures around 35 °C had little effect on CAPs or vibration amplitudes 共⬍2 dB based on two experiments兲. Nevertheless, the homeothermic heating blanket used to maintain the chinchilla’s core temperature at 37.5 °C was wrapped completely around the chinchilla with an edge positioned near the bulla. Mechanical responses were measured using a custombuilt displacement-sensitive heterodyne laser interferometer 共Cooper and Rhode, 1992兲. The laser was coupled to the preparation using a long working distance lens 共Nikon SLWD 5X, NA 0.1兲. The laser was focused to a spot ⬃5 m on the reflective beads. The interferometer was not sensitive enough to measure basilar-membrane vibration without the gold-coated beads. Instantaneous phase was measured using two single-cycle phasemeters that worked in quadrature. The phasemeter outputs were sampled at 250 kHz and the phase was unwrapped using software. Response amplitudes were corrected for the frequency response of the recording system. The noise floor was ⬍5 pm/冑Hz. Basilar-membrane input–output 共I/O兲 functions were determined using 30-ms tone bursts with 1-ms raised-cosine rise and fall times and presented every 100 ms. The stimulus level covered a 100-dB SPL range in 5-dB SPL steps. A minimum of eight responses was averaged. Analysis consisted of Fourier decomposition of the steady-state portion of the averaged response at the stimulus frequency. Vibration of the ossicles was measured at the tip of the manubrium 共umbo兲 or at the incudo–stapedial joint or both locations either before or after 共sometimes both before and after兲 the basilar-membrane measurements. Abbreviations: ANF: auditory nerve fibers; dB SPL: decibels re 0.0002 dynes/centimeter squared sound-pressure
W. S. Rhode and A. Recio: Mechanical motions in the chinchilla cochlea
3318
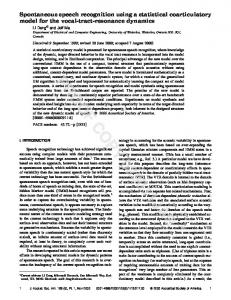
FIG. 1. Data shown are for a location in the region of the round window. 共A兲 I/O functions at the frequencies indicated in the legend. 共B兲 Growth rate is measured as the slope of the I/O functions in panel 共A兲 in dB/dB 共dB nm/dB SPL兲. Slopes of: ⬍1 imply compression, ⫽1 means linear, and ⬎1 expansive nonlinearity. CF⫽12 kHz is marked by the arrow. 共C兲 The BM transfer curves are normalized by stimulus level from 0 to 80 dB SPL 共10-dB increments兲. Increasing linewidth indicates increasing stimulus level. 共D兲 The basilar membrane to umbo transfer ratios for 0 to 80 dB SPL. Increasing linewidth indicates increasing level where the level step size is 10 dB. The dashed line for 80 dB SPL indicates that the data were extrapolated from the I/O functions using the final slope. Chinchilla cb04.
level; f: frequency; OHC: outer hair cells; I/O: input/output functions. II. RESULTS A. Amplitude functions
One of the fundamental properties of vibration of cochlear mechanics is the compressive behavior of basilarmembrane vibration that has been quantified best in the basal region of the cochlea. The compressive nonlinearity in the vicinity of the characteristic frequency is now attributed to the outer hair cells 共OHCs兲. Cochlear mechanical studies to date have been principally in the basal region of chinchilla and guinea pig cochleas, though the most basal portion, often referred to as the hook region, has not been extensively studied 共Robles et al., 1986; Sellick et al., 1982; Cooper, 1999a; Nuttall and Dolan, 1996; Khanna and Leonard, 1982兲. Present studies cover the most basal 4 mm of the cochlea including the hook region 共5500 Hz⬍CF⬍18 000 Hz兲. Amplitude input/output 共I/O兲 functions are shown in Fig. 1共A兲 for a location along the basilar membrane with a CF of 12 kHz that was accessed by removing the round window membrane. A displacement of 0.5 nm at 0 dB SPL indicates this cochlea exhibited excellent sensitivity. The deviation of I/O functions from the straight line 共upper left3319
J. Acoust. Soc. Am., Vol. 107, No. 6, June 2000
hand corner兲 indicates nonlinear compression of the amplitude response. The slope of the I/O functions, dB nm/dB SPL and abbreviated dB/dB, is termed growth rate: 0 dB/dB implies maximum compression 共no growth兲, 1 dB/dB implies linearity or no compression, and values ⬎1 imply an expansive nonlinearity. At CF, some compression remains even at 0 dB SPL. Well below CF the I/O functions are linear, while above CF the compression first increases and then decreases abruptly until it disappears completely, as seen for 15 kHz. Isolevel growth-rate functions derived from the I/O functions in Fig. 1共A兲 illustrate compression is a continuously varying function of both frequency and level 关Fig. 1共B兲兴. At CF 共indicated by the arrow兲, growth rate is 0.85 dB/dB at 10 dB SPL, indicating compression that increases in strength until growth rate reaches 0.2 dB/dB at 70 dB SPL. Maximum compression occurs above CF at 13 kHz. There is a transition region where I/O curves become expansive 共slope ⬎1 dB/dB兲 for 15 kHz at the higher levels and for 14 kHz between 35 and 45 dB SPL. For frequencies ⬎CF, the I/O relations begin to become linear as compression decreases. Below CF the compression decreases with frequency until the I/O curves become linear at 8 kHz and remain so for all lower frequencies. The growth-rate func-
W. S. Rhode and A. Recio: Mechanical motions in the chinchilla cochlea
3319
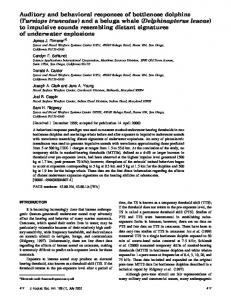
tions indicate that there is a ‘‘threshold’’ for the start of compression that continuously increases as the frequency deviates from the region of maximum compression. These general features of the compressive behavior hold across the entire basal region. The I/O functions are used to construct frequencytransfer functions for the basilar membrane at this cochlear location. As the stimulus level is increased, compression causes the peak frequency to decrease, and at the same time the peak to broaden 关Fig. 1共C兲兴. The maximum shift in the peak is ⬃0.5 octave. The increase in amplitude of vibration over an 80-dB input range at CF is 45 dB less due to compression. If the data were extrapolated to 100 dB SPL, the estimate of the decrease in gain due to compression would be 62 dB. However, it will be shown that this is not entirely justified based on measurements made at the 90–100-dB SPL levels in other experiments. Frequency-transfer functions at each level were normalized by the vibration of the umbo at the same levels to remove the level contribution to the resulting transfer functions along with the middle ear vs frequency relation 关Fig. 1共D兲兴. For the linear part of the response ( f ⬍8 kHz) all isolevel functions superimpose, while for f ⬎8 kHz they increasingly deviate from each other. The 0-dB curve shows a maximum gain of 65 dB over umbo vibration. For purposes of comparison with other data in the literature where the basilar membrane to stapes motion is compared 共Ruggero et al., 1997兲, the basilar membrane to malleus ratio has to be increased at least 10 dB to obtain the basilar membrane to stapes ratio; therefore, the gain would be ⬎75 dB. The broadening of the mechanical filter with increasing level is obvious 共note that the 80-dB dashed curve is an extrapolation of the data based on the slope of the I/O curves at 70 dB SPL兲. For most of these studies, I/O functions were measured at 20 to 40 frequencies for levels that sometimes reached 100 dB SPL. If all of the data from one spot were displayed together, the result would be too complicated, so only a portion of the data are displayed in Fig. 2共A兲 and 共B兲. The I/O level functions are compressive in the vicinity of CF⫽7250 Hz 关Fig. 2共A兲兴. As the frequency increased beyond CF 共e.g., 8500 Hz兲 the compression increased and there is a gradual tendency for the I/O curves to trend towards a linear relation at levels ⬎90 dB SPL. This was a consistent feature whenever the data were collected at sufficiently high levels. For some frequencies ⬎CF, a nonmonotonicity is seen in the I/O curves where the amplitude decreases with increasing level. This feature, usually referred to as a notch, was shown previously in the apex where it was concluded that it was due to opening the cochlea 共Cooper and Rhode, 1996兲. This notch in the base appears more complicated in that it may actually be two 共or more兲 notches that occur at different frequencies and levels 共see Fig. 11兲. The normalized amplitude functions in Fig. 2共B兲 are similar to those in Fig. 1共C兲, except for lower gain. In contrast, the growth-rate functions illustrate some additional features 关Fig. 2共C兲兴. First, as the stimulus level is increased to 80–90 dB SPL, compression decreases for much of the frequency range including CF. Second, the I/O curves tend back toward a linear relation. Third, in the region of the I/O 3320
J. Acoust. Soc. Am., Vol. 107, No. 6, June 2000
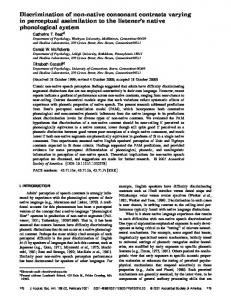
notches, the compression curves become complex. The slope of these curves becomes negative. For some frequencies near the notch frequency the I/O curves become expansive, as seen for the 90-dB SPL level curve that has a growth rate ⬎1 dB/dB. The compressive behavior shown in Fig. 2 is a general feature of basilar-membrane vibration present across the range of CFs that was studied. Figure 3 illustrates this for CFs of 5500, 9750, and 14 000 Hz in three separate experiments. The sensitivity varied somewhat across these studies with a significant portion of the variability being due to the placement of the gold bead retroreflector. Since these beads were allowed to sink through the perilymph, there was no control over where they would land or whether they would reflect well once they were in position. Beads near the center of the basilar membrane consistently had the higher sensitivity. The sets of I/O curves shown were selected because they represent the extremes in CFs 共5500 Hz was the lowest CF and 14 kHz was near the highest CF兲 not because they had the best sensitivity or largest compression. Compression decreased with increasing level for f ⬎CF where the slopes of the I/O functions are seen to increase for levels ⬎85 dB SPL 关Fig. 3共A兲兴. This feature is also seen in the growth-rate functions in Fig. 3共C兲 where the highest level function, indicated by the thickest line, is closer to 1.0 共no compression兲 than the immediately lower levels. This relation holds across all frequencies. At the highest frequencies the growth rate goes above the 1-dB/dB value, implying expansion. The I/O functions for the 9750-Hz location exhibit the same pattern versus frequency relative to CF as the lower-frequency location 关Fig. 3共D兲兴. The amplitude curves in panel 共E兲 show that the compression at CF is ⬃55 dB over the 100-dB SPL range. Again, growth rate decreases at high levels as seen best in panel 共F兲 where the thickest line 共highest level兲 is closer to 1 dB/dB than the immediately lower levels. In addition, the I/O functions are expansive around 12 kHz. For a location accessed through the round window with a CF⫽14 kHz, most of the features of the I/O and growth-rate functions are similar to those in the lower CF region, implying that there is little change in the mechanical vibration of the basilar membrane in the hook region of the cochlea 关Fig. 3共G兲,共H兲,共I兲兴. Compression is similar, exhibiting a return to linearity at high frequencies 共e.g., 20 kHz兲 with an expansive nonlinearity at high levels and high frequencies and a ⬃0.5-octave shift at the highest levels. B. Phase functions
Phase of firing of auditory-nerve fibers exhibits a lag/ lead relation for frequencies below/above CF with increasing stimulus level and no change at CF 共Anderson et al., 1971兲. This basic relation appears to have a basis in the motion of the basilar membrane 共Geisler and Rhode, 1984; Ruggero et al., 1997兲. The phase data corresponding to the amplitude data in Fig. 1 are shown in Fig. 4 in two forms. Panel 共A兲 shows the phase versus frequency relation at several stimulus levels after it has been corrected for the umbo phase 共which also removes the phase associated with the acoustic characteristic of the phone兲. The dB level is indicated by symbols
W. S. Rhode and A. Recio: Mechanical motions in the chinchilla cochlea
3320
FIG. 2. The tranfer functions for the 7.25-kHz region of a chinchilla cochlea. 共A兲 Amplitude I/O functions at the frequencies listed in panel 共D兲. In panels 共A兲 and 共D兲, only every third I/O function is shown. Also, all I/O function for frequencies below 3500 Hz are not shown since they are linear and the phase functions are constant. 共B兲 The normalized amplitude functions based on the I/O functions shown in part 共A兲. Heavier lines indicate the higher levels 共0 to 100 dB SPL in 10-dB steps in this panel and all others兲. 共C兲 The compression curves based on the data in part 共A兲. 共D兲 The phase I/O curves at the indicated frequencies. 共E兲 The phase-transfer curves corresponding to the amplitude transfer curves shown in panel 共B兲. The symbols indicate one-tenth of the stimulus level in dB SPL 共a 20-dB increment was used兲. The fact that all the symbols do not superimpose implies a nonlinear process. 共F兲 The phase difference between the 30-dB SPL phase-transfer curve and higher-level phase data is plotted based on the phase relation shown in panel 共E兲 共cb61兲.
where the number circled is the first digit of the stimulus level 共e.g., 햴⫽30 dB SPL兲. At CF⫽12 kHz there is little change in phase with level while below CF the phase decreases 共phase lag兲 and above CF the phase increases 共phase lead兲. At sufficiently low frequencies the I/O function becomes linear, and phase changes with level are absent. In summary, the mechanics appear to underlie the auditorynerve phase behavior. Another way of displaying the same data is to plot phase versus level, analogous to amplitude I/O functions 关Fig. 4共B兲兴. At the lowest frequency ( f ⫽6 kHz), which had a linear I/O function, there is little phase change with level. As the frequency is increased up to the CF of the region and the I/O functions begin to show compression, the phase lags 3321
J. Acoust. Soc. Am., Vol. 107, No. 6, June 2000
with increasing level. At 12 kHz 共⫽CF兲 there is no phase change between 20 and 40 dB SPL but a phase lag does exist at the highest level. At 13 kHz ( f ⬎CF) there is an increasing phase lead up to a level of 65 dB SPL. This basic pattern was repeated in all the data collected for which compression was present. A more complete set of phase data than shown in Fig. 4 consists of data for a wider frequency range and stimulus levels as high as 100 dB SPL 关Fig. 2共D兲,共E兲兴. Below CF, the phase lags with increasing level. At CF below 50 dB SPL there is virtually no phase change, while above this level there is a phase lag. Above CF there is an increasing phase lead 共relative to lower levels兲 up to 55 dB SPL. For levels ⬎55 dB SPL, there is always a phase lag except at frequen-
W. S. Rhode and A. Recio: Mechanical motions in the chinchilla cochlea
3321
FIG. 3. I/O, transfer, and compression functions are illustrated for three sets of responses. 共A兲–共C兲 Data for chinchilla cb58. CF⫽5.5 kHz. 共D兲–共F兲 Data for cb24. CF⫽9.75 kHz. 共G兲–共I兲 Data for chinchilla cb21. CF⫽14 kHz. In all cases heavier lines correspond to higher stimulus levels. All levels shown are in 10-dB steps. Data were collected in 5-dB steps as shown in top panels. Every other I/O curve is shown with all the low-frequency I/O curves not shown. The labels in panels 共B兲, 共C兲, 共E兲, 共F兲, 共H兲, and 共I兲 are the stimulus levels in dB SPL and are positioned nearest the appropriate curve.
cies corresponding to notches 共dips兲 in the I/O functions. At notch frequencies, phase can be somewhat unpredictable, either increasing or decreasing by a variable amount up to 180°. An alternate way of displaying the data in Fig. 2共E兲 is to compute the phase difference between each phase-transfer curve and the 30 dB SPL phase curve; phase versus level and phase versus frequency relations are thereby emphasized 关Fig. 2共F兲兴. The typical phase lag/lead relation below/above CF is present. At the highest stimulus levels 共shown with the thickest lines兲, for f ⬎CF and levels ⬎60–70-dB SPL, the phase lags. At a notch frequency of 9.25 kHz, a rapid phase change of ⬃0.5 cycle occurs. C. Longitudinal spatial patterns
One aspect of cochlear mechanical studies that has received little attention is the spatial distribution of basilarmembrane motion for individual frequencies. This has been largely due to the difficulty of making the required measurements. A major problem is that making the required large 3322
J. Acoust. Soc. Am., Vol. 107, No. 6, June 2000
opening in the cochlea increases the possibility of damage to the cochlea. One study of the spatial distribution of a 15-kHz tone in the base of the guinea pig cochlea is due to Russell and Nielsen 共1997兲. The measurement approach used here differs from theirs in that a complete set of I/O functions was collected at several locations along the basal region of the cochlea. From these I/O functions any spatial measure can be derived, e.g., the amplitude and phase-transfer functions at each location, as is illustrated for seven locations in Fig. 5共A兲 and 共B兲. The CFs associated with the most basal and apical points are 13 and 6.75 kHz, respectively. Based on Greenwood’s formula for the chinchilla, the cochlear distance between these frequencies is 2.46 mm 共Greenwood, 1990兲. The measured distance was 2.3 mm. Based on this agreement, the formula was used to locate the 10-kHz point at 1.25 mm and is indicated by the arrow in Fig. 5共C兲 共see the caption兲. The amplitude- and phase-spatial distribution produced by 10-kHz stimuli are shown in Fig. 5共C兲 and 共D兲. The lowest level in the amplitude curve is for 20 dB SPL and at this level the peak amplitude occurs at 1.25 mm and
W. S. Rhode and A. Recio: Mechanical motions in the chinchilla cochlea
3322
stimulus level was set to 50 dB SPL, a value in the compressive region of the I/O functions. The apical extent of the spatial vibration pattern is seen to move systematically toward the base as the CF is increased in 1-kHz steps. The apical slopes of the amplitude pattern are all similar, with the attenuation rate for the 12-kHz curve equal to ⫺47 dB/mm. Clearly, finer spatial sampling increments are desirable but difficult to achieve when using beads. These data can also be used to determine a number of other features of the traveling waves. For example, the traveling wave velocity versus location for any frequency can be determined from the phase relations, as is shown for two experiments in Fig. 8. For frequencies low relative to CF, the velocity can be as high as 100 m/s 关4.5 kHz at 0.2 mm, off scale in Fig. 8共C兲兴. For waves due to frequencies corresponding to CF for the region, e.g., 10 kHz in panel 共A兲, the velocity has slowed to ⬃8 m/s. Waves due to frequencies above the CF appear to reach a velocity plateau between 5–6 m/s. As expected, the waves slow down rapidly even before they reach their respective resonance location. An important traveling wave characteristic is its wavelength. As the wave approaches its resonant location it slows down and therefore its wavelength shortens 关panels 共B兲 and 共D兲兴. The wavelength corresponding to a 10-kHz tone is ⬃0.6 mm at its CF location. Therefore, wavelength is smaller than the depth of the cochlear scalae in this region, implying that this is a short-wave condition for the traveling wave consistent with prevailing theory 共de Boer, 1984兲. This has implications for models of cochlear mechanics that often employ simplifications based on a long-wave condition. FIG. 4. The phase relations for the tranfer- and I/O functions shown in Fig. 1. Level code in panel 共A兲 as in Fig. 2共E兲. CF⫽12 kHz.
D. Radial relations
gradually shifts to the 0.8-mm location with increasing level and towards the 0.2-mm location at the highest level. The frequency shift for this spatial shift is from the 8250-Hz to the 12 500-Hz region 共recognizing that the spatial distribution is fairly crudely sampled兲. This shift is in contrast to the results of Russell and Nilsen 共1997兲, who report that for 15 kHz in the guinea pig that there was no spatial shift of the peak amplitude. A second spatial study is illustrated in Fig. 6 for five locations spanning 1.2 mm with a CF frequency range between 10.5 and 15.7 kHz. The results are similar to those shown in Fig. 5. In particular, there is a shift in the spatial location for the maximum toward the base with increasing level 关Fig. 6共C兲兴. There is also a corresponding change in the phase relation as a function of increasing level that is apparent since all the phase curves do not superimpose 关Fig. 6共D兲兴. At the highest level there is a phase lag at all locations indicated by the thickest line, while at lower levels there is a phase lag/lead relation for locations basal/apical to the CF location. Three other studies of the longitudinal pattern yielded results consistent with those shown. Collecting complete frequency transfer functions at several locations permits construction of the spatial distributions produced by pure tones over the region studied. Figure 7 shows the distributions for five frequencies 共9–13 kHz兲 based on the data collected at seven locations 共Fig. 5兲. The
Figure 9 illustrates transfer functions for locations that were nearly radial 关see the inset of panel 共B兲兴. Point 4 was located 130 m longitudinally from point 5, which was located ⬃80 m from point 9. All the amplitude transfer functions indicate that the locations had similar CFs even though they could have substantially different amplitudes. The vibration at locations that were close to the edges of the cochlear partition was up to 20 dB less in amplitude than those near the center of the partition 关Fig. 9共A兲兴. The phase portions of the transfer functions are all similar, with the most basal location 共bead 4兲 having the smallest phase accumulation at any frequency. Since it is difficult to see the relative phase at each frequency in these curves, a phase-difference curve is computed by subtracting the phase for the fifth location from all others 关panel 共C兲兴. The phase differences between location 5 and locations 2, 6, and 8 are relatively small, ⬍30°. There are somewhat larger phase differences between locations 5 and 9, where up to a 90° phase difference is noted. However, the phase differences can be reconciled based on longitudinal position of the beads alone 共e.g., 80 m between the longitudinal positions of the 5th and 9th locations兲. More important, the maximum phase differences for any combination of locations give no indication of 180° variation in phase in the radial direction anywhere along the basilar membrane. For locations near the edges of the partition, the amplitudes are often 20 dB less than those at the center of the partition, and occasionally result in noisier sig-
3323
J. Acoust. Soc. Am., Vol. 107, No. 6, June 2000
W. S. Rhode and A. Recio: Mechanical motions in the chinchilla cochlea
3323
FIG. 5. Data collected in a single experiment at seven locations along the basal cochlea 共cb31兲. CFs and their locations relative to the most basal location of the group were 14 700 Hz/200 m, 14 300 Hz/300 m, 12 100 Hz/800 m, 10 700 Hz/1250 m, 7900 Hz/1750 m, 7000 Hz/2110 m, and 6000 Hz/2360 m derived from the BM/umbo transfer ratio at 40 dB SPL 共cb31兲. 共A兲 Seven isolevel-transfer functions at 50 dB SPL. The 6000-Hz amplitude function is labeled with its relative location: 2.36 mm. The line thickness is increased with increasing CF and is used the same way in panel 共B兲. 共B兲 Phase portion of the corresponding transfer functions at 70 dB SPL. 共C兲 Spatial distribution of amplitude for 10 kHz derived from the 7 sets of I/O functions at 20 to 90 dB SPL. The arrow indicates the location of CF. 共D兲 Spatial phase-transfer function corresponding to the amplitude data in part 共C兲. Data derived from the phase I/O relations at the levels indicated. The 40-, 50-, 60-, and 70-dB SPL phase functions all superimpose. Thicker lines indicate higher levels.
nals and the possibility that the phase measures are also noisy. The phase curves were computed at 70 dB SPL in order to avoid low-amplitude, possibly noisy data as much as possible. Comparisons with the phase curves at lower stimulus levels showed no essential difference. Sets of mechanical I/O functions were measured at eight locations spread longitudinally over ⬃250 m in another study where the nominal CF was 8.75 kHz 关Fig. 10共A兲兴. The amplitude characteristics reflect the radial position of the beads 关inset, Fig. 10共B兲兴: the beads closest to the strial ligament exhibit the smallest amplitudes. The phase relations around CF are highlighted in Fig. 10共B兲 by limiting the range of frequencies. All the phase curves are monotonically decreasing functions of frequency. The phase curves for locations 2 and 7 overlap nearly exactly, which is reassuring since they are for the same bead taken at a 2-h interval. The beads that were nearly radial have the smallest phase differences 共beads 6 and 7 and 8 and 9兲. The longitudinal positions of beads 3 through 8 were 80, 140, 220, 50, 0, 220, and 280 m, respectively. For purposes of comparison, the phase characteristic for location 5 was subtracted from all others. The resulting phase differences are relatively small 关Fig. 10共C兲兴. For example, between beads 8 and 9 the phase difference is only a 3324
J. Acoust. Soc. Am., Vol. 107, No. 6, June 2000
few degrees at CF, even though they are at different edges of the basilar membrane. Similarly, the phase difference between beads 6 and 7 is less than 70°, an amount that is attributed to a 40-m difference in their longitudinal position. The important point is that there is no indication of 180° phase differences between the vibration of the beads as a function of radial position. Based on these two studies and seven others, the basilar membrane appears to vibrate in a first-order mode. E. Notches
A dip or notch has been observed in the rate-level function of auditory-nerve fibers at levels ⬎90 dB SPL. A phase change of 180° usually accompanies the notch but is often seen at high levels even if there is no notch. A twocomponent theory of operation for auditory nerve has been proposed to explain this phenomenon 共Liberman and Kiang, 1984; Kiang et al., 1986兲. Few observations of a notch in mechanical studies have been made including those in the basal region of the cochlea 共e.g., Patuzzi et al., 1984; Recio et al., 1998兲. In contrast, in nearly every transfer curve measured in this study, for which there were low CAF
W. S. Rhode and A. Recio: Mechanical motions in the chinchilla cochlea
3324
FIG. 6. Data collected in a single experiment at five locations in the basal cochlea. The CFs and their locations relative to the most basal point were 15 700 Hz/0 m, 14 000 Hz/85 m, 12 700 Hz/435 m, 10 800 Hz/1005 m, and 10 500 Hz/1205 m 共cb030兲. 共A兲 The five amplitude-transfer functions. 共B兲 The phase portion of the corresponding transfer functions. 共C兲 The amplitude distribution for 13 kHz derived from the five sets of I/O functions at each of the levels indicated. 共D兲 The spatial phase-transfer function corresponding to the amplitude data in part 共C兲. Data derived from the phase I/O relations at the levels indicated.
thresholds and accompanying good compression 共implying the cochlear amplifier was working nearly normally兲, a notch was present. Figure 11共A兲 shows a set of isolevel curves that corre-
FIG. 7. A set of spatial displacement functions derived from a set of the frequency transfer curves for six locations in a single experiment 共cb30兲. The representation gets poorer as the location moves basally due to fewer locations remaining on which to base the spatial pattern. Stimulus level was 30 dB SPL. 3325
J. Acoust. Soc. Am., Vol. 107, No. 6, June 2000
sponds to the 10 200-Hz region of the cochlea. Typical compression at and above the CF with linear growth of the vibration below CF is observed. Above CF, at the frequencies indicated by the arrows 共10 700, 12 250, and 14 500 Hz兲 there are dips in the curves where the displacement-level curve was nonmonotonic. This pattern was always seen whenever there was strong compression. One to three dips were typically observed. A displacement-level I/O function at 11.5 kHz for which a particularly deep notch at 90 dB SPL was seen is shown in panel 共B兲. Note the rate of growth for levels ⬎86 dB SPL is faster than linear; that is, it is expansive. The corresponding phase-level relation shows a phase lead that increases with level and is nearly 90° by 80 dB SPL. As the notch is traversed, a⬎180° phase change occurs. This behavior is very similar to that reported for frequencies corresponding to notches in ANF rate-level functions. A difference is that only a single notch frequency has been observed in ANFs, never as many as three as seen here. It is possible they exist in ANF responses but have not been seen since the dips are small. At the minimum of the displacement-level curve, the waveform of the displacement shows that the vibration is ‘‘nearly’’ canceled throughout the stimulus presentation 关panel 共C兲兴. Also, a small increase in amplitude is seen between 5 and 30 ms. Exceptions to cancellation are at the
W. S. Rhode and A. Recio: Mechanical motions in the chinchilla cochlea
3325
FIG. 8. Two sets of velocity versus location relations derived from data in two chinchillas 关共A兲 cb31, 共C兲 cb30兴. The phase data at 70 dB SPL was used to determine the velocity using the relation: velocity⫽(x2⫺x1) *frequency/共2⫺1兲 where x1 and x2 are distances in meters and 2 and 1 are phases in cycles. The resulting velocities are plotted at the midpoint of the adjacent locations. The label near the individual curves is the frequency in kHz. 共B兲 Illustration of how the wavelength for a 10-kHz tone and a tone varies longitudinally 共cb31兲. 共D兲 Illustration of how the wavelength for a 7.5-kHz tone varies longitudinally 共cb30兲.
onset and offset of the stimulus, where large transients are seen. Expanding the initial portion of the waveform, it is clear there is over a 1-ms delay before the cancellation begins 关panel 共D兲兴. The initial portions of the waveforms for two levels at the notch frequency are shown, one below the notch at 80 dB SPL and one above at 100 dB SPL in panel 共E兲. During the initial response (t⬍1 ms) the two responses are in phase. By t⬎1.9 ms they are 180° out of phase and remain there throughout the stimulus presentation. It appears that there is a delay before the phase shift occurs of over 1 ms from the onset of the response. It is also apparent that there is a latency difference in the response with the highlevel response occurring ⬃100 s earlier than the lowerlevel response. It is only after the stimulus is turned off that the two waveforms again have the same phase 关panel 共F兲兴. The frequency at which the notch occurred varied appropriately as the CF was varied. In experiments in which transfer functions were measured at several locations, the notch remained on the high-frequency side of the transfer function in approximately the same relative position with respect to the CF. Interestingly, the phase difference between the frequencies of occurrence of the notches in an experiment was usually about 360°. Depth of the notch varied, though this could be attributed to the probability that the best frequency– SPL combination for the notch was not presented. There were no notches seen upon death or in experiments where the cochlear amplifier was not operational, i.e., when the displacement-level functions were linear. In other words, a 3326
J. Acoust. Soc. Am., Vol. 107, No. 6, June 2000
viable cochlea was necessary for the occurrence of these notches. III. DISCUSSION
Issues that this study addressed were: 共1兲 normal characteristics of vibration in the hook region of the chinchilla cochlea; 共2兲 spatial vibration patterns of the cochlear partition in the longitudinal direction; and 共3兲 radial patterns of vibration of the basilar membrane. Outcomes of some longitudinal and radial studies do not conform in all respects to the existing views and models of cochlear mechanics 共Cooper, 1999a; Nilsen and Russell, 1999; Russell and Nilsen, 1997兲. These differences present a challenge to our understanding of cochlear mechanics that needs to be addressed. A. Basal mechanics
It has proven difficult to measure the vibration of the cochlear partition in the hook region of the cochlea for reasons that are not entirely understood. There is some indication that the cochlear temperature may be a factor in determining sharp, sensitive, and compressive vibration 共Ohlemiller and Siegel, 1994兲. However, in exploring this factor, it did not seem to enter in for the temperatures 共⬃35.5 °C兲 that the cochlea was normally at in these experiments. Others have heated the earpiece that connected the phone to the ear to maintain cochlear temperature and found that there was still relatively poor sensitivity and gain in the
W. S. Rhode and A. Recio: Mechanical motions in the chinchilla cochlea
3326
FIG. 9. Study of the vibration of the basilar membrane for several points that were nearly radially located along the cochlear partition. 共A兲 Individual amplitude portions of the mechanical tuning functions obtained in chinchilla, cb61. The amplitude for location 7 was too low for the curve to appear on the graph. 共B兲 Phase portions of the mechanical tuning functions. Included is an inset that shows the relative location of the gold beads used in making the measurements. The scale bar corresponds to 100 m in the longitudinal direction. The width of the basilar membrane at this location is ⬃200 m. The size of the symbols does not correspond to the size of the 25-m beads. 共C兲 Phase difference relations determined by subtracting the phase relation for the 5th point from the other phase characteristics. Medial: the basilar-membrane attachment medially is the spiral osseus lamina. The vertical lines indicate the lateral and medial extents of the basilar membrane.
hook region 共Narayan and Ruggero, 1999兲. Of course, the reduced sensitivity in the hook region could be the correct result, especially in animals with high initial CAPs corresponding to frequencies for this region. Further, it has been suggested that the cochlear amplifier is composed of a series of OHCs that occupies ⬃1.25 mm around the CF location 共Russell and Nilsen, 1997兲. As the basal extreme of the cochlea is reached, there are no more OHCs basal to the CF site to contribute to cochlear amplification. This reduction of OHCs contributing to cochlear amplification could underlie the rapid increase in the thresholds of high-frequency auditory-nerve fibers observed experimentally. We did not reach the high-frequency limit of the chinchilla cochlea, so this hypothesis was not tested directly. At least in the 12–14-kHz region of the cochlea, the sensitivity and nonlinear compression appear to be similar to that of the 9-kHz region of the cochlea 共see Fig. 1兲. Mechani3327
J. Acoust. Soc. Am., Vol. 107, No. 6, June 2000
FIG. 10. Vibration of the basilar membrane for several points that were located almost radial along the cochlear partition is illustrated. 共A兲 Amplitude portion of the basilar membrane to umbo transfer function at 40 dB SPL. Location of the beads is illustrated in panel 共B兲. Measurements of bead 7 were a repeat of those on bead 2. The scale bar corresponds to 100 m. The width of the basilar membrane at this location was 200 m. 共B兲 Portions of the phase transfer function 共BM–umbo兲 corresponding to the amplitude curves in panel 共A兲. The frequency axis is restricted to the CF region. Inset shows the relative locations of the gold beads used in making the measurements. Measurements of bead 7 were repeat measurements on bead 2. 共C兲 The phase-difference relations determined by subtracting the phase relation for the 5th point from the others. More basal beads will show an accumulated phase lead with increasing frequency and more apical beads will show phase lag 共cb17兲.
cal transfer functions in the two regions are similar, indicating a gradual variation in the mechanical response properties from base to apex. When different locations exhibited good sensitivity, the amplitude characteristic, phase characteristic, and gain were similar across the 5.5- to 15-kHz region of the cochlea. Amplitude compression was as strong as 0.2 dB/dB at CF and could reach 0 dB/dB above CF similar to previous results 共Ruggero et al., 1997兲. As the stimulus frequency is increased above CF, there is a plateau region of the transfer function where the I/O functions are linear. There is often a notch in the amplitude I/O function for frequencies ⬎CF and a corresponding phase change that is a complex function of frequency and level and can be as large as 180°. This behav-
W. S. Rhode and A. Recio: Mechanical motions in the chinchilla cochlea
3327
FIG. 11. 共A兲 A set of isolevel amplitude functions for chinchilla cb30. The highest curve is for 100 dB SPL. The curves correspond to stimulus levels of 0 to 100 dB SPL in 10-dB steps. Arrows point to the location of the notches in the curves. 共B兲 The two pair of curves illustrate the notch in a displacement-level curve 共solid line兲 and the phase curve 共dashed line兲 at 12 250 Hz. The function covering 20 to 100 dB SPL in 5-dB steps was repeated in 1-dB steps from 80 to 100 dB SPL 20 min later 共the curve with the sharp notch兲. 共C兲 The waveform corresponding to the lowest point in the notch. 共D兲 The initial portion of the waveforms corresponding to the 80-dB SPL point 共dashed line兲 and the 100-dB SPL point 共solid line兲 for the curve shown in panel 共B兲, 共E兲, 共F兲. The initial 关panel 共E兲兴 and the final 关panel 共F兲兴 portions of the displacement waveform for stimulus levels below and above the notch level are shown. The steady-state portions of the two waveforms are 180° out of phase.
ior has been attributed to the fast wave interacting with the traveling wave and results in portions of the I/O functions being expansive. The fast wave is due to a compression wave in the fluid that travels at the speed of sound in water. The sensitivity of the basilar membrane in this region was shown to be around 0.5 nm at 0 dB SPL and 1.6 nm at 20 dB SPL (n⫽13). The gain basilar-membrane vibration over that of the stapes was ⬃79 dB (n⫽13). These values are more sensitive by around 20 dB than those previously obtained in the hook region 共Narayan and Ruggero, 1999兲. B. Phase characteristic
Anderson et al. 共1971兲 have shown ANFs exhibit increasing phase lags below CF and increasing phase leads above CF with increasing level. Basilar-membrane mechanics exhibit similar behavior 共Rhode and Robles, 1974; Geisler and Rhode, 1982; Cooper and Rhode, 1992; Sellick et al., 1982; Nuttall and Dolan, 1996兲. Ruggero et al. 共1997兲 3328
J. Acoust. Soc. Am., Vol. 107, No. 6, June 2000
demonstrated phase behavior in basilar-membrane mechanics of the 9-kHz region of the chinchilla cochlea compatible with auditory-nerve phase behavior. They showed phase changes as large as 180° over an 80-dB range 共20–100 dB SPL兲 both above and below CF. Similarly, in our most sensitive cochleas, the phase changes are limited to the nonlinear region and can approach 180° at some frequencies 关e.g., Fig. 4共B兲兴. In general, the phase changes were smaller, often ⫾45° over most of the frequency range and are consistent with the lag/lead behavior below/above CF 关Fig. 2共F兲兴. However, at levels ⬎80 dB SPL, it was often observed that relative phase lags occurred across all frequencies. Phase versus level changes were usually absent in cochleas with low sensitivity, as was also reported by Ruggero et al. 共1997兲. C. Phase after death. Is there a problem?
Upon death and the subsequent loss of the cochlear amplifier, phase lags the values found in the live cochlea
W. S. Rhode and A. Recio: Mechanical motions in the chinchilla cochlea
3328
共Rhode, 1973兲. In contrast, Nuttall and Dolan 共1996兲 found phase leads of up to 270° for frequencies at and above CF in one guinea pig after death. Similarly, Ruggero et al. 共1997兲 found smaller phase leads at CF upon death. In two comparisons of live/dead phase-transfer characteristics, a phase lag at levels ⬎80 dB SPL across all frequencies was found. There was one condition where the lag/ lead change was found, that is, when the phase characteristic was measured immediately upon death 共within a few minutes兲. Presumably the cochlear amplifier does not cease to function instantaneously 共cf. Xue et al., 1996兲. If the time after death was greater than 1 h, the phase always lagged that in the live cochlea. Even in the live cochlea for stimulus levels ⬎80 dB SPL, phase lagged that at lower levels. This is consistent with the cochlear amplifier being saturated at high levels and thereby the mechanism becoming linear. It is likely that phase effects after death are complex and ‘‘likely affect several sites and processes in a time-varying manner’’ as suggested by Ruggero et al. 共1997兲. D. Spatial vibration patterns
One of the very difficult aspects of measuring the basilar-membrane vibration along the longitudinal direction is the need to access several millimeters of the cochlea to make the observations interesting. This increases the likelihood that the large opening in the cochlea will result in cochlear impairment. In fact, the basal cochlea has always seemed to be very susceptible to insult for as yet poorly understood reasons. A spatial study of the basal region was performed in guinea pig with a laser-diode interferometer, that works by feeding light reflected from the cochlear partition back into the laser-diode cavity, without the use of a retroreflector, to amplitude modulate the diode output 共Russell and Nilsen, 1997兲. This feedback results in modulating the amount of power out of the diode depending on the distance from the laser and is relatively linear over a 40-nm range. The system is calibrated in situ. They usually measured the vibrations for ⬃5 locations in a single study but measured them at many locations at 15 kHz using the footplate of the outer pillar cell as the reference point in one animal. Their results in some respects appear similar to the present results. However, one principal difference is that they conclude that the location of the maximum displacement for a given frequency does not change with level. This is an unexpected result because, if the presumed log共frequency兲 versus cochlear-position relation holds, one would conclude from the shift in the peak frequency observed when the frequency transfer function is measured at one location, that a basal shift in the location of the maximum should be obtained when a single frequency vibration is observed over the spatial domain. Our results differ from Russell and Nilsen’s on this matter. We performed experiments where several complete transfer functions were measured at up to eight longitudinally distributed locations. Each reconstruction of a spatial frequency distribution based on the I/O functions for individual locations showed that with increasing level, the location of the maximum shifted basally, as was expected theoretically. This shift also agrees with the noise-damage data 3329
J. Acoust. Soc. Am., Vol. 107, No. 6, June 2000
that show the location of maximum damage is basal to the CF region of the exposure frequency or center frequency of a noise band 共McFadden, 1986兲. In fact, it is difficult to discern how any other outcome is possible. The discrepancy between the two outcomes is difficult to explain and we can but list the differences in experimental protocols in search of the causes. Perhaps there was partial damage of the cochlea in the Russell and Nilsen experiments 共1997兲. Their I/O curves appear to be linear up to 40–60 dB SPL, which is substantially higher than the 10–20-dB SPL levels of compression onset in Nuttall and Dolan’s data 共1996兲. In comparing Russell and Nilsen’s experiments to the present experiments, the cochlea was opened in a similar manner in both cases though a different species was used. The use of beads in the present experiments dictates that only a small number of locations can be measured in a single preparation since the location of the beads is not controlled. They fall where they may and they may not reflect well enough to insure a good signal-to-noise ratio, in which case they cannot be used. However, the use of a retroreflector insures that the motion that is reported is that of the bead which is presumed to reflect the motion of the underlying basilar membrane. Without a retroreflector it would be possible for the reflecting surface共s兲 to switch between various elements of the organ of Corti without knowing that the switch occurred or to reflect from several surfaces with different vibration patterns within the depth of field of the microscope objective. There are multimicron noise movements during the experiment due to breathing and heartbeatassociated movements that could result in switching the reflecting membrane. Further, the signal-to-noise ratio is considerably less than with a retroreflector. It has been reported that in comparison of measurements of the vibration of the cochlear partition using a bead and a nearby site without a bead that the two transfer functions differed substantially 共Khanna et al., 1998兲. New modes of vibration were created or the bead just did not follow the motion of the basilar membrane. One difference between their use of a bead and ours is that the specific gravity of their glass bead was high 共⬃2兲. The polystyrene beads used here had a specific gravity of 1.05; that is, about the same as water. This was done so that the bead would have a minimum load on the basilar membrane. In modeling the effect of placing a bead on Claudius cells, they state that if the bead had the same density as the fluid, the bead would move with the fluid to a good approximation. In the present study, there was never any indication that the bead was not well behaved in its vibration; that is, it did not appear to introduce any new modes of vibration that would have been manifest by either rapid phase or amplitude fluctuations. Cooper has recently demonstrated that these polystyrene beads follow the motion of the basilar membrane in the guinea pig basal region of the cochlea using an interferometer that does not require the presence of a bead 共Cooper, 1999b兲. Thus, we conclude that the use of retroreflectors does not introduce appreciable errors.
W. S. Rhode and A. Recio: Mechanical motions in the chinchilla cochlea
3329
F. Are there radial modes of vibration in the basilar membrane?
FIG. 12. The longitudinal extent of the compressive region in mm. The distances are determined by determining the intercept of the isolevel growth-rate curves 关e.g., Fig. 3共C兲, 共F兲, and 共I兲兴 with the growth rate⫽1 dB/dB horizontal line. *’s mark the total and 䊐’s mark the basal compressive region extents, respectively.
E. Spatial extent of the cochlear amplifier
The spatial extent of the cochlear amplifier is of interest to cochlear modelers. One method of determining the spatial extent of the cochlear amplifier is based on the hypothesis that there is log-frequency versus distance relation in the cochlea. The implication is that the mechanical transfer function for a single location in the cochlea can be transformed to a spatial pattern for a single frequency. The region of compression based on the growth-rate curves is used to determine the spatial extent of the compressive region for a set of 15 experiments with the use of the Greenwood map for chinchilla 共Fig. 12兲. Two sets of data are shown, in the region basal to the CF location 共䊐, basal兲 and the entire compressive extent 共*, total兲. The total extent varies fairly systematically with location 共CF兲, decreasing from ⬃3.5 to 2 mm as the base is approached. The basal portion of the cochlear amplifier varies less along the extent for which measurements are available and is of the order of 1.2 mm. There is an alternative definition of the cochlear amplifier based on power dissipation and modeling the cochlea that derives a value of ⬃1.75 mm for the extent of the cochlear amplifier and locates it ‘‘basal’’ to the CF location 共de Boer and Nuttall, 2000兲. The study of Russell and Nilsen 共1997兲 at the 15-kHz location of the guinea pig cochlea suggested the spatial extent was around 1.25 mm. This was taken to imply that around 375 OHCs contributed to cochlear amplification. Cody 共1992兲 recorded auditory-nerve frequency threshold curves 共FTCs兲 after making mechanical lesions in the cochlea. He found normal FTCs at distances from 0.2 to 1.25 mm from the lesion site that implies 60 to 360 OHCs are involved in cochlear amplification. While our estimates are higher than either of these, the extent of the cochlear amplifier is level dependent and this may account for part of the difference between the various estimates. In any case, these data indicate that the cochlear amplifier has a significant longitudinal extent to be considered in any cochlear model. 3330
J. Acoust. Soc. Am., Vol. 107, No. 6, June 2000
An important consideration is whether the motion of the cochlear partition along the radial direction is a simple function or whether the known varying properties of the cochlear partition between the pars arcuata and pars pectinata result in more complex vibration modes 共Xue et al., 1996兲. Nilsen and Russell 共1999兲 found considerable variation in the phase of vibration of the basilar membrane in the radial direction. They argued that OHCs provide the drive near the arcuate– pectinate junction via their active properties. According to this view, OHCs are depolarized and contract as the basilar membrane moves toward the scala vestibuli causing the basilar membrane to move further in the same direction, and they are hyperpolarized and expand when the basilar-membrane motion is reversed, thereby driving the basilar membrane further toward the scala tympani. However, the pillar cells, Dieter cells, and their connections to the basilar membrane constrain the motion in complex ways. This argument, plus the fact that the bimodal pattern was shown to be absent after the death of the animal, implied that the cochlear amplifier was somehow involved. By contrast, Cooper’s measurements 共1999a兲 did not reveal a complex radial pattern and only a first-order mode of vibration in the 30-kHz region of the guinea pig cochlea. A heterodyne laser interferometer was used and the laser spot was focused to a spot size comparable to that of the Nilsen and Russell interferometer. No beads were used in either case and the motion was sampled at very small spatial intervals in both cases. The laser-diode technique does require that the system be calibrated each time it is repositioned. In addition, the optical path lengths of the signal and reference arms of the interferometer must be maintained at a multiple of /2 共 is the wavelength of the laser兲 in order to function properly. This is a difficult task due to rapid motion introduced by breathing and heartbeats. In addition the reflectivity of the basilar membrane varies along the radial direction. Whether these factors could produce predictable, and possibly repeatable, variations is not known to us. If there were similar mode changes at lower frequencies one would expect them to be observable in auditory-nerve studies that utilize phase locking of the neural discharges. Nuttall and Dolan 共1996兲 measured the phase at two nearly radial locations, at the outer pillar cell and the OHCs. No phase differences ⬎45° were found, a result that is comparable to those reported here. The vibration of the basilar membrane along its radial extent in response to electrical stimulation has been shown to be of uniform phase 共Nuttall et al., 1999, see Fig. 4兲. The phase differences found here increased with frequency at or above CF, yet remained ⬍90°. Most of the differences are explainable by a lack of perfectly radial alignment of the beads. The 25-m diameter beads we used are relatively large compared to the 200-m width of the basilar membrane and therefore might have obscured rapid phase changes by averaging over a radial segment. This could explain missing the out-of-phase motion that was found for a few microns segment of the basilar membrane under the inner hair cells 共IHCs兲 by Nilsen and
W. S. Rhode and A. Recio: Mechanical motions in the chinchilla cochlea
3330
Russell 共1999兲. However, this explanation is unlikely in the vicinity of the OHCs where their out-of-phase measurements occurred over a much larger expanse. The crucial motions are those of the feet of the outer pillar cells, since they effectively support the reticular lamina, and that of the basilar membrane under the outer hair cells. These movements are critical to the drive of the OHC stereocilia. The motion of the basilar membrane 共BM兲 and reticular lamina in an isolated cochlea were shown to be in opposite directions while applying electrical stimulation 共Mammano and Ashmore, 1993; Xue et al., 1996兲. OHCs contracted during depolarization with the reticular lamina moving 5–10 times further than the BM. This implies that the reticular lamina has an additional hingepoint and is substantially less stiff than the basilar membrane. The results shown here indicate that with the use of retroreflectors there is no indication of higher-order modes of vibration in the radial direction. Some phase change is observed that ranges from 30–60°, but in some measurements the phase-transfer function was always very orderly and could be described as well-behaved. The changes that were seen could easily be explained as a result of the beads not being aligned exactly radially. However, it should be noted that several attempts at modeling the organ of Corti motion, using finite-element approaches to represent the three-dimensional structure, have resulted in higher modes in the vibrations of the simulated basilar membrane. This is a natural result of the attachment of the basilar membrane and the attachment of the pillar cells to the basilar membrane 共Zhang et al., 1997; Kolston, 1999兲. In this respect the Nilsen and Russell observations are consistent with these model results. G. Notches
There is a precedent for notches in the rate-level functions of ANFs that were most often clearest for lower CF fibers. The general features were a sharp dip in the rate-level function usually in the vicinity of 90 dB SPL and an accompanying 180° phase change. However, these features do not occur in all ANFs. This behavior is hypothesized to result from the interaction of two components in the cochlear response to sound. The first component is dominant at low levels and is associated with the nonlinear compressive response. The second component grows linearly, starts small, and is 180° out of phase with the first. Aspects of the mechanical data are in agreement with the auditory-nerve data. The clearest examples of notches were for levels between 85 and 95 dB SPL where the 180° phase shift also occurs. However, the mechanical data have additional features that confound such a straightforward interpretation: 共1兲 there can be more than a single notch, though secondary dips were never very deep; 共2兲 the level at which the notch 共dip兲 occurred varied from 30 to 90 dB SPL; 共3兲 the phase change was not always a jump of 180°, and 共4兲 when there were multiple notches at several frequencies the phase differences between adjacent dips were ⬃360°. These additional features may result from the use of sensitive preparations and smaller frequency sampling intervals than used in the past. A consideration of why there may be some 3331
J. Acoust. Soc. Am., Vol. 107, No. 6, June 2000
areas of disagreement is that often stimulus levels of up to 110 dB SPL were employed to study the second component in ANF responses. Levels above 100 dB SPL were not used since the interferometer would saturate; furthermore, high levels could cause temporary threshold shifts. There have been descriptions of notches in the mechanical data. Cooper and Rhode 共1996兲 found in the guinea pig apex of the cochlea that a notch could occur that was prominent on the high-frequency side of the mechanical tuning curve. The notch was hypothesized to be the result of the interaction between a fast fluid-conducted wave and the slower basilar-membrane traveling wave. Later, they showed that much of the notch was likely due to the opening that is made in the scala vestibuli that provides a shunt for the acoustic pressure wave, thereby resulting in a place where the pressure can leave the cochlea. Upon sealing the cochlea 共chinchilla兲 most, if not all, of the notch disappeared. For some unexplained reason, the notch was more prominent in guinea pigs. The physical basis of the notch remains an open question, noting that the notch in auditory-nerve fibers rateresponse occurs in a closed cochlea. Further, why haven’t clear indications of it been seen in high CF auditory-nerve response maps? Perhaps most response maps, either mechanical or neural, have not sampled the stimulus plane in sufficient detail or at high enough levels as done here. One indication of a second component in the absence of a notch is the rapid phase change 共⬃180°兲 at high stimulus levels that cannot be observed for frequencies above 4–5 kHz due to an absence of phase locking. It is also possible that the notch is labile; that is, the notch is not always seen in every unit and every subject and may shift or disappear with high exposures. In our experience, on occasion, a repeat of the ratelevel curve in both nerve and mechanics at the notch frequency showed a change of depth and position of the notch. Nevertheless, it is clear that the notch is dependent on cochlear nonlinearity and compression since it is absent when the I/O curves are linear or the animal is dead. IV. SUMMARY
Basilar-membrane mechanics in the base of the chinchilla cochlea covering the 5.5- to 15-kHz frequency range appear to be consistent in a number of characteristics. The basilar membrane has a maximum displacement of 1.6 nm at a sound-pressure level of 20 dB and a maximum gain of ⬃80 re the stapes vibration. It has a compressive nonlinearity in the region of the characteristic frequency as measured by the growth-rate functions, similar in magnitude and extent over the entire frequency range and comparable to previously reported data. A consistent notch in displacement-level functions for several frequencies above the characteristic frequency was found in those cochleas that had strong compression. Notches were never present in damaged or dead cochleas. These notches have a resemblance to those reported in rate-level functions in auditory nerve where a 180° phase shift is often observed near sound-pressure levels of 90 dB. In addition, for frequencies near and immediately higher than the notch frequency, there is an expansive nonlinearity above the levels for which the notch occurs. The
W. S. Rhode and A. Recio: Mechanical motions in the chinchilla cochlea
3331
notch and expansive nonlinearity likely result from two processes that interact in both a constructive and destructive manner. The phase versus level dependency is consistent with auditory-nerve data, i.e., a phase lag/lead with increasing level for frequencies below/above CF. For sound-pressure levels above 80 dB there is only a phase lag that may be due to the saturation of the cochlear amplifier. The spatial pattern of vibration for a tone is consistent with expectations based on the log-frequency relation. That is, as level increases the location of the maximum displacement moves toward the base. The velocity of the traveling wave near the resonance location was shown to slow up to ⬃5 m/s. In the radial direction, it appears that the motion is analogous to that of a simple beam model for a transverse section of the cochlear partition at stimulus levels less than 100 dB SPL. ACKNOWLEDGMENTS
This work was supported by the National Institute of Deafness and Communications Disorders, Grant No. R01 DC 01910. Special thanks to C. Daniel Geisler for his careful reading of this manuscript. Anderson, D. J., Rose, J. E., Hind, J. E., and Brugge, J. F. 共1970兲. ‘‘Temporal position of discharges in single auditory nerve fibers within the cycle of a sine-wave stimulus: Frequency and intensity effects,’’ J. Acoust. Soc. Am. 49, 1131–1139. Brown, M. C., Smith, D. I., and Nuttall, A. L. 共1983兲. ‘‘The temperature dependency of neural and hair cell responses evoked by high frequencies,’’ J. Acoust. Soc. Am. 73, 1662–1670. Brownell, W. E., Bader, C. R., Bertrand, D., and de Ribaupierre, Y. 共1985兲. ‘‘Evoked mechanical responses of isolated cochlear outer hair cells,’’ Science 227, 194–196. Cody, A. R. 共1992兲. ‘‘Acoustic lesions in the mammalian cochlea: Implications for the spatial distribution of the active process,’’ 62, 166–172. Cody, A. R., and Johnstone, B. M. 共1981兲. ‘‘Acoustic trauma: Single neuron basis for the half-octave shift,’’ J. Acoust. Soc. Am. 70, 707–711. Cooper, N. P. 共1999a兲. ‘‘Radial variations of the cochlear partition,’’ in Recent Developments in Auditory Mechanics, edited by H. Wada and T. Takasaka 共World Scientific, Singapore兲. Cooper, N. P. 共1999b兲. ‘‘Vibration of beads placed on the basilar membrane in the basal turn of the cochlea,’’ J. Acoust. Soc. Am. 106, L59–L64. Cooper, N. P., and Rhode, W. S. 共1992兲. ‘‘Basilar membrane mechanics in the hook region of cat and guinea-pig cochlea,’’ Hear. Res. 63, 163–190. Cooper, N. P., and Rhode, W. S. 共1996兲. ‘‘Fast traveling waves, slow traveling waves and their interactions in experimental studies of apical cochlear mechanics,’’ Aud. Neurosci. 2, 289–299. de Boer, E. 共1984兲. ‘‘Auditory physics: Physical principals in hearing theory. II,’’ Phys. Rep. 105, 141–226. de Boer, E. 共1990兲. ‘‘Wave-propagation modes and boundary conditions or the Ulfendahl–Flock–Khanna preparation,’’ in Mechanics and Biophysics of Hearing, edited by P. Dallos, C. D. Geisler, J. W. Matthews, M. A. Ruggero, and C. R. Steele 共Springer, New York兲, pp. 333–339. de Boer, E., and Nuttall, A. F. 共2000兲. ‘‘The mechanical waveform of the basilar membrane. III. Intensity effects,’’ J. Acoust. Soc. Am. 107, 1497– 1507. Geisler, C. D., and Rhode, W. S. 共1982兲. ‘‘The phases of basilar membrane vibrations,’’ J. Acoust. Soc. Am. 71, 1201–1203. Greenwood, D. D. 共1990兲. ‘‘A cochlear frequency-position function for several species—29 years later,’’ J. Acoust. Soc. Am. 87, 2592–2605. Hubbard, A. E. 共1993兲. ‘‘A traveling-wave amplifier model of the cochlea,’’ Science 259, 68–71. Khanna, S. M., and Leonard, D. G. B. 共1982兲. ‘‘Basilar membrane tuning in the cat cochlea,’’ Science 215, 305–306. Khanna, S. M., Ulfendahl, M., and Steele, C. R. 共1998兲. ‘‘Vibration of reflective beads placed on the basilar membrane,’’ Hear. Res. 116, 71–85. Kiang, N. Y. S., Liberman, M. C., Sewell, W. F., and Guinan, J. J. 共1986兲. ‘‘Single unit clues to cochlear mechanisms,’’ Hear. Res. 22, 171–182. 3332
J. Acoust. Soc. Am., Vol. 107, No. 6, June 2000
Kolston, P. J. 共1999兲. ‘‘Comparing in vitro, in situ, and in vivo experimental data in a three-dimensional model of mammalian cochlear mechanics,’’ Proc. Natl. Acad. Sci. USA 96, 3676–3681. Liberman, M. C., and Kiang, N. Y. S. 共1984兲. ‘‘Single-neuron labeling and chronic cochlear pathology. IV. Stereocilia damage and alterations in rate and phase-level functions,’’ Hear. Res. 16, 75–90. Mammano, F., and Ashmore, J. F. 共1993兲. ‘‘Reverse transduction measured in the isolated cochlea by laser Michelson interferometry,’’ Nature 共London兲 365, 838–841. McFadden, D. 共1986兲. ‘‘The curious half-octave shift: Evidence for a basalward migration of the traveling-wave envelope with increasing intensity,’’ in Basic and Applied Aspects of Noise-induced Hearing Loss, edited by R. J. Salvi, D. Henderson, R. P. Hamernik, and V. Colleti 共Plenum, New York兲, pp. 295–312. Mountain, D. C., and Cody, A. R. 共1999兲. ‘‘Multiple modes of inner hair cell stimulation,’’ Hear. Res. 132, 1–14. Narayan, S. S., and Ruggero, M. A. 共1999兲. ‘‘Basilar-membrane mechanics at the hook region of the chinchilla cochlea,’’ in Recent Developments in Auditory Mechanics, edited by H. Wada and T. Takasaka 共World Scientific, Singapore兲. Nilsen, K. E., and Russell, I. J. 共1999兲. ‘‘Timing of cochlear feedback: Spatial and temporal representation of a tone across the basilar membrane,’’ Nat. Neurosci. 2, 642–648. Nuttall, A. L., and Dolan, D. F. 共1996兲. ‘‘Steady-state sinusoidal velocity responses of the basilar membrane in guinea pig,’’ J. Acoust. Soc. Am. 99, 1556–1565. Nuttall, A. L., Guo, M., and Ren, T. 共1999兲. ‘‘The radial pattern of basilar membrane motion evoked by electrical stimulation of the cochlea,’’ Hear. Res. 131, 39–46. Ohlemiller, K. K., and Siegel, J. H. 共1994兲. ‘‘Cochlear basal and apical differences reflected in the effects of cooling on responses of single auditory nerve fibers,’’ Hear. Res. 80, 174–190. Patuzzi, R., Johnstone, B. M., and Sellick, P. M. 共1984兲. ‘‘The alteration of the vibration of the basilar membrane produced by a loud sound,’’ Hear. Res. 13, 99–100. Recio, A., Rich, N. C., Narayan, S. S., and Ruggero, M. A. 共1998兲. ‘‘Basilar-membrane responses to clicks at the base of the chinchilla cochlea,’’ J. Acoust. Soc. Am. 103, 1972–1989. Rhode, W. S. 共1971兲. ‘‘Observations of the vibration of the basilar membrane in squirrel monkey using the Mo¨ssbauer technique,’’ J. Acoust. Soc. Am. 49, 1218–1231. Rhode, W. S. 共1973兲. ‘‘An investigation of post-mortem cochlear mechanics,’’ in Basic Mechanisms of Hearing, edited by A. R. Møller 共Academic, New York兲, pp. 49–63. Rhode, W. S., and Robles, L. 共1974兲. ‘‘Evidence from Mo¨ssbauer experiments for nonlinear vibration in the cochlea,’’ J. Acoust. Soc. Am. 55, 588–596. Robles, L., Ruggero, M. A., and Rich, N. C. 共1986兲. ‘‘Basilar membrane mechanics at the base of the chinchilla cochlea. I. Input–output functions, tuning curves, and response phases,’’ J. Acoust. Soc. Am. 80, 1364–1374. Ruggero, M. A., Rich, N. C., and Recio, A. 共1996兲. ‘‘The effect of intense stimulation on basilar-membrane vibration,’’ Aud. Neurosci. 2, 329–345. Ruggero, M. A., Rich, N. C., Recio, A., Narayan, S. S., and Robles, L. 共1997兲. ‘‘Basilar-membrane responses to tones at the base of the chinchilla cochlea,’’ J. Acoust. Soc. Am. 101, 2151–2163. Russell, I. J., and Nilsen, K. E. 共1997兲. ‘‘The location of the cochlear amplifier: Spatial representation of a single tone on the guinea pig basilar membrane,’’ Proc. Natl. Acad. Sci. USA 94, 2660–2664. Sellick, P. M., Patuzzi, R., and Johnstone, B. M. 共1982兲. ‘‘Measurement of basilar membrane motion in the guinea pig using the Mo¨ssbauer technique,’’ J. Acoust. Soc. Am. 72, 131–141. Xue, S., Mountain, D. C., and Hubbard, A. E. 共1995兲. ‘‘Electrically evoked basilar membrane motion,’’ J. Acoust. Soc. Am. 97, 3030–3041. Xue, S., Mountain, D. C., and Hubbard, A. E. 共1996兲. ‘‘Electrically evoked otoacoustic emissions: Direct comparisons with basilar membrane motion,’’ Aud. Neurosci. 2, 301–308. Zhang, L., Mountain, D. C., and Hubbard, A. E. 共1997兲. ‘‘Shape and stiffness changes of the organ of Corti from base to apex cannot predict characteristic frequency changes: Are multiple modes the answer?’’ in Diversity in Auditory Mechanics, edited by E. R. Lewis, G. R. Long, R. F. Lyon, P. M. Narins, C. R. Steele, and E. Hecht-Poinar 共World Scientific, Singapore兲, pp. 472–478.
W. S. Rhode and A. Recio: Mechanical motions in the chinchilla cochlea
3332