May 18, 2001 - photoemission experiments4 and earlier linearized muffin-tin orbital LMTO calculations5,6 have suggested that boron ac- quires a significant ...
RAPID COMMUNICATIONS
PHYSICAL REVIEW B, VOLUME 63, 220404共R兲
Magnetic Compton scattering study of the ferromagnetic amorphous alloys Fe1Àx Bx J. W. Taylor,1 J. A. Duffy,1 A. M. Bebb,1 M. J. Cooper,1 S. B. Dugdale,2 J. E. McCarthy,3 D. N. Timms,4 D. Greig,5 and Y. B. Xu6 1
Department of Physics, The University of Warwick, Coventry CV4 7AL, United Kingdom H. H. Wills Physics Laboratory, University of Bristol, Tyndall Avenue, Bristol BS8 1TL, United Kingdom 3 European Synchrotron Radiation Facility, Boıˆte Postale 220, F-38043 Grenoble Cedex, France 4 Division of Physics, The University of Portsmouth, Portsmouth PO1 2DT, United Kingdom 5 Department of Physics, The University of Leeds, Leeds LS2 9JT, United Kingdom 6 Department of Electronics, The University of York, York YO10 5DD, United Kingdom 共Received 18 January 2001; published 18 May 2001兲
2
The boron contribution to the total spin moment in the amorphous alloys Fe1⫺x Bx (x⫽0.2,0.24) has been determined using magnetic Compton scattering. The magnitude of the induced boron moment was found to be ⬇⫺0.04 B per formula unit which is a factor of ⬇2 less than that suggested by supercell linearized muffin-tin orbital electronic structure calculations. DOI: 10.1103/PhysRevB.63.220404
PACS number共s兲: 75.50.Bb
Metal-metalloid amorphous ferromagnetic alloys in the series Fe1⫺x Bx have been extensively studied over the past two decades, as the alloy series represent the archetypal amorphous ferromagnetic system.1–3 Recent spin-polarized photoemission experiments4 and earlier linearized muffin-tin orbital 共LMTO兲 calculations5,6 have suggested that boron acquires a significant spin moment. This investigation uses spin-polarized Compton scattering, which can probe the spin density directly, and new LMTO calculations, to determine the magnitude of the induced spin moment on the boron site, and to demonstrate that the induced boron moment is smaller than predicted previously. Fe1⫺x Bx alloys exhibit extremely soft ferromagnetism. Earlier studies of the amorphous alloys’ magnetism as a function of metalloid concentration have shown that the Fe site moment does not simply scale linearly with decreasing Fe concentration.7 The magnetic phase has two distinct regions as a function of composition. At low boron concentration the ferromagnetism results from a noncolinear arrangement of spins,8 randomly canted at ⬇40°, which results from competing ferro- and antiferromagnetic exchange interactions. As the boron concentration is increased above 30 at. % the local structure changes such that Fe d-d interactions are replaced by nonpolarizable p-d interactions and the boron atoms act as a diluent. The alloys exhibit weak ferromagnetism, characterized by the large observed magneto-volume effect. Theoretical studies have demonstrated that the Fermi energy lies in a region of high density of states in the majority band, confirming this. More recently, theoretical calculations by Bratovskey and Smirnov5 and Hafner et al.6 have prompted revived interest in this material. Supercell LMTO calculations have shown that both the amorphous and crystalline systems exhibit a small degree of ferrimagnetism induced by the strong covalent nature of the coupling between the Fe 3d orbital states and the B 2p orbital states. This coupling is stronger in the minority band and, therefore, is postulated to give rise to a small antiparallel moment on the boron sites of the order of 0.15 B and 0.25 B for the amorphous and crystalline materials, respectively. This picture is supported by spin polar0163-1829/2001/63共22兲/220404共4兲/$20.00
ized photoemission results by Xu et al.4 Their data show a degree of hybridization between the Fe 3d states and the B 2 p states in the binding energy range 1–5 eV which implies the existence of a small negative moment on the B 2p orbital. The purpose of this paper is to investigate the magnitude of the induced boron 2p spin moment in the amorphous alloys Fe1⫺x Bx using magnetic Compton scattering, and compare the experimental result with our own spin-polarized electronic structure calculations. The structural phase diagram of the series Fe1⫺x Bx exhibits a sharp eutectic at 25 at. %B, and thus amorphous alloys around this composition can be easily produced using the melt spin technique. Crystalline Fe3 B orders in one of two phases, orthorhombic Pbnm and body centered tetragonal I4/mcm, with the latter phase being the more stable. The short-range order around an iron atom in the amorphous material is similar to that of the tetragonal material.9 The alloys order ferromagnetically below T c ⬇650 K for the range of compositions used in this study. Amorphous ribbons ⬇5 mm⫻50 m of Fe80B20 and Fe76B24 were produced by melt spinning. In order to achieve an appreciable scattering volume, ten pieces of ribbon were sandwiched to produce a sample of 10⫻5⫻0.5 mm for each composition. A polycrystalline sample of Fe75B25 was produced by arc melting under an argon atmosphere. The Compton effect is observed when high-energy photons are inelastically scattered by electrons. The scattered photon energy distribution is Doppler broadened, since the electrons have a finite momentum distribution. If the scattering event is within the impulse approximation10 the measured Compton spectrum is directly proportional to the scattering cross section.11 The Compton profile is defined as a one-dimensional 共1D兲 projection onto the scattering vector of the electron momentum distribution, n(p), where the scattering vector is taken parallel to the z direction:
63 220404-1
J共 pz兲⫽
冕冕
n 共 p兲 d p x d p y .
共1兲
©2001 The American Physical Society
RAPID COMMUNICATIONS
J. W. TAYLOR et al.
PHYSICAL REVIEW B 63 220404共R兲
The integral of J(p z ) is the total number of electrons per unit cell. Magnetic Compton scattering 共MCS兲 is a probe uniquely sensitive to the spin component of a material’s magnetization. If the incident beam has a component of circular polarization, the scattering cross section contains a term which is spin dependent.12 In order to isolate the spin dependence one must either flip the sample’s direction of magnetization parallel and antiparallel with respect to the scattering vector or change the ‘‘handedness’’ of the photon helicity. Either method results in a magnetic Compton profile 共MCP兲, J mag (p z ), that is dependent upon only the unpaired spin in the sample, and is defined as the 1D projection of the spinpolarized electron momentum density: J mag 共 p z 兲 ⫽
冕冕
关 n ↑ 共 p兲 ⫺n ↓ 共 p兲兴 dp x dp y .
共2兲
Here, n ↑ (p) and n ↓ (p) are the momentum densities of the majority and minority spin bands, respectively. The integral of the MCP is normalized to the total spin moment per formula unit 共FU兲 in the sample. MCS is an established technique for determining spinpolarized electron densities.13–15 Within the impulse approximation the method is solely sensitive to spin moments.16 Unlike magnetic x-ray circular dichroism, MCS is equally sensitive to all spin-polarized electrons regardless of their binding energies and wave function symmetries. The magnetic Compton profiles of amorphous Fe80B20 , Fe76B24 , and polycrystalline Fe75B25 were measured at the high-energy beamline ID15A at the ESRF. The experiment was performed in reflection geometry at T⫽300⫾1 K. An incident beam energy of 250 keV was selected using a Si311 monochromator. At these photon energies, which are desirable for optimum resolution and interpretation within the impulse approximation, reversing the helicity of the incident photons is not practical, the spin-dependent signal was isolated by reversing the sample’s magnetization vector using a 1 T electromagnet. Circular polarization was produced by selecting a beam 1.97 rad below the orbital plane of the synchrotron,17 this value being chosen to maximize the ratio of magnetic scattering to statistical noise in the charge scattering. A degree of circular polarization of ⬇45% was obtained. The energy spectrum of the scattered flux was measured using a 13 element Ge detector at a mean scattering angle of 170°. The momentum resolution of the magnetic Compton spectrometer taken as the full width at half maximum 共FWHM兲 of the instrument response function was 0.4 a.u. 共where 1 a.u.⫽1.99⫻10⫺24 kg m s⫺1 ). The total number of counts in the charge Compton profiles was 2⫻108 with a statistical precision of ⫾2% in the resulting MCP, in a bin width of 0.1 a.u. Since the MCP is the difference between two charge Compton profiles, components arising from spin paired electrons and from most sources of systematic error are effectively cancelled out. The data were corrected for energy-dependent detector efficiency, sample absorption, and the relativistic scattering cross section. After checking that the resulting spectra were symmetric about p z ⫽0, the profiles were folded to increase the ef-
fective statistics. The profile areas were normalized onto an absolute spin moment scale using Fe data taken under the same conditions. Free atom Hartree Fock 共HF兲 wave functions have been successfully used to model the data from previous investigations where magnetic Compton scattering has been used in a site specific manner.14 However, the HF wave functions do not correctly reproduce the spin-polarized momentum density of materials at low p z where solid state effects are manifested, thus HF profiles are restricted to the study of well localized moments. Here, Compton profiles from LMTO calculations are used. The spin-dependent momentum densities for polycrystalline Fe75B25 were calculated using the LMTO method within the atomic sphere approximation 共ASA兲, including combined correction terms.18,19 The exchange-correlation part of the potential was described in the local spin-density 共LSDA兲 approximation.20 The self-consistent band structure was solved at 343 k points in the irreducible part of the Brillouin zone using a basis set of s, p, d, and f functions. The Cu3 Au structure was used with lattice parameter of 4.00 Å , chosen to give Fe-Fe and Fe-B distances close to the average distances in Fe3 B.21 With these parameters, each Fe carried a moment of 2.86 B while the B was oppositely spin polarized, carrying ⫺0.36 B , giving a net moment of 2.05 B FU⫺1 , where the formula unit 共FU兲 for this composition is Fe0.75B0.25 . The electronic wave functions were then used to generate the electron momentum densities for the spin-up and spin-down bands separately. A total of 3695 reciprocal lattice vectors were used in the calculation of the momentum density 共see also Andersen18 and Singh and Jarlborg22兲. To simulate the polycrystal, the electron momentum densities were then angularly averaged, before double integration to obtain the Compton profiles. The theoretical profiles were convoluted with a Gaussian of FWHM 0.4 a.u. in order to simulate the experimental resolution function and thus allow a direct comparison with experiment. The theoretical MCP for Fe75B25 was then produced by taking the difference of the resolution broadened spin-up and spindown charge Compton profiles. The result of the calculation compared with the experimental data is shown in the upper plot in Fig. 1. It is clear that, although the LMTO calculation produces a negative moment on the boron site, as other theoretical investigations have, the overall shape of the MCP differs markedly from experiment. Furthermore, the LMTO calculation overestimates the spin moment in the material by ⬇0.5 B . The theoretical result implies that the Fe moment has a greater degree of delocalization than is observed in experiment. To quantify such differences the LMTO profile was split into the MCPs for Fe and B to allow direct comparison with a MCP for polycrystalline Fe, and with a spherically-averaged, resolution-broadened full-potential linearized augmented-plane-wave method 共FLAPW兲 Fe calculation.23,24 The spherical average was taken as the sum of 8 appropriately weighted directional Compton profiles. The theoretical Fe data are compared with a polycrystalline Fe measurement taken at beamline BL08W at SPring8, Japan, 共with identical spectrometer resolution兲. The results of
220404-2
RAPID COMMUNICATIONS
MAGNETIC COMPTON SCATTERING STUDY OF THE . . .
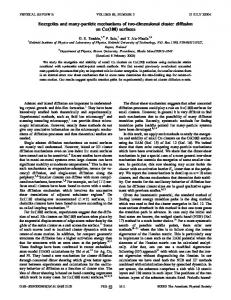
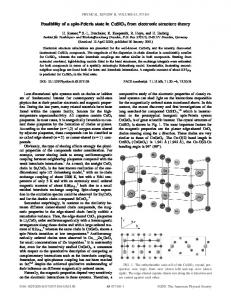
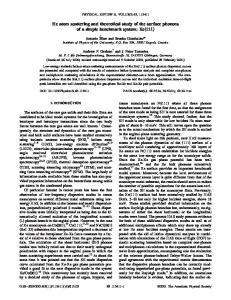
FIG. 1. Upper plot shows a comparison between the experimental magnetic Compton profile 共MCP兲 共circles兲 and LMTO calculation 共solid line兲 for polycrystalline Fe75B25 . Lower plot shows a comparison between the experimental MCP for Fe 共circles兲, LMTO calculation for Fe 共solid line兲 and spherically averaged FLAPW calculation for Fe 共dotted line兲.
this comparison are shown as the lower plot in Fig. 1. The fundamental differences between the LMTO, FLAPW, and experiment demonstrate the failure of the theory to describe correctly the Fe moment localization and the magnitude of the negative s electron contribution that occurs near p z ⫽0. Although the LMTO Fe profile is taken from a Fe3 B calculation, the effect on the Fe d band polarization from B substitution into the lattice will be minimal. As with the FLAPW data 共a pure Fe calculation兲, electron momentum density is shifted from the region p z ⬇2 a.u. to the region around p z ⫽0. Localized features in real space equate to broad delocalized features in momentum space, and vice versa, since the real and momentum space wave functions are related via a Fourier transform. In this case the theory predicts an Fe moment that is too delocalized in real space. Although the FLAPW calculation gives a better approximation to the measured polycrystalline Fe MCP, significant differences remain. The most important of these is the failure to predict correctly the momentum density in the region 2–5 a.u., again implying that the calculated degree of itinerancy is not correct. This discrepancy may be partially attributed to the failure of the LDA in this system, and the calculation may benefit from the inclusion of nonlocal exchange-correlation terms using the GGA 共Ref. 25兲 or self-interaction corrections 共SIC兲.26 From Fig. 1 we estimate that a redistribution of ⬇0.1 B of the spin resolved momentum density from delocalized 共low momentum states兲 into the localized 3d states is required. In order to determine the magnitude and orientation of the induced spin moment on boron, the experimental polycrystalline Fe MCP was used in conjunction with a boron 2p MCP calculated using the LMTO method. Experimental polycrystalline Fe data can be used to model the Fe contribution in both the amorphous and polycrystalline materials, since neither material contains long-range structural anisot-
PHYSICAL REVIEW B 63 220404共R兲
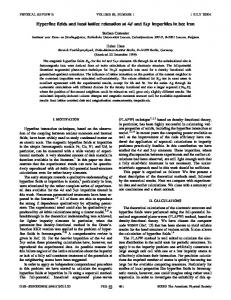
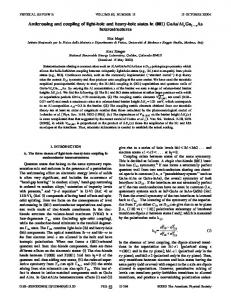
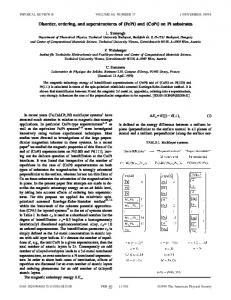
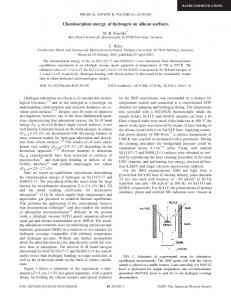
FIG. 2. The magnetic Compton profile for polycrystalline Fe75B25 共circles兲 compared with a least squares fit 共solid line兲 comprising experimental Fe MCP 共dashed line兲 and LMTO boron 2p MCP 共dotted line兲.
ropy that influence the profile at p z ⫽0. Furthermore, the short-range order, with respect to a local Fe site in the amorphous alloy, is similar to that in the crystalline sample,9 and therefore the momentum density of the spin-polarized Fe electrons can be considered as being the same in both cases, within our resolution function of 0.4 a.u. The LMTO B2p MCP and the Fe data were fitted to the Fe1⫺x Bx experimental MCP’s using a least squares fit method in the region 0 to 8 a.u. The results of the fit are presented as the solid lines in Figs. 2, 3, and 4 for polycrystalline Fe75B25 , amorphous Fe76B24 , and amorphous Fe80B20 , respectively. The result of this analysis demonstrates that a small negatively oriented B2p-type moment is present in both the polycrystalline and the amorphous samples. The values of the moments obtained are tabulated in Table I. Within statistical error the same boron moments were deduced when free atom wave functions were used, which demonstrates the robustness of the deduced B2p moment.
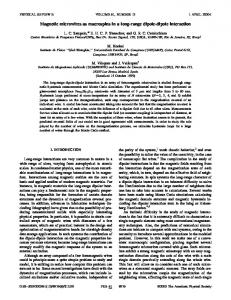
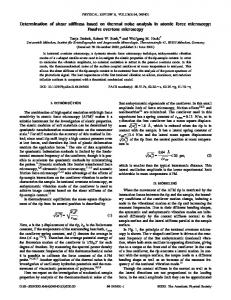
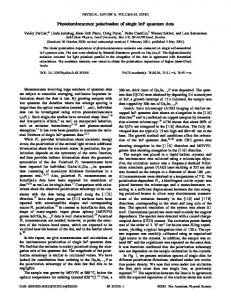
FIG. 3. The magnetic Compton profile for amorphous Fe76B24 共circles兲 compared with a least squares fit 共solid line兲 comprising experimental Fe MCP 共dashed line兲 and LMTO boron 2p MCP 共dotted line兲.
220404-3
RAPID COMMUNICATIONS
J. W. TAYLOR et al.
PHYSICAL REVIEW B 63 220404共R兲 TABLE I. Summary of experimental 共exp.兲, modeled 共model兲 site and total spin moments for the amorphous (A.) and polycrystalline (P.) Fe1⫺x Bx alloys. Moments are quoted as B FU ⫺1 .
P.Fe75B25 A.Fe76B24 A.Fe80B20
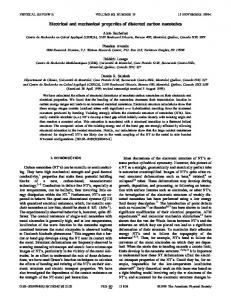
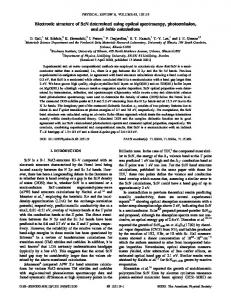
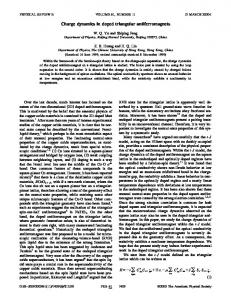
FIG. 4. The magnetic Compton profile for amorphous Fe80B20 共circles兲 compared with a least squares fit 共solid line兲 comprising experimental Fe MCP 共dashed line兲 and LMTO boron 2p MCP 共dotted line兲.
Although it is clear that the polycrystalline Fe MCP yields a good fit to the data alone in the region of momentum ⬎2 a.u., in order to achieve a good fit to the data at p z ⬍2 a.u. a small negatively oriented B2p-type contribution is needed. The dashed lines in Figs. 2, 3, and 4 show the result of fitting the Fe profile alone to the data. The differences observed when fitting the data with the Fe MCP alone are statistically significant in the region of p z ⬍2 a.u. Clearly the model is improved when a B2p-type moment is included. When our results are compared with the moments calculated by both Bratosvskty,5 Hafner,6 and our own LMTO calculations, it is clear that the experimentally determined induced boron site moment is of the same order of magnitude but is a factor of ⬇1.5⬃2 less for all three compositions measured. The reasons for the differences between
R. A. Cowley et al., J. Phys.: Condens. Matter 3, 9521 共1991兲. N. Cowlam and G. E. Carr, J. Phys. F: Met. Phys. 15, 1109 共1985兲. 3 N. Cowlam and G. E. Carr, J. Phys. F: Met. Phys. 15, 1117 共1985兲. 4 Y. B. Xu et al., IEEE Trans. Magn. 35, 3427 共1999兲. 5 A. M. Bratkovsky and A. V. Smirnov, Phys. Rev. B 48, 9606 共1993兲. 6 J. Hafner et al., Phys. Rev. B 49, 285 共1994兲. 7 N. Cowlam and G. E. Carr, J. Phys. F: Met. Phys. 15, 1109 共1985兲. 8 R. A. Cowley et al., J. Phys.: Condens. Matter 3, 9521 共1991兲. 9 M. L. Fdez-Gubieda et al., Phys. Rev. B 62, 5746 共2000兲. 10 P. M. Platzman and N. Tzoar, Phys. Rev. B 2, 3556 共1970兲. 11 P. Holm, Phys. Rev. A 37, 3706 共1988兲. 12 F. Bell, J. Felsteiner, and L. P. Pitaevskii, Phys. Rev. A 53, R1213 共1996兲.
MCS moment exp.
Fe model
B model
Total
1.41共1兲 1.40共1兲 1.43共1兲
1.43共2兲 1.431共2兲 1.460共2兲
⫺0.04(1) ⫺0.031(1) ⫺0.032(1)
1.39共2兲 1.40共2兲 1.428共2兲
experiment and theory are thought to lie in the fine balance between itinerant and localized magnetism in Fe. Compared to our experiment, the LMTO model yields an Fe moment that is too delocalized. In turn this delocalization may result in a larger induced moment on boron than is observed experimentally. It is quite likely that this is a result of the limitations of the LDA in describing localized states. The predicted negative moment on boron arises from to exchange between the boron 2p band electrons and the spin-polarized Fe band electrons. Since the theory predicts a Fe site moment with a more itinerant character it follows that the exchange interaction between the two sites may be poorly described, causing a large spin polarization to appear on the boron site. Our experimental results demonstrate that a small moment is induced on the boron site in Fe1⫺x Bx and is a factor of ⬇1.5⬃2 less than that predicted by supercell LMTO based theory. We ascribe the differences to the failure of the theoretical models to reproduce the correct localization of the Fe site moment, and have shown that the theoretical approximations used do fail in this respect. We would like to thank the ESRF and SPring8 for provision of beam time, and the EPSRC 共UK兲 for financial support.
J. A. Duffy et al., Phys. Rev. B 61, 14 331 共2000兲. J. E. McCarthy et al., Phys. Rev. B 62, R6073 共2000兲. 15 J. A. Duffy et al., J. Phys.: Condens. Matter 10, 10 391 共1998兲. 16 P. Carra et al., Phys. Rev. B 53, R5994 共1996兲. 17 J. E. McCarthy et al., J. Synchrotron Radiat. 4, 102 共1997兲. 18 O. K. Andersen, Phys. Rev. B 12, 3060 共1975兲. 19 T. Jarlborg and G. Arbman, J. Phys. F: Met. Phys. 7, 1635 共1977兲. 20 O. Gunnarsson and B. I. Lunqvist, Phys. Rev. B 13, 4274 共1976兲. 21 W. Y. Ching et al., Phys. Rev. B 42, 4460 共1990兲. 22 A. K. Singh and T. J. Jarlborg, J. Phys. F: Met. Phys. 15, 727 共1985兲. 23 Y. Kubo 共private communication兲. 24 Y. Kubo and S. Asano, Phys. Rev. B 42, 4431 共1990兲. 25 J. P. Perdew, Phys. Rev. Lett. 55, 1665 共1985兲. 26 W. M. Temmerman, Z. Szotek, and H. Winter, Phys. Rev. B 47, 11 533 共1993兲.
1
13
2
14
220404-4