Visualization of Anatomical Structures Based on Implicit Surfaces and Displacement Mapping A. del R´ıo WSI/GRIS University of T¨ubingen Sand 14, D-72076. T¨ubingen, Germany
[email protected]
M. Amor Dept. of Electronics and Systems Univ. of A Coru˜na, Spain
[email protected]
M. B´oo, X.M. Pardo Dept. of Electronics and Computing Eng. Univ. of Santiago de Compostela, Spain {mboo,pardo}@dec.usc.es
ABSTRACT Implicit models provide an accurate and flexible representation of a surface. Although they have been widely used in modeling contexts, their application to visualization has been relatively limited due to rendering difficulties. Typical explicit triangulation of the surface, though effective, results in a redundant representation and a high load on the bus between the CPU and the graphics pipeline. In this work, we present an alternative method that allows high quality visualization of iso-surfaces with lower communication requirements. Our proposal is based on the combination of implicit surfaces with displacement mapping techniques. The application of displacement maps on a coarse mesh approximating the implicit model avoids the necessity of explicit triangulation and reduces the bus load without loss of image quality. The examination of the iso-surface contour, by means of a frequency analysis, allows for automatic creation of the displacement map which better suits to the implicit model in question. In this study we demonstrate the validity of the proposal as an efficient alternative to polygonization of implicit surfaces, thus opening many new possibilities to its application to volume visualization. Keywords Implicit Surfaces, Displacement Mapping, Fourier Transform, Medical Visualization.
1. INTRODUCTION In recent years the accuracy provided by medical datasets, typically acquired with CT (Computed Tomography) and MRI (Magnetic Resonance Imaging) scanners, has been significantly increased. This enhancement in the precision of the scans comes at the cost of larger dataset sizes, which have to be properly handled in order to obtain efficient rendering and high quality images. Here we focus on the use of Indirect Volume Rendering for the visualization of these Permission to make digital or hard copies of all or part of this work for personal or classroom use is granted without fee provided that copies are not made or distributed for profit or commercial advantage and that copies bear this notice and the full citation on the first page. To copy otherwise, or republish, to post on servers or to redistribute to lists, requires prior specific permission and/or a fee. WSCG POSTERS proceedings WSCG’2004, February 2-6, 2004, Plzen, Czech Republic. Copyright UNION Agency – Science Press.
3D datasets. When visualizing a volume dataset using indirect volume rendering, a surface of interest must be segmented and extracted. This results either in an explicit or an implicit representation to be rendered. Explicit representations consist of a polygon mesh (triangle mesh), which adjusts to the shape of the surface. Since graphics cards are optimized for handling triangle data, explicit representations are easy to render. On the other hand, a high level of detail in the final image can only be achieved by increasing the number of triangles comprising the mesh, thus producing a growth in the storage and communication requirements. An alternative to these dense triangle meshes are implicit surface representations. Despite their high accuracy and their flexibility for being combined and deformed [SH97], implicit surfaces are usually neither the first choice for iso-surface encoding nor for modeling applications. This is mainly due to the difficulties they present to achieving interactive visualization and to mapping 2D textures onto them [Can99]. Most approaches to implicit surface visualization perform either a polygonization step or a direct ray tracing of the surface. Unfortunately, in general, neither of these rendering strategies can provide real time visualization of
Coarse Mesh
Implicit Surface Encoder
Oversampling
DFT
Power Spectrum Analysis
Viewer
Medial Axis Extraction Volume Data
Implict Surface (Slices)
Sampling
Sampling Frequency
Low Pass Filter
Disp. Maps (Slices)
Displacement Maps Generator
Implicit Surface Slices
Disp.Map Slices
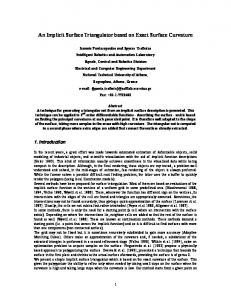
Figure 2: Displacement Maps Generation Flowchart Figure 1: General Processing Flowchart the implicit surface. In this study we propose an alternative approach based on the use of displacement maps in order to accelerate the rendering process and to reduce the communication requirements between the CPU and the graphics pipeline. This way we can benefit of the advantages of implicit surfaces, while minimizing the problems inherent to their visualization. In the following section we describe the main aspects of our proposal, as well as some implementation remarks. The obtained results are then presented in Section 3. Finally, our conclusions are pointed out in Section 4.
2. VISUALIZATION WITH DISPLACEMENT MAPPING The idea of combining an implicit surface representation together with displacement mapping was introduced by Sclaroff and Pentland in [SP91]. They employ an implicit representation based on the free vibration modes of real objects and use displacement maps as a way to further generalize the class of implicit functions. This allows that a much wider group of surfaces can be described with their generalized implicit surfaces. In this work we also focus on the combination of implicit surfaces with displacement mapping but oriented to visualization purposes. Following the overall structure of the computation strategy is outlined. As shown in Figure 1, the computing scheme comprises three main stages: an Implicit Surface Encoder, a Displacement Maps Generator and a Viewer. The most relevant details about each of these modules are presented below.
2.1
Implicit Surface Encoder
Among the different implicit surface representations available, we have chosen that proposed by Lebor´an et al. in [LDP03], which is based on the natural neighbors interpolation method. It produces a representation consisting on a set of slices, where each value in
a slice corresponds to a position in 3D space, being the value the shortest distance from that point to the iso-surface. Although this representation is not specially compact, it has several advantages like being well suited for the further generation of the displacement maps, as will be seen in the next processing stage.
2.2
Displacement Maps Generator
The generation of the displacement maps constitutes the central task in our implementation. In this processing stage, the implicit surface representation generated by the Implicit Surface Encoder must be converted into an appropriate set of scalar values which, once applied as displacements to a certain coarse mesh, reproduce the shape of the original iso-surface. In this work we use a set of anatomical models of tubular bones (such as tibia, femur or fibula) as a proof-of-concept, while more general cases are planned to be studied in future work. Given the characteristic shape of tubular bones, they are well suited for being represented as manifold cylindrical surfaces. Therefore we employ a cylinder model as base mesh for the displacement mapping. This way we compute the displacement maps relative to a cylinder coarse mesh centered in the medial axis of the real object. The flow diagram of the computation of these displacement maps is outlined in Figure 2. Following we detail the main functionality of these modules. Medial Axis Extraction In the initial stage, the Medial Axis Extraction, the centerline of the object (typically a tubular bone) is extracted. This centerline is determined by the most interior point in the implicitly encoded slices. Since in our implicit representation each value in a slice represents the distance to the surface, the centerline is directly specified by the minimum value in the implicit surface. Given that we are working with tubular objects, we can use this medial axis on each slice as a start point from which we can compute the corresponding
displacement map. In this case the displacement maps can be characterized by a set of rays starting at the medial axis position, pointing toward the exterior of the surface. Since we use a cylinder mesh centered on the medial axis as base for applying the displacement maps, these rays are inherently orthogonal to the surface, thus guaranteeing the right direction for the displacement. Oversampling The problem of selecting a correct sampling frequency is highly dependent on how abruptly the contour of the surface changes. Rapid changes in the contour require higher sampling frequencies to assure a correct reconstruction of the surface. Therefore we perform an oversampling by tracing many rays from the medial axis position to find intersections with the surface. For tracing these rays we use the 2D Bresenham line drawing algorithm [Bre65] slice by slice until the whole volume has been completed. Following this oversampling stage, we compute the Discrete Fourier Transform (DFT) of the signal (see Figure 2). The motivation for this is to find the Nyquist frequency (fN yq ), this is the cutoff frequency above which a signal must be sampled in order to be able to fully reconstruct it. Typically the signals we work with should be band-limited, since the surface contours are quite smooth, which avoids the presence of very high frequencies. However, we experienced that the presence of noise in the volume, characteristic for CT and MRI datasets, produces high frequency components, which can convert our signal into a non-band-limited one. Therefore we must low-pass filter the signal to remove this high frequency noise. In order to decide at which frequency the signal should be cut off, we analyze the power spectrum. Power Spectrum and Low Pass Filter The power spectrum gives a plot of the portion of a signal’s power falling within given frequency bins. For noisy signals, the Fourier spectrum is quite difficult to analyze, while the power spectrum still can give an intuitive and often more accurate idea of the amount of information present in every frequency bin. After studying the power spectrum of several test datasets, we decided to filter the signal in such a way, that at least the 99% of the signal’s power is preserved. Thus at the output of the low-pass filter in Figure 2, we obtain the desired sampling frequency, which is then passed to the sampler module in order to produce the displacement maps.
2.3
Viewer
Finally the computed displacement maps and the coarse triangle base mesh must be combined in or-
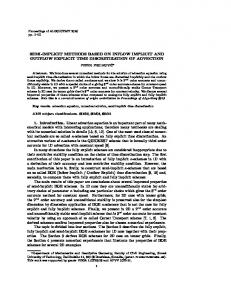
(a) ASC
(b) Imp. Function + Disp. Maps
Figure 3: Image Quality Comparison (slightly different viewing angles) der to visualize the iso-surface encoded in the implicit function. For this last step we rely on the open source available QGLViewer as visualization framework. With this framework as a basis, the displacement maps are applied to the proper cylinder mesh using a software simulation of the method described by B´oo et al. in [BAD+ 01].
3. RESULTS We have made a software implementation of the proposed method leading to an analysis attending to two main aspects: communication requirements and image quality. For carrying out this study we have used a set of medical data corresponding to models of tubular bones. In order to examine the quality of our proposal in terms of amount of information to be transferred from the CPU to the graphics pipeline, we have compared our measurements with an implementation of the Adaptive Skeleton Climbing (ASC) method [PWH98]. The ASC algorithm provides a direct and explicit extraction of the surface of interest, which results in a much more compact representation (from 4 to 25 times less triangles) than with a standard Marching Cubes strategy. By applying both algorithms to a set of tubular bone datasets, we have obtained that the use of our method saves, on average, around a 45% in terms of communication requirements. For the measurement of these data, the use of triangle strips has been considered. This optimizes the transfer of the triangle meshes both for the fine mesh of the ASC method and for the base mesh to be displaced in our proposal. Specifically, we use the construction of strips presented by Evans et al. in [ESV96], where each vertex of the mesh is sent to the graphics pipeline 2.5 times on average1 . An illustrative example of the results obtained with both methods is presented in Figure 3. These images correspond to a real tibia dataset. For this concrete example, the triangulated model in Figure 3(a) comprises 13500 triangles and 6500 vertices, which means 1 Floating point accuracy is employed for the encoding of the position, normal and texture values per vertex in the mesh, as well as for each scalar value in the displacement map. This results in 32 Bytes per vertex and 4 Bytes per displacement value.
507.81 KBytes to be sent from the CPU to the graphics pipeline. On the other hand, using our method (see Figure 3(b)), only 102.47 KBytes had to be transferred through the bus. From these, 8.59 KBytes correspond to the coarse mesh (200 triangles and 110 vertices), while 93.87 KBytes are relative to the displacement map (90 × 267 values). This means a reduction of almost 80% in the communication requirements. Another important factor for the evaluation of the proposal is the quality achieved. Examining the images in Figure 3 we can state that with the procedure we propose, the quality of the visualization is equivalent, if not better, to that obtained with an explicit triangulation of the implicit surface. Thus the trade-off between bus load and image quality clearly demonstrates the benefits of the presented approach.
5. ACKNOWLEDGEMENTS This work was partially supported by the DFG project VIRTUE (Germany), by the Ministry of Science and Technology of Spain under contract MCYTFEDER TIC2001-3694-C02-01 and by the Secretar´ıa Xeral I+D of Galicia (Spain) under contract PGIDIT03TIC10502PR.
6. REFERENCES [BAD+ 01] M. B´oo, M. Amor, M. Doggett, J. Hirche, and W. Strasser. Hardware Support for Adaptive Subdivision Surface Rendering. In SIGGRAPH/Eurographics Hardware Workshop, pages 33–40, 2001. [Bre65] J.E. Bresenham. Algorithms for Computer Control of a Digital Plotter. IBM Systems Journals, 4(1):25–30, 1965.
Finally it should be noted that these results correspond to a preliminary version of the algorithm, where a quite restrictive case (tubular bone structures) has been analyzed. Further improvements and extensions can be considered in order to obtain a more complete evaluation of the method. However, the quality of these preliminary results constitutes an evidence of the capabilities that this new visualization strategy presents.
[Can99] M. Cani. Implicit Representations in Computer Animation: A Compared Study. In Implicit Surfaces ’99, Sep. 1999.
4. CONCLUSIONS
[ESV96] F. Evans, S. Skiena, and A. Varshney. Optimizing Triangle Strips for Fast Rendering. In IEEE Visualization’96, pages 319–326, 1996.
In this paper we have presented a new method for volume visualization that can be applied to indirect volume rendering applications, based on the combination of implicit surface models with displacement mapping.
[LDP03] V. Lebor´an, R. Dosil, and X.M. Pardo. Smooth Surface Reconstruction from Points and Normals using Implicit Surfaces. In CEIG’2003, pages 203–216, July 2003.
The use of displacement maps to encode the fine details of the surface allows noticeable savings in the load on the bus between the CPU and the graphics pipeline, alleviating a possible bottleneck in the rendering process. The computation of the displacement maps can be done in a simple and efficient way. By employing the well known Bresenham algorithm for drawing lines in 2D, we obtain a suitable sampling of the implicit surface. The whole sampling process is automated using a DFT analysis of the data.
[Mat02] Matrox. Hardware Displacement Mapping. Matrox Parhelia White Paper, 2002. http://www.matrox.com.
Hardware application of displacement mapping, as well as subdivision of the coarse mesh can be performed within the graphics pipeline [Mat02; DH00; BAD+ 01; SGP03], thus accelerating the rendering with a clear benefit for our proposal. The preliminary application to visualization of real medical data (specifically tubular bone models) has proved the validity of the method encouraging further extensions of the strategy. This opens many new possibilities for the use of implicit surfaces not only for modeling but also for visualization purposes.
[DH00] M. Doggett and J. Hirche. Adaptive View Dependent Tessellation of Displacement Maps. In SIGGRAPH/Eurographics Hardware Workshop, pages 59–66, 2000.
[PWH98] T Poston, T-T. Wong, and P-H. Heng. Multiresolution Isosurface Extraction with Adaptive Skeleton Climbing. In Computer Graphics Forum, EuroGraphics’98 issue, volume 17(3), pages 137– 148, 1998. [SGP03] L.-J. Shiue, V. Goel, and J. Peters. Mesh Mutation in Programmable Graphics Hardware. In SIGGRAPH/Eurographics Hardware Workshop, pages 15–24, 2003. [SH97] B.T. Sander and J.C. Hart. Guaranteeing the Topology of an Implicit Surface Polygonization for Interactive Modelling. In Computer Graphics Proceedings, ACM/SIGGRAPH, pages 279–286, 1997. [SP91] S. Sclaroff and A. Pentland. Generalized Implicit Functions for Computer Graphics. In Computer Graphics (Proceedings of SIGGRAPH ’91), volume 25, pages 247–250, July 1991.