VRML
TerraVision II: Visualizing Massive Terrain Databases in VRML R
esearchers have increasingly turned to Virtual Reality Modeling Language (VRML) to represent geographic spatial data over the Web, information. In VRML’s early days, we designed massive terrain the result was a few toy examples that did not scale well, such as coarse, single-resolution elevation data sets accessible through grids. Today, VRML is drawing more serious interest from researchers either a VRML browser or across the spectrum, including geographers, cartographers, geologists, the customized TerraVision and computer scientists, as the sidebar “Related Work” describes. As II browser. Theresa-Marie Rhyne noted, geographic information system (GIS) and scientific visualization tools have begun to expand into each other’s
To disseminate 3D maps and
Martin Reddy, Yvan Leclerc, Lee Iverson, and Nat Bletter SRI International
domains,1 and VRML offers cartographers and geographers the potential to disseminate 3D maps and spatial data over the World Wide Web. However, to date we have not seen useful large-scale VRML geographic databases. We aim to enable visualization of near photorealistic 3D models of terrain that can be on the order of hundreds of gigabytes. This might include different types of terrain imagery for particular regions, as well as site models and auxiliary information for ground features. The following scenario indicates the capabilities required. Say a user wants to find a particular building in a particular city. Her journey begins with a 3D model of the earth viewed from space. This model is texturemapped with satellite imagery of 100 kilometers resolution—that is, each pixel in the texture map represents a region on the planet’s surface covering 100 km2. To find the city, the user first rotates the earth to view the
Related Work Currently, interesting and significant work addresses the problem of representing geographic data in VRML. In the earth sciences, Kate Moore described the work of the Virtual Field Course (VFC) project,1 which is developing software tools to familiarize students with fieldwork locations and aid data collection and analysis. The VFC project uses VRML and Java to provide interactive 2D and 3D views of geo-referenced data to enhance students’ cognition of the real environment. The US Naval Postgraduate School is currently working on a project to develop a 3D model of the Monterey Bay National Marine Sanctuary. They aim to create a VRML representation of the sanctuary based on raw bathymetry (below sea level) data for a 2.5 × 2.5 degree region of the bay. Their representation uses multiresolution techniques to deliver these large data amounts over a 28K modem connection.
30
March/April 1999
Michael Abernathy and Sam Shaw described their work using VRML to visualize the course for a 197-mile relay race through the San Francisco Bay Area.2 They did this using standard US Geological Survey (USGS) 7.5 arc min digital elevation models (DEMs) for the terrain geometry with georeferenced satellite imagery draped over the terrain. Their system also used Global Positioning System (GPS) input to create a line segment showing the race’s course over the VRML terrain.
References 1. K. Moore, “Interactive Virtual Environments for Fieldwork,” British Cartographic Society Annual Symp., 1997; available at http://www.geog.le.ac.uk/mek/VirtEnv.htm. 2. M. Abernathy and S. Shaw, “Integrating Geographic Information in VRML Models,” Proc. Third Symp. VRML, ACM New York, 1998, pp. 107-114.
0272-1716/99/$10.00 © 1999 IEEE
target region in more detail. As she zooms into the region, higher resolution data, such as elevation and imagery, are progressively downloaded and displayed until she is “flying” over mountains with imagery down to one-meter resolution. Over certain parts of the terrain, alternative imageries are available, such as aerial photographs; the user can select any image to view on top of the terrain geometry. As she approaches a builtup area, 3D models of buildings come into view. When the user clicks on a building, information about it is displayed in a separate frame on the browser. Using this method, the user locates the target building. Throughout the navigation, the user’s location is displayed via an active map interface that provides a context for the landscape being viewed. In setting out to achieve such capabilities, we identified four principal design criteria: ■ Scalability. Our design must scale to very large data
sets. Commonly, a geographic data set consists of many millions of polygons and many gigabytes of imagery. ■ Composability. Our data representation must allow the introduction of multiple types of geo-referenced data, including additional imagery, site models, cultural features, and annotations. It also must let the user switch between these on demand. ■ Efficiency. Users must be able to navigate the VRML structures easily and efficiently using a standard VRML browser or a customized browser that further increases browsing efficiency. ■ Data interchange. We must develop generic data representations for geo-referenced data in VRML. This will let other geographic data providers produce data using the same representation. Guided by these requirements, we implemented this functionality in a standard VRML browser for downloading data over the World Wide Web. We also developed a custom terrain visualization package called TerraVision II that can browse these VRML data structures. Although not required to view the content, TerraVision II lets the user perform specialized browserlevel optimizations that offer increased efficiency and seamless interaction with the terrain data. We designed our framework to simplify terrain data maintenance and to let users dynamically select particular sets of geo-referenced data. Our implementation uses Java scripting to extend VRML’s base functionality and the External Authoring Interface to offer application-specific management of the virtual geographic environment. To help develop standard techniques for solving geographical representation problems in VRML, coauthor Lee Iverson formed and currently chairs the GeoVRML group, an official Working Group of the Web3D Consortium (http://www.ai.sri.com/geovrml). As a service to the VRML community and the GeoVRML effort, we have made freely available both the TerraVision II browser and all of the tools we developed for generating VRML terrain data sets. This includes the source code to all of our custom VRML nodes and the tsmApi library that we use to generate the VRML data sets. The library is described in
the sidebar “The tsmApi Library” and is available along with other materials and several example VRML data sets at http://www.ai.sri.com/TerraVision.
Multiresolution terrain techniques Terrain models are typically massive. For example, the US Geological Survey produces digital elevation models (DEMs) that contain a regular grid of 1,201 × 1,201 elevation values for a 1-degree area of the earth’s surface. Producing a simple polygonal representation of a single DEM creates a model with more than 1.4 million polygons. The time required to download and render such a model would prohibit any real-time interaction using the current generation of VRML browsers. It therefore becomes essential to manage level of detail (LOD). LOD techniques change a model’s complexity based on some selection criteria, such as distance from the viewpoint or projected screen size. The basic premise for these criteria is that any distant detail that projects to less than a single pixel on the screen will not generally be visible. To implement this, we need a mechanism to simplify a data set’s geometry and imagery. Several polygon simplification algorithms work well for terrain. However, many of these are view-independent techniques that force the same degree of simplification across the entire terrain.2,3 These are
The tsmApi Library The Tile Set Manager Application Program Interface (tsmApi) is a freely available C library from SRI International. The library offers functions for reading, writing, and generating terrain data used by TerraVision II, including functions for generating VRML versions of the terrain data using the representations we describe in the article. Using the tsmApi library, users can create their own VRML geographic data sets from several supported input formats such as raw imagery, Portable Bitmap (PBM) images, and Land Analysis System (LAS) bitmaps. The library also includes SRI’s fully re-entrant VRML 97 parser, which can be used to parse VRML 97 files efficiently into memory and to write these structures back out to a VRML 97 file. Other functions perform transformations between various geographic coordinate systems, such as Univeral Transverse Mercator (UTM), geodetic (latitude/longitude), and earth-fixed geocentric, based on code from the US National Imagery and Mapping Agency’s Nimamuse product. Precompiled tsmApi distributions are available for Irix, Solaris, Linux, and other platforms. In addition, the full C source code is available from the tsmApi home page, which also includes full API documentation, tutorials, format specifications, and example source code. The tsmApi Web page is at http://www.ai.sri.com/ tsmApi.
IEEE Computer Graphics and Applications
31
VRML
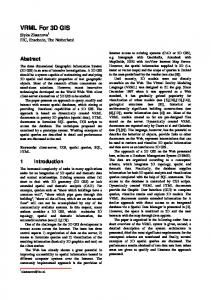
1 An example image pyramid showing (a) four different resolutions of an original image, where each level is segmented into 128 × 128 pixel tiles, and (b) how this structure can be used to alter the image resolution in different regions. (a)
inappropriate for our application because switching to the highest resolution still involves loading every point of the original data set. Instead, we require a viewdependent technique that lets us vary the degree of simplification with respect to the current viewpoint.4,5 This is often done using a hierarchical data structure, such as a quad-tree. Further, the LOD algorithm must not require access to the entire high-resolution version of the data set, as that would limit us to viewing only data sets that can fit on the user’s local storage system. Given these requirements, a tiled, pyramid representation best suits our needs.6-8 A pyramid is a multiresolution hierarchy for a data set. For example, if the original image is 1024 × 1024 pixels, then the pyramid might contain the original image along with down-sampled versions at resolutions of 512 × 512 pixels, 256 × 256 pixels, 128 × 128 pixels, and so on. As Figure 1a shows, each pyramid image is then segmented into rectangular tiles, where all tiles have the same pixel dimensions. A tile at a given pyramid level will thus map onto four tiles on the next high-
(b)
er level; that is, at each higher resolution area, the tiles cover half the geographical area of the previous level. Using this representation, we can recursively resolve certain data set regions in more detail than other regions. For example, Figure 1b shows the lower-right corner in high resolution with the surrounding regions displayed in progressively lower resolution. Assuming a tile size of 128 × 128 pixels, this example requires downloading and rendering only 491 Kbytes (10 tiles) instead of the entire 3.1-Mbyte high-resolution image. If the user’s location is the bottom-right corner, then distant imagery is rendered at lower resolution than near imagery and we have achieved distance-based LOD. As Figure 2 shows, our image pyramids techniques can be applied to elevation grids and other types of terrain data. Because we use a tiled pyramid representation for the geometry and the imagery, we can optimize the amount of data transferred over the network, the number of polygons in the scene, and the amount of memory required for texture maps. As a result, we need only fetch and display data for the region that the user is viewing, and only at a sufficient resolution for the user’s viewpoint. This solution scales well to arbitrarily large data sets because it effectively attempts to keep the polygon count constant for any viewpoint.
Multiresolution data in VRML 2 Using a tiled
We introduce four types of VRML files to represent a large, tiled multiresolution hierarchy of the globe: terrain tile files, feature files, geotile files, and tree files. Figure 3 shows these files and their relationships. The tree files recursively implement the LOD hierarchy by inlining a single geotile file at one LOD and four higher resolution tree files at the next LOD. The geotile file inlines all of the feature and terrain tiles that cover a geographical area and LOD. A terrain tile file contains the actual elevation and image texture data for a given image, geographical area, and LOD. Feature files describe a geographical area’s objects, such as buildings and roads. We discuss these relationships and their advantages below.
pyramid structure to represent terrain geometry. Closer terrain is represented in higher fidelity (more polygons) than distant terrain.
32
March/April 1999
3 The relationship between tree, geotile, terrain tile, and feature files. Unidirectional arcs represent inline links to files over the network. Bold rectangles delineate file boundaries.
A tree file
Hierarchy of GeoTile files
Two terrain tile pyramids
Tree files Tree files implement part of the multiresolution hierarchy for the entire globe. In effect, these files are the glue that holds the geotiles in the quad-tree structure. A tree file initially loads a single geotile, but when the user approaches the tile, it’s replaced with four higher-resolution tree files, which in turn inline the geotiles for the four quad-tree children. (At the bottom level of the tree hierarchy, the four geotiles are inlined directly.) The hierarchy of tree files must be generated only once and won’t generally need to be modified further—except perhaps to extend the tree for higher resolutions at a later juncture. In the future, it might be possible to generate tree files on the fly. The tree files let us split the entire LOD hierarchy over multiple files and abstract the LOD structure from the actual terrain data. They also let us create a different LOD tree depth for different global regions. For example, we could have 100-km-resolution data for the entire globe but recursively insert higher resolution data for smaller regions of interest, such as a one-kmresolution data set for the conterminous United States and a one-m-resolution data set for Yosemite Valley, California. It would be possible to use the VRML Inline node to include the geotile files into the LOD hierarchy. However, VRML 97 does not specify when the Universal Resource Locator (URL) of an Inline node should be loaded, making this a browser-dependent feature. Currently, most browsers load all inline scenes at once. This makes good sense for small scenes with a handful of Inline nodes. However, if we have a data set of 10 Gbytes, the VRML browser will attempt to load all these data into memory at once. This is obviously unacceptable for our application, so we must control when inline files are loaded and unloaded. To do this, we developed
A feature file
a new node, called QuadLOD, using VRML 97’s EXTERNPROTO and scripting features. QuadLOD provides a terrain-specific LOD capability that efficiently manages the loading and unloading of higher levels of detail. When the user enters a certain volume around the tile (determined by a ProximitySensor) QuadLOD loads only a tile’s four higher resolution children. The node also uses a tile-caching mechanism so that tiles aren’t needlessly reloaded. When the user approaches a region of terrain, more detail is progressively loaded and displayed in a coarse-to-fine fashion. Most VRML browsers perform nonblocking network reads so that the user can still interact with the scene while higher resolution imagery and elevation loads.
Geotile files Geotile files contain links to all data within a single tile. The most basic geotile includes a single terrain tile file for the region. However, it’s possible for a geotile to store links to multiple alternative terrain tiles, such as tiles referring to satellite, aerial, and map imagery, as well as feature files for objects that exist on the terrain, such as buildings, roads, and annotations. By adding this extra layer to our global structure, we simplify the task of maintaining and adding new data sets. For example, when we want to add a new image pyramid, we can generate the terrain tiles in isolation and simply link them to appropriate geotiles. (If the new data set requires higher resolution than the region previously required, we also must generate new tree files.) In addition, because each data set is stored independently and referenced only via the geotiles, we can selectively display any combination of data sets. A node we created, GeoTile, permits this selectivity by organizing the terrain tile and feature file links into sets of Switch nodes.
IEEE Computer Graphics and Applications
33
VRML
ly within that tile. Another solution is to simply include a link to the same feature in all relevant geotiles. We selected the latter approach because it does not constrain the cultural features to the same resolution range as the terrain, and it requires no modification to the feature’s geometry. However, one problem is that the browser would normally load, store, and render duplicate copies of each feature for every loaded geotile in which it occurs. To avoid this, we have designed our GeoTile node so that it keeps track of each request for a feature file’s URL. We do this using static class structures in a Java script. We load feature files only on first invocation, incrementing their reference count, and unload a feature file only when its reference count returns to zero. Figure 4 shows the fusion of terrain data and cultural features that results.
Geographic coordinate systems
4 A tiled terrain model showing geo-referenced 3D geometry overlaid for roads (orange) and buildings (yellow).
Terrain tile files Terrain tiles contain the actual terrain data for a single data set tile at a particular detail level. This includes the elevation geometry and the texture map imagery for the specific terrain tile. The VRML 97 specification provides us with two potential primitives for representing terrain geometry: the IndexedFaceSet and the ElevationGrid. The latter node lets the user specify a grid of height values above the x-z plane, whereas the more general IndexedFaceSet node lets the user define arbitrary polygons in 3D space. VRML 97’s ElevationGrid was introduced specifically to represent terrain models and offers a compact mechanism to describe simple height field data. However, it has serious limitations that prevent us from using it, including that it assumes that the heights are relative to a flat plane— an obvious problem when dealing with curved planets. ElevationGrids are thus useful only for modeling local areas, where the earth’s curvature is insignificant. Because we want to support global data sets, we use the IndexedFaceSet to build terrain geometry.
Feature files Feature files contain VRML models for objects related to a region of terrain. Examples include a region’s cultural features, such as roads and lines of communication; weather simulations, such as clear air turbulence isosurfaces and wind vectors; and other 3D data, such as terrain annotations. Integrating terrain features proves difficult because features can extend beyond tile boundaries. For example, a road might cover multiple tiles, or a large building might sit on the boundary between two tiles. One way to deal with this problem is to dissect the geometry for all ground features along tile boundaries, forcing the condition that all features in a tile are contained entire-
34
March/April 1999
VRML defines a Cartesian coordinate system for modeling objects in a 3D volume. In geographic terms, this gives us a geocentric representation: a coordinate (x, y, z) is assumed to be a 3D offset (in meters) from the earth’s center. However, most elevation data are provided in some geodetic or projective coordinate system. A geodetic coordinate system is related to the ellipsoid used to model the earth (such as the latitude-longitude system). A projective coordinate system projects the ellipsoid onto some simple surface, such as a cone or a cylinder. Examples include the Lambert Conformal Conic or the Universal Transverse Mercator projections. Such coordinate systems were designed for different applications and offer particular advantages and restrictions. For example, some projections can represent only small-scale regions; others are conformal, offering the same scale in every direction; and others can be equal area—the projected area corresponds to the earth’s physical area over the entire projection. To use data in these different coordinate systems, we must convert coordinates in these systems into the VRML geocentric coordinate system. Descriptions for performing many of these transformations are available elsewhere.9 The sidebar “What Shape Is the Earth?” discusses related representation challenges.
Floating-point precision issues The VRML 97 specification defines the SFFloat and MFloat fields to represent floating-point numbers. However, these are only single-precision values; the dynamic range of a single-precision floating-point number isn’t sufficient to store accurate geocentric coordinates. For example, the IEEE single-precision format defines a 23bit mantissa. This provides a resolution of approximately six digits (223 = 8.39 × 10⁶). The earth’s diameter is roughly 12,700,000m, and thus we can model terrain to an accuracy of only tens or hundreds of meters. This accuracy can’t even represent the results from a civilian-grade Global Positioning System (GPS), let alone faithfully represent ground features such as buildings or roads. Most VRML browsers use only single-precision arithmetic for modeling and matrix operations, and most modern graphics hardware uses only single precision. We must therefore implement accurate geocentric coor-
What Shape Is the Earth? In a computer graphics system, the simplest way to represent the earth is to produce a sphere and then apply to it a texture map. This method is adequate for a coarse representation. However, if we want to model the planet down to submeter accuracy, we must better understand the earth’s shape and the coordinate systems that describe it.1-3
b
Ellipsoids The earth can best be modeled geometrically using an ellipsoid of rotation. Such an ellipsoid is traditionally specified by two of three variables: the semi-major axis (a), the semi-minor axis (b), and the inverse flattening (1/f = a / (a − b)). Over the past 200 years, many different reference ellipsoids have been formulated, each defining slightly different values for these variables. The current US Department of Defense standard is defined by the World Geodetic System 1984 (WGS84), such that a = 6378137.0m and b = 6356752.3142m.
a
Equator
Geoids The ellipsoid describes an ideal surface, but most elevation data are given relative to the geoid, not the ellipsoid. The geoid is the physically measurable surface corresponding to mean sea level and is related to the earth’s gravitational field. This complex, undulating surface varies marginally from the ellipsoid over a range of roughly 100m. Once again, there are several slightly different geoid standards, such as GEOID90, OSU89B, and WGS84.
Datums A datum specifies a local or global reference coordinate system for defining points on the earth; these are called the horizontal datum and the vertical datum. The horizontal datum specifies the coordinate system used to localize points on the earth’s surface. It’s typically specified by a reference point on the planet, the azimuth of a line from that point, and a reference ellipsoid. There are literally hundreds of horizontal datums in common usage. Practically all of these are local in their extent, such as the Ordnance Survey Great Britain 1936 datum or the Australian Geodetic 1984 datum. However, the WGS84 defines a global datum that is generally accepted as the most accurate definition now in use.
dinates using only single-precision data. We can do this using a network of local coordinate systems (LCSs), where the value range in any LCS lies within a singleprecision value. Thus, all of these LCSs can be transformed into a viewpoint-dependent view coordinate system in real time. Using this approach, we can specify geocentric coor-
Terrain surface
Geoid Ellipsoid
The vertical datum is the surface from which all elevation values are measured. This is typically taken as mean sea level—that is, the geoid.
References 1. J.P. Snyder, “Map Projections—A Working Manual,” US Geological Survey Professional Paper 1395, US Government Printing Office, Washington, DC, 1987. 2. P.A. Birkel, “Sedris Geospatial Reference Model,” Sedris Document Set, June 10, 1997. Available electronically at http://www.sedris.org/wp_dlds.htm. 3. “Handbook for Transformation of Datums, Projections, Grids and Common Coordinate Systems,” Tech. Report TEC-SR-7, US Army Corps of Engineers, Topographic Engineering Center, Alexandria, Va., Jan. 1996.
dinates to millimeter accuracy across the earth’s surface. Also, it lets us store and transmit single-precision coordinates, rather than double-precision values.
Browsing the world in VRML Users can browse the terrain data produced by our representation using a standard VRML plug-in for Internet
IEEE Computer Graphics and Applications
35
VRML
5 Screenshot of the TerraVision system.
browsers such as Netscape Communicator or Microsoft Internet Explorer. We now describe some of the relevant user-interaction issues related to VRML browsers.
Switching data sets One of our goals is to let users switch between various image data sets and terrain features. Letting users switch the texture map for a single polygon in VRML is a trivial exercise. However, elegantly making such a switch in a complex pyramidal structure using Script nodes inside the VRML scene proves more difficult. We thus turn to the External Authoring Interface (EAI), which lets us write a Java applet that runs in the Internet browser and communicates with the VRML plug-in. Through this interface, we can traverse the scene graph of the loaded terrain and modify the switch node settings in each geotile file, thus selecting different data sets. One complication is that the EAI does not currently let users access the scene graph loaded by an Inline node. However, because we have implemented our own Inline nodes, we can also implement an extra eventOut, called children, that exposes the inlined VRML file. We are thus free to inspect and modify any part of the VRML scene.
Navigation issues The VRML standard defines three default navigation types: walk, examine, and fly. These types are useful as generic navigation models; however, we introduce several specialized functions to help users navigate a large geographic database. ■ Terrain following. Because the earth is round, as we
navigate its surface we should expect to follow a curved flight path. However, the defaults such as walk and fly propel users along a linear flight path only. We want a navigation method that will maintain a particular
36
March/April 1999
height above the earth’s surface. To achieve this, we must know the up vector for a particular region of terrain—that is, the 3D normal to the plane that is tangent to the earth’s surface at that region. VRML implicitly assumes that the y-axis is up, but when dealing with a round surface, the actual vector varies. ■ Altitude-based velocity. Users’ navigation velocity should depend on their location relative to the terrain. For example, when flying through a valley at a height of 100m, a velocity of 100m/s could be considered relatively fast. However, if the user were viewing the entire globe from space at an altitude of 20,000 km, zooming in at the same speed would be painfully slow. We must therefore scale navigation velocity to achieve a constant pixel flow across the screen. ■ Active maps. When flying over terrain, it’s often difficult for users to maintain a global context for their position. We thus employ a map display, managed by a Java applet. Through the EAI, we can obtain the user location in the geographic environment. We might do this, for example, using the position_changed eventOut of a ProximitySensor placed around the entire scene. We can then project this 3D geocentric coordinate onto the map display so users can easily ascertain their location in the world. Users can also click over the map and then move the viewpoint directly to that location. We do this by updating and binding a Viewpoint node in the VRML scene graph.
Browsing the world in TerraVision Figure 5 shows TerraVision II, a real-time, distributed terrain visualization system that we have been developing over the past five years.8 TerraVision was designed to enable interactive visualization of massive terrain databases that can be distributed over a high-speed wide-area network. TerraVision I was developed as part
of the US Defense Advanced Research Projects Agency’s Multidimensional Applications Gigabit Internet Consortium (Magic) project and has been demonstrated with data sets on the order of tens of Gbytes. TerraVision includes features such as an active map display, 2D pan and zoom display, 3D flythroughs, and time-of-day and fog selection. It also incorporates building models and vehicles, animates vehicles based on live or recorded GPS data, and supports 6-degrees-of-freedom input devices and head-mounted displays. Generic VRML browsers cannot perform terrain-specific optimizations because they have no knowledge of the underlying data’s representation and application. TerraVision II extends TerraVision I functionality by supporting our VRML 97 representations. In effect, it’s a custom VRML browser specifically designed to optimally navigate our VRML terrain databases. TerraVision II offers the following advantages over a standard VRML browser: ■ Optimized, compiled code. TerraVision II is a multi-
■
■
■
■
■
threaded application written in ANSI C. We designed it for the sole purpose of rendering large geographic databases in real time. As such, we can use more efficient, optimized solutions to several generic real-time graphics operations. For example, visibility culling is performed using a fast quad-tree search of the multiresolution hierarchy. Level of detail. The LOD selection in the VRML browser is based on whether or not a user is in a volume around the tile. However, TerraVision uses projected screen size to decide when to reduce terrain detail. This technique considers such factors as display size and the angle at which the user views the terrain. Tile stitching. Any tiled, multiresolution representation suffers from tearing problems. These occur when adjacent tiles of different resolution do not share all the same vertices and thus create holes in the terrain along tile boundaries. In TerraVision, we use specialized techniques to stitch these holes, so it displays a continuous landform. A standard VRML browser will not generally perform this operation. Network lag tolerance. TerraVision always maintains in memory a low-resolution terrain representation and uses a progressive coarse-to-fine algorithm to load and display new data. Therefore, if some highresolution tiles have yet to arrive over the network, TerraVision simply uses the highest resolution data it has so that the user can continue to interact with the terrain. In effect, TerraVision implements a basic form of streaming for both geometry and imagery. Efficient tile caching. TerraVision maintains a tile cache, which eliminates the need to reload and parse data for terrain regions that the user has recently browsed. Prediction and prefetching. TerraVision attempts to predict users’ future moves by a simple extrapolation of their current flight path. It then prefetches tiles, so they are immediately available for rendering.
TerraVision II is not required to view the VRML terrain data sets; it simply increases browsing efficiency.
Any standard VRML browser can interact with these data. However, TerraVision II introduces an attractive scalability feature to terrain data set navigation. TerraVision II can be implemented on a graphics workstation connected to a gigabit-per-second ATM network with high-speed disk servers for fast response times. However, TerraVision can also be implemented on a PC connected to the Internet, or a standard VRML browser on a laptop machine can be used to browse the same data. This makes the system particularly useful in military mission planning and battle damage assessment, emergency relief efforts, and other distributed time-critical conditions.
Conclusions and future work As we show here, it’s possible to represent massive, distributed terrain databases in VRML. It’s also possible for users to navigate efficiently around these structures using either a standard VRML browser or our specialized TerraVision II browser. In the future, we might apply or extend this work in several ways. ■ Distributed interactive simulation (DIS). The Java-DIS-
VRML working group is working on ways to let users share state information about a VRML world—such as entity positions and orientations—across a network. This is highly relevant to our work, as it would let us introduce dynamic entities, such as moving vehicles, which multiple users could experience simultaneously over the network. ■ Data on demand. Currently, we statically generate all required terrain data offline in VRML format. However, it’s possible to transparently generate all VRML data on the fly from some underlying geographic database. We might do this via a Common Gateway Interface script that interprets the URL path name as a database lookup request and generates the VRML representation on demand. ■ Other planets. Although we have concentrated on representing the earth, we could easily apply the design and concepts introduced here to model other celestial bodies. By making the work we describe here freely available, we hope to help foster further innovation and, through the GeoVRML Working Group, to see greater support for geographic applications in upcoming revisions of the VRML specification. ■
Acknowledgments We thank Kiril Vidimce for his work on the VRML nodes. Our work was funded in part under the following Darpa programs: Multidimensional Applications Gigabit Internet Consortium II, subcontract 12165SRI of contract F19628-95-C-0215, and Battle Assessment and Data Dissemination contract no. MDA972-97C-0037. Darpa has approved this article for public release. Terrain imagery and elevation data were supplied by the US Geological Survey Earth Resources Observation System Data Center.
IEEE Computer Graphics and Applications
37
VRML
References 1. T.M. Rhyne, “Going Virtual With Geographic Information and Scientific Visualization,” Computers and Geosciences, Vol. 23, No. 4, 1997, pp. 489-491. 2. W.J. Schroeder, J.A. Zarge, and W.E. Lorensen, “Decimation of Triangle Meshes,” Proc. Siggraph 92, Addison Wesley Longman, Reading, Mass., 1992, pp. 65-70. 3. A. Guéziec et al., “Simplification Maps for Progressive Transmission of Polygonal Surfaces,” Proc. Third Symp. Virtual Reality Modeling Language, ACM, New York, 1998, pp. 25-31. 4. P. Lindstrom et al., “Real-Time Continuous Level of Detail Rendering of Height Fields,” Proc. Siggraph 92, Addison Wesley Longman, Reading, Mass., 1996, pp. 109-118. 5. H. Hoppe, “View-Dependent Refinement of Progressive Meshes,” Proc. Siggraph 92, Addison Wesley Longman, Reading, Mass., 1997, pp. 189-198 6. J.S. Falby et al., “NPSNet: Hierarchical Data Structures for Real-Time Three-Dimensional Visual Simulation,” Computers and Graphics, Vol. 17, No. 1, 1993, pp. 65-69. 7. L.E. Hitchner and M.W. McGreevy, “Methods for UserBased Reduction of Model Complexity for Virtual Planetary Exploration,” Proc. SPIE, Vol. 1913, Soc. Photo-optical Instrumentation Engineers, Bellingham, Wash., 1993, pp. 622-36. 8. Y.G. Leclerc and S.Q. Lau, “TerraVision: A Terrain Visualization System,” Tech. Note 540, AI Center, SRI International, Menlo Park, Calif.; available electronically at http://www.ai.sri.com/pubs/technotes/aic-tn1994:540/document.ps.gz. 9. J.P. Snyder, “Map Projections—A Working Manual,” US Geological Survey Professional Paper 1395, US Government Printing Office, Washington, DC, 1987.
Martin Reddy is a computer scientist in the Artificial Intelligence Center’s Perception Program at SRI International. His work focuses on the real-time display of massive 3D terrain databases distributed over wide-area networks. He received his BS in computer science from the University of Strathclyde and his PhD in computer graphics from the University of Edinburgh, Scotland.
38
March/April 1999
Yvan G. Leclerc is a senior computer scientist at SRI’s Artificial Intelligence Center, where he has worked since 1985 in various areas of computer vision. His recent work focuses on recovering the 3D shape and material property of objects from multiple calibrated images. He also works in high-speed, network-based terrain visualization systems and is currently a principal investigator on three Darpa projects. He received his BS, ME, and PhD degrees in electrical engineering from McGill University, Montreal.
Lee Iverson is a computer scientist at SRI’s Artificial Intelligence Center. His areas of interest include computer vision (especially edge detection, relaxation labeling, and stereo) and graphical environments for geographical information systems. He chairs the GeoVRML Working Group of the Web3D Consortium. He received his BEng from Princeton University and his ME and PhD from McGill University, Montreal.
Nat Bletter has been a research engineer working on SRI’s general virtual reality capabilities since 1992 and has implemented binaural sound, speech recognition, and graphic interfaces. He has also worked on data visualization, perceptual research, multiuser virtual reality systems, surgical simulation, force feedback, and motion sickness. He is the principal investigator on SRI’s Share collaborative virtual environment toolkit and has extensive experience in VR hardware and software, including interfacing input and output devices, graphics programming, and the human computer interface. Readers may contact Reddy at SRI International, 333 Ravenswood Avenue, Menlo Park, CA 94025, e-mail
[email protected].