DM STAT-1 CONSULTING 574 Flanders Drive North Woodmere, NY 11581 516.791.3544 fax 516.791.5075 1 800 DM STAT-1
BRUCE RATNER, PhD
[email protected] www.dmstat1.com
A Database Marketing Regression Model that Maximizes Cum Lift Bruce Ratner, Ph.D. Database Marketing (DM) regression models seek to maximize cum lift, a measure of model predictiveness of identifying the upper performing individuals often displayed in a decile table. DM regression models built on today's big data – consisting of a multitude of variables and an army of observations – using statistical regression models, conceived and testing within the small-data setting of the day, 205 years ago, is problematic: Fitting big data to a pre-specified small-framed model produces a skewed model with doubtful interpretability and questionable results. The GenIQ Model is a machine-learning alternative regression model to the statistical models. It is an assumption-free, free-form model that maximizes cum lift, equivalently, the decile table. By using an historical backdrop of the statistical regression models, the purpose of this article is to describe the GenIQ Model itself, and how it complements its elder statistical siblings. At the beginning of everyday for the regression modeler, whose tasks are to predict a continuous outcome (e.g., profit) and a binary outcome (e.g., yes-no response), the ordinary least squares (OLS) regression model and the logistic regression model, respectively, are likely to be put to use, giving promise of another workday of successful models. The essence of any prediction model is the fitness function, which quantifies the optimality (goodness or accuracy) of a solution (predictions). The fitness function of the OLS regression model is mean squared error (MSE), which is minimized by calculus. Historians generally regard calculus going back to the time of the ancient Greeks, circa 400 BC. Calculus started making great strides in Europe towards the end of the 18th century. Leibniz and Newton pulled these ideas together, and they are credited with the independent "invention" of calculus. The OLS regression model is celebrating 204 years of popularity, as the invention of the method of least squares was on March 6, 1805. The fitness function of the logistic regression model (LRM) is the likelihood function, which is maximized by calculus (i.e., the method of maximum likelihood). [1] The logistic function has its roots spread back to the 19th century, when the Belgian mathematician Verhulst invented the function, which he named logistic, to describe population growth. The rediscovery of the function in 1920 is due to Pearl and Reed, the survival of the term logistic to Yule, and the introduction of the function in statistics to Berkson. Berkson used the logistic function in his regression model as an alternative to the normal-probability probit model, usually credited to Bliss in 1934, and sometimes to Gaddum in 1933. (However, the probit can be first traced to Fechner in 1860.) As of 1944, Berkson’s LRM was not accepted as a viable alternative to Bliss’ probit. After the ideological debate about the logistic and probit had abated in the 1960s, Berkson’s logistic gained wide acceptance. Berkson was much derided for coining the term “logit” by analogy to the probit of Bliss, who coined the term probit for “probability unit.” A not-yet popular model is the GenIQ Model©, conceived and developed by Bruce Ratner in 1994, a machine learning alternative model to the statistical ordinary least squares and logistic regression models. GenIQ “lets the data define the model” – automatically 1) data mines for new
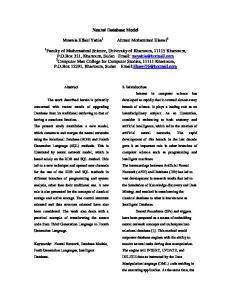
variables, 2) performs variable selection, and 3) specifies the model – so as it maximizes cum lift, equivalently, "optimize the decile table," i.e., to fill the upper deciles with as much profit/many responses as possible. [2] [3] GenIQs fitness function is the cum lift/decile table, which is maximized by the Darwinian inspired machine learning paradigm of genetic programming (GP). [4] Operationally, optimizing cum lift is creating the best possible descending ranking of the target variable (outcome) values. Thus, GenIQs prediction is that of identifying individuals, who are most-likely to least-likely to respond (for a binary outcome), or who contribute large profits to small profits (for a continuous outcome). Historians trace the first use of the decile table, originally called a “gains chart” with roots in the "direct mail" business, circa wee 1950s. [5] The gains chart is hallmarked by solicitations found inside the covers of matchbooks. More recently, the decile table has transcended the origin of the gains chart toward a generalized measure of model performance. (The term "decile" was first used by Galton in 1882. [6]) Historians cite the first experiments with GP by Stephen F. Smith (1980) and Nichael L. Cramer (1985), as described in the seminal book Genetic Programming: On the Programming of Computers by Means of Natural Selection by John Koza (1992), who is considered the inventor of GP. Despite GenIQs easy implementation (simply drop the GenIQ equation into the scoring database), it is not-yet the everyday regression model due to: 1) Unsuspected equation – GenIQs output are the visual display called a parse tree, depicting the GenIQ Model, and the GenIQ Model "equation," which is a computer program/code. The regression modeler, anticipating an equation of the form Y = b0 + b1X1 + b2X2 + ... + bnXn , is stupefied when s/he unsuspectedly sees, say, for the Pythagorean Theorem where d=diagonal, l=length and h=height are the sides of a right triangle, and SQRT=square root function, the GenIQ computer code:
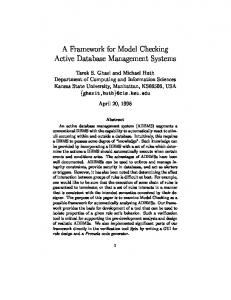
2) Ungainly interpretation – The GenIQ parse tree and computer code can be a "bit much" to grasp (for unknown models/solutions). The visual display provides the modeler with an ocular sense, albeit mote, of comfort and confidence for understanding and using the GenIQ Model. The GenIQ tree for the Pythagorean Theorem (below) is not so ungraspable because the solution is well known (it is the sixth most famous equation [7]).
2
The GenIQ tree, although not a “black box” like most other machine learning methods, gives the modeler a graphic, albeit Picasso-like, to make sense of. GenIQ for the everyday regression model (of unknown solution) produces a GenIQ tree defined by "branches" formed by yellow-boxed predictor variables attached to various numbers of turquoise-boxed functions (like that of the Pythagorean-GenIQ tree). GenIQs tree and computer code represent feature #3 of GenIQ: The GenIQ Model serves as a nonstatistical, machine learning (ML) regression method that automatically specifies the model for the problem at hand. As well, the GenIQ tree represents feature #1 of GenIQ: The GenIQ Model automatically data mines for new variables. Continuing with the Pythagorean illustration, there are four new variables (branches): new_var1=(height X height); new_var2=(length X length); new_var3=(new_var1 + new_var2); and lastly, new_var4=SQRT(new_var3), which is the model itself. Thus, the GenIQ Model serves as a unique data mining method creating new variables – that can not be intuit – via the GP process, which evolves structure (new variables) "without explicit programming" (Adams, 1959). [8] Moreover, appending the new variables to the dataset with the original variables for building a statistical regression model produces a hybrid statistics-ML model, along with the regression coefficients that provide the regression modeler the necessary comfort level for model acceptance. For the regression modeler, interpretability is "all about the regression coefficients." The regression coefficients provide the key to how the model works: Which predictor variables are most important, in rank order? What effect does each predictor variable have on the target variable? (It is not well known that the standard method of interpreting regression coefficients often leads to an incorrect interpretation of the regression model, specifically, the two questions stated above. [9]) GenIQ has no coefficients (as it is not a statistical method), but provides the answer to the first question by way of feature #2 of GenIQ: The GenIQ Model provides a unique variable selection of important predictor variables by ranking [10] the relationship between each predictor variable with the target variable – accounting for the presence of the other predictor variables jointly considered. As for the second question, GenIQ provides the answer by analyzing the decile table. [11] [12] Present Note: With two checks against it: Why use GenIQ? How popular? GenIQ is the appropriate model where the decile table is the model performance. For other instances, a trade-off has GenIQs performance and no coefficients versus statistical regression's
will GenIQ ever become unquestionable measure of to be made between interpretability and use of 3
their fitness functions, which serve as surrogates for optimizing the decile table. Separation anxiety from something that has been used between 50 – 204 years is a condition that takes time to treat. Until the checks become ocularly palatable, which comes about with retraining statisticians to think "out-of-the-box," OLS regression model and LRM will continue to be used. With the the eventual recognition that "valuable information" comes in unsuspected forms, i.e., parse tree, GenIQ will be popular. GenIQ is the model for today's data. It can accommodate big (and small) data, as it is a flexible (i.e., no pre-specification of the model), assumption-free, nonparametric model, whose "engine" lets the data define the model. In stark contrast, OLS regression model and LRM were conceived, testing and experimented on the small data setting of their day. These models are suboptimal and problematic with today's big data. [13] The paradigm of OLS regression model and LRM is to "fit the data to" an unknown pre-specified (i.e., inflexible), assumption-full, parametric model, which is best for small data settings. GenIQ will become popular as today's data grows in size, necessitating the data define the model, rather than "fitting square data into a round model." (This article is taken from Ratner, B., Statistical Modeling and Analysis for Database Marketing: Effective Techniques for Mining Big Data, CRC Press, Boca Raton, 2003.) 1. The likelihood function represents the joint probability of observing the data that have been collected. The term "joint probability" means a probability that combines the contributions of all the individuals in the study. 2. Decile Analysis Primer ( http://www.geniq.net/DecileAnalysisPrimer_2.html ) 3. The “Smart” Decile Analysis ( http://www.geniq.net/SmartDecileAnalysis_.html ) 4. Genetic Programming Overview ( http://www.geniq.net/Koza_GPs.html ) 5. The decile table has ten rows of equal number of individuals, irrespectively of model score. There can be individuals with the same model score in adjacent deciles. In a gains chart, there are as many rows as there are distinct model scores. Thus, there are no individuals with the same model score across gains-chart rows. 6. Galton, F., "Report of the Anthropometric Committee," in Report of the 51st Meeting of the British Association for the Advancement of Science, 1882, pp. 245-260. 7. Peter Alfeld, University of Utah 8. Samuel, A. L., Some studies in machine learning using the game of checkers. IBM Journal of Research and Development 3(3): 210-229, 1959. 9. Ratner, B., Statistical Modeling and Analysis for Database Marketing: Effective Techniques for Mining Big Data, CRC Press, Boca Raton, 2003, Chapter 6. 10. The ranking is based on the mean frequency of a variable across the top 10 models in the latest generation. 11. Ibid., Chapter 16. 12. Ibid., Chapter 17. 13. Harlow, L.L., Mulaik. S.A., and Steiger, J.H., Eds., What If There Were No Significance Tests? Lawrence Erlbaum Associates, Publishers, New Jersey, 1997.
4