A GAUSSIANITY MEASURE FOR BLIND SOURCE SEPARATION INSENSITIVE TO THE SIGN OF KURTOSIS Hsiao-Chun Wu, Jose C. Principe Computational NeuroEngineering Laboratory Department of Electrical and Computer Engineering NEB 486, New Engineering Building University of Florida Gainesville, FL 3261 1 Tel: (352) 392-2662 Fax: (352) 392-0044
[email protected],
[email protected]
ABSTRACT Various existing criteria to characterize the statistical independence are applied in blind source separation and independent component analysis. However, almost all of them are based on parametric models. The distribution model mismatch between the output PDF (Probability Density Functions) and the chosen underlying distribution model is a serious problem in blind signal processing. Nonparametric PDF estimates like the Parzen window applied to the popular KullbackLeibler divergence produce computational difficulties. Hence we propose a new measure, the Quadratic Guussiunity Measure, which is associated with the Euclidean distance between the marginal probability density function and the Gaussian distribution. We show that it outperforms other Gaussianity measures in signal processing applications, such as standardized kurtosis tests because our novel Gaussianity measure is robust to changes in the distribution form. INTRODUCTION Information theory has been widely applied in communication engineering and digital signal processing. Since statistical independence among different sources or adjacent communication symbols is the most reasonable assumption for source separation and blind equalization problems, the Kullback-Leibler divergence K@llq)
0-7803-5673-X/99/$10.00 0 1999 IEEE
58
where x is an N-dimensional random variable vector, has been applied as an independence measure [ 11. However, algorithms based on Kullback-Leibler divergence involve numerical integration which poses computational difficulties [2]. Another method of estimating K@llq)replaces the analytic form in Equation (1) by a sample mean approximation, but it may cause a large statistical bias when the sample size Tis not sufficiently large [3].
To overcome such a practical difficulty Fisher [4] and Xu [5] proposed alternative measures of entropy and mutual information based on the Euclidean distance between the probabilistic functionals such as J ( f ( X ) ’ g(x))
=
J j...Jrrcx) -g(x)12dx
9
(2)
sx
where S , is the region of support. In Fisher’s quadratic entropy difference measure, g(x) = 1 and for Xu’s quadratic mutual information g(x) =
n f i ( x i ) whereflx) is i
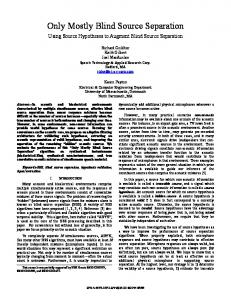
the joint distribution of multi-dimensional random variable x =[xi] andf;:(xi) is the marginal distribution of xi. The non-parametic Parzen window [6] was applied to estimateflx) in [4,5]. The computational complexity is O(N2)where N is the size of the random variable vector x, so there are practical difficulties when N gets large. Let us restrict our discussion to the adaptation of a linear demixing system. The blind source separatiodextraction from an instantaneous or convolutive mixture, as well as the blind equalization of non-Gaussian i.i.d. signals can be unified in the framework of Figure 1. The common goal for both multi-channel blind source separation and single-channel blind equalization is to extract the original signal s(t) up to some undetermined delay q and scaling factor 01 (ocs(t-q)) by linearly transform) a rank-one recovery system W such ing the mixed or channel-distorted ~ ( tthrough that y(f) = Wx(f).If the problem is blind source separation, the vector s(r) = [sl(r),
s2(f),..IT is composed of multiple independent sources. If the problem is blind channel equalization, the vector is composed by the delays of s(f) = [s(f),s(t-1),...I.
Figure 1. A source extraction or blind equalization system.
STANDARDIZED KURTOSES
59
The eigenspread criterion to extract sources one-by-one among selected frames can be considered as a threshold on the second-order energy ratio [7]. Although a large and time-varying energy discrepancy is very common for some nonstationary natural signals such as speech, it is neither an universal characteristic nor a plausible technique for blind separation of a convolutive mixture. Hence, a novel way to extract a single source from the linear mixture using statistical information is necessary. Donoho established measures associated with the so-called Gaussianity of the random variables [8]. The linear combination of random variables always increase the Gaussianity or entropy of the distribution. Then the goal of blind source separation or blind equalization must be simply to decrease the Gaussianity or entropy of the output [8]. Donoho [8] and Wiggin [9] proposed the standardized prhcumufunt as the objective function, defined as CJp, x ) = cpx/c2xp’2 ,
(3)
where Cpxis the pth order cumulant of the data x, and proved that we may extract a source out form the linear mixture by maximizing or minimizing (3). Another objective function is the “Gray norm’’ of the separated or deconvolved sequence [8, 9, 101, which can be expressed as
The Gray norm or standardized kurtosis has been widely utilized for blind source separation [ l l , 131 and blind channel equalization [ 121.
QUADRATIC GAUSSIANITY MEASURES Gray norms or standardized cumulants require a minimum of a priori knowledge about the sources, namely, the sign of the sources’ kurtoses [ l l , 131. We will propose here a novel measure of Gaussianity to extract sources without any a priori requirements, i.e. independently of the sign of the kurtosis. Our novel measures are described as follows: Quadratic Gaussianity measure I : (Euclidean distance) The first novel quadratic Gaussianity measure we propose is based on the Euclidean distance between a marginal output distribution fyi(yi) and its corresponding Gaussian distribution fG(yi) with the same variance. The Euclidean distance between these two probabilistic functionals is defined by
60
The measure GE(gil,gi2) of ( 5 ) will include the trivial zero solution, hence an alternative measure G A i l , gi2) with appropriate normalization (the sample standard deviation) was developed [14]. GNbecomes scale invariant. Quadratic Gaussiunity measure XI: (Absolute cosine) The other novel quadratic Gaussianity measure we propose is based on the square cosine value between a marginal output functional fy,(yi) and its corresponding Gaussian functional fG(yi) with the same variance. The inverse of the square cosine value between these two probabilistic functionals is defined by GA =
r fyjYi)*dYjIm -0
.&Yj)dYj
-00
[ ~ f y j Y~G y(Yi
(6) j],
’
Each of the integrals in ( 5 ) and (6) will be estimated with the information potential described in [6],
where G(.,.) is a multidimensional Gaussian kernel. We will utilize an example to illustrate the difference among all the measures defined here and the existing Gaussianity measures, e.g. the Gray noms NG,~(P, yi) in Equation (4) and the standardized cumulants C&, yi) in Equation (3). For a linear channel, the input vector is x = Hs,where s consists of independent source [SI, s2, s3,..IT or original symbols, H is the channel or mixing system, and x are the observations. Now we assume the output yi is the projection w T x of the N-dimensional input vector x = onto a separating or extracting column vector wi = [wil, wi2,..., wiNIT.We define the product wFH E G = [ g i l , g i p . , g i ~as ] the “sepurutiodextruction performance vecror”. The goal of our extracting system is to maximize the sig[ x l , x2,
..., xNIT
I
($/gip) ,for some specific
nul-to-interference ratio, denoted as P,, = 20 log (p:j
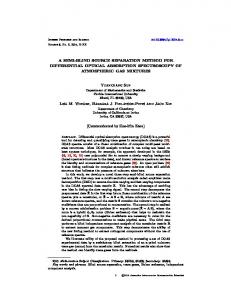
In this example we consider a mixture of two sources, a Sub-Gaussian source (Laplacian stochastic process) and a super-Gaussian source (uniform stochastic process) each with 600 samples. The various measures are functions of the mixing coefficients ( g i l , gi2) through the relationshipyi = gip1 + gi2s2. Figure 2 depicts the measures GN(gi1. ga),GAQjls gj2) of (61, CJ4, Y i ) = NGray(4, YiI-3 Of (3)s and 11
61
[NG,(~, yi)I2. From Figure 2a through Figure 2d, we can observe the following facts: The maxima of ( 5 ) and (6) are always two line segments excluding the origin, i.e., gi,= 0 or gi2= 0 except gil = gi2 = 0. In these conditions, maximization will always separate one sole sub-Gaussian or super-Gaussian source. Consequently, with the new quadratic Gaussianity measures GN(gi1,gi2) or GA(gi1, gi2) there is no need to know the kurtosis sign. This is unlike the Gray norms or the standard cumulants, where we have to decide between a minimization or maximization operation depending upon the sign of the kurtosis.
The plot of measure GN(gi1,g,2)
The plot of measure GA(gi1,g12)
SIMULATION AND CONCLUSION
62
The new measures can be widely applied in blind source separation and blind channel equalization [ 141. We just discuss the source separation here due to page limitations. We will present results using GN only because this learning rule is much simpler to implement. Here we would like to show three source separation simulations and compare the results among different criteria. All simulations are based on artificial mixtures. Instantaneous Mixture We randomly choose a static mixing channel H =
Objective functions pdB
~ ~ G r q ( YJI* 1,
Y~)I* T=300
MNG,(~*
9
T = 38196 44.5019
1 S542
9
G,, T = 300 41.8162
1
0.2944 -0.6918-1.4410 0.8156 -1.3362 0.8580 0.5711 0.7119 0.7143 1.2540 -0.3999 1.2902 1.6236 -1.5937 0.6900 0.6686
ians) and the mixing channel is H =
63
. We
Table 2: Separation performance by optimization of the two measures (four stationary sources including supedsub-Gaussian random processes)
Objective functions
pdB
l/[NGmy(l, yi)l2
l/[NGmy(l* yi)12
T=300
T=300,sliding window
13.7894
28.8579
GN T=300
GN T=300,sliding window
17.3165
34.9422
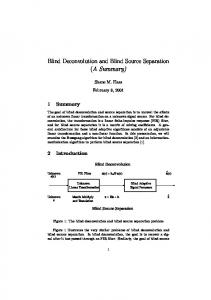
Convolutive Mixture In this experiment we choose the same speech sources as above. The mixing channel impulse responses are Hl (z) = H 2(2) = 1, H12(2)= 0.9 + 0.82-' + 0.1ze2,and H2,(z) = -0.7 + 0 . 4 ~ +~ 0.32' 1 +0.22-3+ 0 . 1 ~We ~ .mix them in the computer and separate these two mixed signals using our GN maximization method and Gray yi)I2) maximization method. We utilize a feedforward structure norm ( l/[NG,(l, with FIRS of order 5, and a non-overlapping sliding windows (window size T = 700). The mixed signals and the separated signals are depicted in Figure 3. We will compute the SIRS as above. The SIR using Gray norm maximization is 0.87 dB, while using our GN maximization is 15.88 dB. We can observe in the Figure that the output using the GN maximization is much closer to Source 2 while the output using the Gray norm maximization is still scrambled. The listening test corroborates the visual analysis. This verifies again that even for convolutive mixtures our GN maximization method is more robust for nonstationary signals than Gray norm maximization method. From these three simulations, we can conclude that the optimization of our measure will outperform the Gray norms for blind signal processing. Further applications of these new measures will be provided in future work. These applications include the blind equalization of short-term fading channels, whose model can be characterized as short finite-support impulse responses.
64
Mixed signal 1
Mixed signal 2
Output using Gray norm
Output using GN
Figure 3. The mixed speech, separated speech for a convolutive mixture.
Acknowledmnents; This work was partially supported by NSF grant ECS-9900394.
REFERENCES [ 13
A. Papoulis, Probability, random variables, and stochastic processes, New
York, McGraw-Hill, 1991. [2]D.T.Pham, “Blind separation of instantaneous mixture of sources via an independent component analysis,” IEEE Transactions on Signal Processing, vol. 44,no. 11, pp. 2768-2779,November 1996. [3]P. Viola, N. Schraudolph and T. Sejnowski, “Empirical entropy manipulation for real-world problems,” in Proceeding of Neural Information Processing Systems Conference, NIPS95, p. 851-857.1995.
65
[4] J. W. Fisher and J. C. Principe, “Entropy manipulation of arbitrary nonlinear mappings,” in Proc. Neural Networkfor Signal Processing, pp. 14-23, 1997. [5] D. Xu, J. Principe, J. Fisher and H.-C. Wu, “A novel measure for independent component analysis (ICA),” in Proc. 1998 IEEE International Conference on Acoustics, Speech and Signal Processing, vol. 2, p. 1161- 1 164. [6] R. Duda, Pattern classqcation and scene analysis, p. 85-95, John Wiley and Sons, New York, U. S. A., 1973. [7] H.-C. Wu, J. Principe and D.Xu, “Exploring the tempo-frequency micro-structure of speech for blind source separation,“ in Proc. 1998 IEEE International Conference on Acoustics, Speech and Signal Processing, vol. 2, p. 1145-1148. [8] D. Donoho, “On minimum entropy deconvolution,” in Applied rime-seriesanalysis 11, pp. 565-609, Academic Press, 1981. [9] R. A. Wiggins, “Minimum entropy deconvolution,” Geoexploration,vol. 16, pp. 21-35, 1978. [ 101 W. Gray, Variable Norm Deconvolution, Ph. D. dissertation, Stanford University, 1979. [ 111 S.- Y. Kung and C. Mejuto, “Extraction of independent components from hybrid mixture: Kuicnet learning algorithm and applications,” in Proceedings
of IEEE International Conference on Acoustics, Speech and Signal Processing, vol. 2, pp. 1209-1212, 1998. [12] S. C. Douglas and S.-Y. Kung, “Application of KuicNet to blind deconvolution,” Technical report, Department of Electrical Engineering, University of
Utah,1998. [131 R. H. Lambert, “A new method for source separation,” in Proceedings of ZEEE
International Conference on Acoustics, Speech and Signal Processing, vol. 3, pp. 2116-2119,1995. [ 141 H.-C. Wu, Blind source separation using information measures in the time and frequency domain, Ph. D.dissertation, University of Florida, 1999.
66