Annual Conference of the Prognostics and Health Management Society, 2010
A hybrid-logic approach towards fault detection in complex cyber-physical systems Nisheeth Srivastava 1 , Jaideep Srivastava 1 1
Dept of Computer Science, University of Minnesota
[email protected] [email protected]
ABSTRACT Existing data mining approaches to complex systems anomaly detection use uni-variate and/or multi-variate statistical hypothesis testing to assign anomaly scores to data streams associated with system components. The former approach assumes statistical independence of individual components, while the latter assumes substantial global systemic correlation. As a compromise between these two epistemological extremes, we present a data-mining approach hybridizing existing statistical techniques with theorem-proving methods to create a novel algorithm for anomaly detection, diagnosis and control in complex systems. Our algorithm takes sensor inputs from physical sensors providing system subcomponent performance data and outputs (i) a global systemic risk indicator and (ii) possible diagnosis hypotheses. We present results on three different systems, and in comparison with current state-of-the-art fault detection algorithms to demonstrate the viability of our approach. We find that our algorithm proves robust towards increased data dimensionality in contrast with existing clustering-based fault detection methods and can also detect contextual faults that are undetectable using existing statistical techniques. 1. INTRODUCTION Monitoring large systems with multiple non-linearly interconnected parts and multiple data outputs for detecting and diagnosing is a problem that has been both widely and sparely studied. Widely, because it occurs almost ubiquitously in real-life applications of data mining and model-based reasoning; sparely because, at least in the data mining context, there exists no real consensus for what a complex system actually is! It is not clear if it is useful to postulate that a system with a causal graph above a certain level of complexity is to be defined as ‘complex’. Nor can the size of the system or the extracted data be good measures of complexity. This is an open-access article distributed under the terms of the Creative Commons Attribution 3.0 United States License, which permits unrestricted use, distribution, and reproduction in any medium, provided the original author and source are credited.
In this paper, we define what constitutes a complex system in the machine learning context, with a particular emphasis on physical real-world systems. Having done so, we demonstrate how several real-life system requiring health monitoring and/or fault detection match this definition and that existing statistical fault detection techniques fall short in predictive performance for such systems. We propose using physical domain knowledge to assist statistical anomaly detection techniques for solving complex anomaly detection problems and present our own algorithm for doing so. We conclude with observations regarding the applicability of our new algorithm to more sophisticated systems and avenues for future research. 2. PROBLEM FORMULATION Existing techniques for data-driven fault monitoring and diagnosis rely heavily on statistical hypothesis testing (Chandola, Banerjee, & V., 2009). The traditional approach has been to estimate parameters of a distribution that fits data generated by a system in its normal mode of operation and use the likelihood of incoming data samples as a determination of fault probability. Data samples considered unlikely to belong to the base distribution are assumed to be faulty or likely to lead to faults. Slight variations of this approach populate a feature space with data samples and use metric distances between neighbors and other local density measures to compute anomaly probability. The underlying assumption, however, remains the same - statistical rarity is proportional with fault probability. Within the scope of this paper, we call this the simplicity assumption. Prior work on multi-variate fault detection in physical systems has generally emerged in two flavors: one attempts to convert the multivariate data into multiple uni-variate streams using some form of blind source separation (Baragona & Battaglia, 2007). These approaches inevitably lose much of the information embedded in the correlations between variables and thus are not suitable for fault detection in complex systems. The other involves computing the covariance or some derivative kernel (Cheng, Tan, Potter, & Klooster, 2009) respect to this joint statistic. These latter approaches are statistically equivalent to approximating the joint density of multiple 1
Annual Conference of the Prognostics and Health Management Society, 2010
variables to establish fault probabilities and, while performing admirably well in detection, tend to fail to identify the individual data variables responsible for the fault. These quibbles aside, however, it is important to note that the simplicity assumption is implicit in all these approaches and is critical for them to remain valid. Should rare joint statistics not correspond with faulty system behavior, such multi-variate approaches must necessarily fail. As we show in Section 2.2, the simplicity assumption need not hold true for several interesting physical systems. We define systems that violate the simplicity assumption - in either the univariate or multi-variate settings, as complex systems. It is further helpful to distinguish systems that are causally complex from systems that are functionally complex. In the former case, statistical evidence from one source is not sufficient to pinpoint an anomaly, but statistical evidence from multiple sources along with knowledge of their causal connections can serve the purpose. In the latter case, this is not sufficient, and functional side information concerning the system’s sub-components is necessary. In order to motivate the significance of our definitions, we now present three case studies: one involving a simple system, one a causally complex system and the third a functionally complex system. 2.1 The NASA engine Our first case study considers a simulation of a Hybrid Combustion Facility (HCF) fuel feed system. The fuel feed system consists of a large tank of pressurized gaseous oxygen (GOX) fed through a series of control valves to an engine’s combustion chamber. Control valves are used to maintain a specific GOX feed pressure to the combustion chamber. The data extracted from the simulation consists of 8 variables sampled at 10 Hz over several runs of the HCF. Each run consists of 150 data samples. The key variables in the system are the GOX tank pressure (measured in psi) and the feed pressure, viz. the measured pressure just before the GOX enters the combustion chamber. Fig 1 shows the difference between a normal HCF run (Fig 1(a)) and one where a slowly increasing leak is introduced in the tank (Fig 1(b)). The goal of a fault detection/monitoring algorithm would be to detect and possibly diagnose the problem in Fig 1(b). This is a simple system, in the sense that a faulty data sample (as in Fig 1(b)) leads to a data sample that can be differentiated from normal operation data using the joint distribution. Even more intuitively, as the reader may well appreciate from Fig 1, given plots of system variable values for both normal and anomalous runs, a domain-agnostic observer would be able to identify the variable that is problematic as well as the temporal location of the anomaly. 2.2 The rock climber As we have suggested above, complex faults may be understood statistically as faults wherein individual data streams, or even components, behave in a normal fashion, but the overall systemic risk is increased1 . To moti1 The logically symmetric case where rare statistical artifacts are detected without any change in systemic risk is not interesting from the fault detection standpoint.
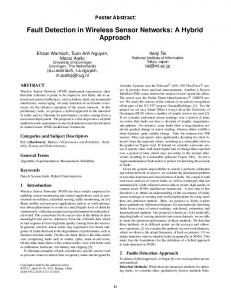
vate this important class of anomaly, we have designed a simulated test example of a rock climber. The rock climber data set is designed with four sensor variables, corresponding to force exerted by each of the four limbs of the climber. The overall sum of the four forces is constrained to remain close to the total weight of the climber. If this sum falls below a preset fraction of the climber’s weight, the climber will fall. Furthermore, each limb is modeled as containing limited reserves of endurance, which is modeled as an energy-equivalent quantity concentrated largely in the lower limbs. The endurance reserve in a particular limb is modeled as being replenishable if force exerted thereupon is reduced below a threshold value. If endurance reserve in a limb drops below zero, the maximum force capacity of that limb is drastically reduced. With these simple constraints in place, force exerted on each limb is simulated over time as a random Gaussian variable with noise. The possibility of using a particular limb at a given point of time, i.e. the cliff topology, is modeled using a 4-vector of 3-ary random variables that allow for - no force, half force or full force to be applied. Topology vectors corresponding to deterministic fall situations, e.g. all four variables zero at the same time, are discarded. Changes in limb usage are enforced using the endurance constraints, an unnatural formulation that nevertheless, yields realistic climbing trajectories. A sample trajectory is shown in Fig 2. The rock climber data, the sensor values being generatively constrained to lie within specific ranges, cannot present statistical evidence of anomalous behavior from any of the four data variables studied individually. However, the rock climber can and will fall if the endurance reserves of more than one limbs fails at the same time. In practice, this will be most likely to happen when the climber is using only hands to climb and cannot find a leg placement in time. The systemic risk of falling would be the greatest in such a scenario. Contrastingly, a climber using only both legs will be in a safe position, hence low systemic risk. Now, note that without either knowledge of the physical domain or labeled training data, fault diagnosis here would be very difficult. Examining the latter possibility first, in theory, it is possible to train a monitoring system using labeled data and obtain vectors of sensor data that are rare and hence could be used to establish the existence of systemic risk. However, this supervised learning approach assumes the existence of either (a) a system with a well-defined statistically identifiable ‘normal’ in the feature space or (b) a substantial number of real-life failure examples. While these requirements are generally quite straightforward to satisfy for general data mining problems, as the example of the rock climber shows, this is not necessarily the case with physical systems. Satisfying the second requirement (existing failure data) in particular can be quite non-trivial for physical systems, since any system requiring sophisticated monitoring is likely to have been designed with extremely low failure rates. To take a real-life example, over 7 years of flight time and O(109 ) data samples, the entire Boeing fleet has reported 50 anomalous flight records. Finding realistic physical data corresponding to existing faults, thus, is difficult for physical systems. It could be argued that, in the absence of real fault data, large amounts 2
Annual Conference of the Prognostics and Health Management Society, 2010
(a) GOX tank pressure and feed pressure in HCF during a normal run.
(b) GOX tank pressure and feed pressure in HCF during an abnormal run.
Figure 1: A leak develops in a simulated Hybrid Combustion Facility towards the end of its run. Note the continued drop of GOX tank pressure below nominal level after feed pressure has been reduced.
Figure 2: Sample run from rock climbing model. A1 and A2 correspond to arm data and L1,L2 correspond to leg data. Note danger zone between time 400-600 when the climber is struggling to find footholds and is having to smear and crimp out of a sticky situation!
3
Annual Conference of the Prognostics and Health Management Society, 2010
of ‘normal’ data could be used to identify the ’normal’ operation of the system, and any departures from this normal behavior would constitute statistical evidence of anomalous and hence potentially faulty behavior. As we mention above, this approach assumes that the data is amenable to analysis as a one-class classification problem. In practice, this need not be the case. In the rock climbing example, almost all possible combinations will be seen in climbing trajectories, given sufficiently interesting topology. The risk involved in the climbing arises from two factors (i) the skill level required for the move, and (ii) the force applied on various limbs over time. It is evident that neither of these two factors can be identified from the force sensor data. While this particular situation is specific to the rock climbing example, we feel our example to be quite representative of real world physical systems. In particular, note that statistical access to the endurance variable for the four limbs would transform this complex problem to a simple problem, in that the risk of falling would vary proportionally with the minimum of the endurance reserves. In realistic physical systems, the analyst has to, of a necessity, make do with the data variables that are available (can be economically sensed), as opposed to the ones that would properly characterize the system. Problems analogous to the force-endurance pair, thus, may be quite frequently encountered in physical complex systems, if not necessarily recognized as such. Finally, note that there are no causal connections between the four data sources in the rock climber data set, and thus, it constitutes a functionally complex system. 2.3 ADAPT electrical dataset While the previous two examples highlight the significance of complexity in analyzing systems for faults, another important concern in monitoring real-world physical systems is the large number of variables. For simple large systems, it is possible to use multi-variate anomaly detection techniques to detect potential anomalies, but it is not clear if a diagnosis can also be made. Separating component-specific information from joint statistics is a non-trivial problem, although some innovative solutions have been attempted with partial success. Greater success. however, has been obtained by using Bayesian networks to model the system and infer the existence of anomalous data (Mengshoel et al., 2008). To present an example of a causally complex system as well as to study the behavior of existing algorithms in comparison with our approach for large systems, our third case study uses a large simulated electrical circuit, originally developed at NASA for testing fault detection algorithms. The Advanced Diagnostic and Prognostic Testbed (ADAPT) is an electrical power system testbed developed at the NASA Ames Research Center. ADAPT provides: (i) a standard testbed for evaluating diagnostic algorithms and software; (ii) a capability for controlled insertion of faults, giving repeatable failure scenarios; and (iii) a mechanism for maturing and transitioning diagnostic technologies onto manned and unmanned vehicles (Poll et al., 2007). For power generation, ADAPT currently uses utility power. For power storage, ADAPT contains 3 sets of 24 VDC 100 Amp-hr sealed lead acid batteries. Power distribution is aided by electromechanical relays and two load banks with AC and DC outputs; there are also several circuit breakers. ADAPT loads in-
clude pumps, fans, and light bulbs. There are sensors of several types, specifically for measuring voltage, current, relay position, temperature, light, and liquid flow. Control and monitoring of ADAPT takes place through programmable automation controllers. With the sensors included, ADAPT contains a few hundred components and is representative of EPSs used in aerospace. Earlier work using this particular dataset (Mengshoel et al., 2008) has generated data samples from failures in both circuit components and sensors designed from real-world failure examples. 16 of these runs are publicly available (NASA-Dashlink, n.d.) and comprise our second dataset. Each sampled point consists of 82 values, which are a mixture of continuous and Boolean variables. A single run contains 200 data samples and the overall dataset consists of 16 runs. In a large majority of cases, each individual component of the system has a single associated data variable. In addition, nominal descriptions of possible modes of operation of each physical device in the circuit, including foreseeable failure modes, are also provided. That is, for every component in the circuit diagram, its physical description (battery/relay/sensor etc) are given, along with the number of possible modes of its operation. A relay, for instance, can have 4 possibilities: open in normal operation, closed in normal operation, stuck open or stuck closed. A position sensor can either be operating normally or be stuck. A voltage sensor can either be operating normally, with an offset or it could be stuck. While such information is unlikely to be specifically available for most physical complex systems, it is worth considering that it could be easily deducible in an approximate sense from a high-level system description in several cases. 3.
PRIOR WORK
As stated above, standard anomaly detection techniques typically take the form of density estimation. For our evaluation, we select the Inductive Monitoring System (IMS) algorithm (Iverson, 2004) currently used by NASA in various vehicle health management capacities. This choice is particularly appropriate, since it reflects the state-of-the-art currently operational while, at the same time, being grounded strongly and simply in the theory of density estimation. IMS essentially operates as a clustering algorithm, developing a ‘knowledge base’ in the form of cluster centroids based on normal operating values of the system. Each cluster is represented with two vectors, one containing the upper range values for each parameter, and one containing the lower range values. The idea behind IMS is to compute the distance of an incoming data sample to existing known nominal centroids in the multidimensional variable space. If the distance of the data sample in the variable space exceeds some threshold, the sample is considered anomalous. The number of clusters is not pre-determined and is defined dynamically. In addition to an inability to process complex anomalies, the performance of IMS will inevitably depend heavily on the appropriateness of the distance metric employed. While the Euclidean metric appears natural for use for real-world data, scaling along various dimensions based on salience to fault probability should pose a knotty problem. To take an extreme example, a nor4
Annual Conference of the Prognostics and Health Management Society, 2010
Figure 3: Circuit diagram of an ADAPT electrical circuit model. malized Euclidean metric would make no distinction between a window wiper stopping and the port engines of an aircraft blowing out! Dimension salience would have to be scaled by hand, which is an arduous task for larger systems. Furthermore, the distance metric must, of a necessity, suffer from the curse of dimensionality(see, e.g. (Houle, Kriegel, Kroger, Schubert, & Zimek, 2010)) , wherein the distance metric will lose its discriminative capacity in higher-dimensional spaces. Bayesian approaches can resolve causal complex anomalies, viz. anomalies that can be inferred from causal connections between components (which are not captured using simpler joint statistics). However, it is not clear if they can resolve functional complex anomalies, as in the rock climbing example. Interpreting Bayesian network inference results can also be difficult should the causal graph of the network differ significantly from the hardware, a problem that often arises in softwareintensive devices. 4. THE HYBRID-LOGIC ALGORITHM From our observations in Section 3., there appears to be substantial evidence in support of the hypothesis that fault detection approaches that do not use domain information over and above the statistical information embedded in individual data streams extracted from a system cannot expect to detect or diagnose complex anomalies. It is possible to further divide domain information, as described before into two types - causal and functional.
The causal type references information that defines aspects such as upstream/downstream, parent/child and serial/parallel behavior between different nodes in the system. An example of such causal information corresponding to an electrical circuit is shown in Figure 4(a). Note that a sparse set of logical statements can be used to completely describe the causal imperatives of a sophisticated structure such as a complicated circuit diagram. Causal information, therefore, is not hard to encode in logical terms. The functional type references information that defines the sub-components of the system using their operational behavior. An example of such functional information corresponding to an electrical component is shown in Figure 4(b). Note again, that the functional definition, in this case of an electro-mechanical relay, need not have any bearing on the real-world definition of the component, but simply needs to reflect the theoretical expectations an expert would expect from the component with respect to its system neighborhood. Using both statistical and physical information in tandem, our hybrid-logic algorithm (schematically outlined in Fig 5) outputs a global systemic risk value which reflects the overall probability of systemic failure. The key insight required in our approach is to understand the definition of systemic risk in the form of a Boolean formula, e.g. Risk = A1 · A3 · A4 + A1 · A2 · A8 + · · · Here, the literals Ai represent different logical outcomes 5
Annual Conference of the Prognostics and Health Management Society, 2010
(a) Causal node information for ADAPT electrical dataset
(b) Functional definition of a relay in ADAPT electrical dataset
Figure 4: Causal and functional information can be determined from domain expertise and used to improve fault detection.
Figure 5: Schematic of hybrid-logic fault detection algorithm
6
Annual Conference of the Prognostics and Health Management Society, 2010
corresponding to a particular data stream. The basic operation of the algorithm can then be broken up into three steps 1. Individual data streams are tracked using expectation maximization for each known behavior mode. Logical outcomes are assigned to each data stream based on adaptive thresholds. 2. Logical satisfiability of various conjunctive clauses corresponding to a particular system failure mode is evaluated. 3. Overall quantitative value of systemic risk is evaluated based on influence of individual conjunctive clauses. We now describe how each of these three steps is implemented in our algorithm. 4.1 Tracking individual streams While far more sophisticated approaches to clustering individual data streams exist, incremental online expectation maximization (Neal & Hinton, 1998) serves our purpose quite adequately. During training, we use expectation maximization to estimate the mean and variance of each mode of normal operation of each data stream. In testing, for every incoming data sample, a Z-test statistic is computed used to determine its likelihood of belonging to any of the modes of the data stream. The statistic corresponding to the largest p-value assigns the current estimated mode of operation for the data point, thereby setting the logical value of Ai . To instantiate this specifically in the case of the rock climber, let us assume that each of the four data sources has three modes of operation - rest, half-flexed and fully-loaded. Each data stream would then have three literals associated with it, e.g. RightArmRest, RightArmHalf and RightArmFull. The values of these literals would be set to true or false based on the determination of mode of operation made in real time by the EM algorithm. The two significant drawbacks of the EM algorithm are generally held to be (i) the need to know the number of modes in the data distribution beforehand and (ii) the lack of theoretical convergence guarantees for arbitrary data distributions. In practice, it is found that most realistic system variable data tends to have well-defined modes with tight variances. Thus, objection (ii) is not a significant point of concern. Several somewhat computationally expensive techniques exist to determine the number of modes in a distribution empirically. In theory, therefore, objection (i) can be overcome if necessary for a particular application. In practice, the number of activity modes for physically realistic system variables seldom exceeds a handful and is known a priori. In the ADAPT dataset, for example, this information is explicitly stated. In the other two, it is possible to identify this information manually with very little effort2 . 4.2 Evaluating logical satisfiability During training, given labeled anomaly data, we assign the logical values corresponding to the known faulty data 2 While such an approach is naturally not scalable with increase in system size, we take comfort in the fact that real world physical complex system cannot grow unboundedly in size!
sample, as well as those corresponding to the nth previous data samples, as individual conjunctive clauses to a knowledge base. Duplicated entries are eliminated. The value of n is either doubled or halved based on whether the entropy of the data stream has increased or decreased in the past n samples, thereby creating a recursive update. Intuitively, this suggests that we will sample from a larger prior history if the data stream has been behaving in an unpredictable manner, and from a smaller history if it has been behaving in a predictable manner. Conjunctive clauses corresponding to expert insight into the problem domain is added separately to the Boolean knowledge base. All the conjunctive clauses, combined disjunctively, represent the algorithm’s comprehensive understanding of possible risks to the system. Making a closed-world assumption, all statements not encoded in the knowledge base are assumed to correspond to safe modes of system behavior. Again, instantiating this explanation with the practical example of the climber, risky profiles of the form Risk = RightArmF ull · Lef tArmF ull + · · · can be encoded into the knowledge base either extraneously from expert knowledge, or through labeled fault data. During testing, our statistical methods will track individual data streams and update the values of the logical literals corresponding to these in real-time. In the example above, if the stress on the right arm on the climber rises close to its maximal value, the literals RightArmHalf and RightArmRest will be set to 0 and RightArmFull will be set to 1. Our algorithm concomitantly samples the satisfiability of the existing risk formulae in its knowledge base. Recall that satisfiability is the problem of determining if the variables of a given Boolean formula can be assigned in such a way as to make the formula evaluate to ‘true’. Equally important is to determine whether no such assignments exist, which would imply that the function expressed by the formula is identically ‘false’ for all possible variable assignments. In this latter case, we would say that the function is unsatisfiable; otherwise it is satisfiable. Wellknown solvers exist for evaluating Boolean satisfiability; we use the Prover9/Mace4 (Prover9/Mace4, n.d.) solver in our implementation. Note that for the hybrid-logic approach, system diagnostics do not require separate inference, since the addition of a literal that renders the knowledge base unsatisiable restricts the fault to the causal chain containing the offending literal. By tracing the satisfiability of causal chains containing elements of this isolated chain from the leaf nodes upwards, the causative system component can be easily identified. 4.3 Evaluating systemic risk Given that we have learned, through training and telemetry under normal operating conditions, a Boolean formula that characterizes the systemic risk possibilities for our physical system. To quantitatively assess this risk, we define the inverse of evaluated data stream p-values as the risk posed by the underlying sub-process. Also, a normalized implicative weight is assigned to every clause in our knowledge base, depending on its sequential distance from an actual faulty data sample. In our implementation, a clause that occurs i samples before a 7
Annual Conference of the Prognostics and Health Management Society, 2010
faulty sample is detected is assigned a value exp( n−i n ). The implicative weights remain persistent across time, unless changed by a subsequent update of an identical clause in the database. The risk values of conjunctive elements in the risk formula are multiplied and weighted with their implicative weights; the values of all clauses deemed satisfiable at a particular sampling instance are added to realize a single number corresponding to the systemic risk potential. 5.
RESULTS
Recall that the fundamental thesis of this paper is that systemic faults that violate the simplicity assumption cannot be detected using purely statistical means and require the addition of some causal or functional information. The GOX dataset presents an example of a system containing only a simple anomaly, which can be detected by purely statistical means. The ADAPT dataset contains simple faults as well as causally complex faults, while the rock climber dataset contains only functionally complex faults. To establish the relative merits of the clusteringbased, bayesian network-based and hybrid logic-based approaches to detecting each of these three classes of faults, we ran experiments on all three datasets. As can be seen in Fig 6, IMS detects simple anomalies quite well in both GOX and the ADAPT datasets. In GOX, there is only one fault to be detected, and IMS works quite well in picking it up early. Of the 16 faults present in the ADAPT dataset, 7 are simple and 9 are causally complex. To ensure fairness of comparison, for every fault in ADAPT, we have trained IMS using only the relevant sensor data, and ignored all others (to alleviate the dimensionality problem). Fig 6(a) shows the performance of IMS in identifying that a battery has failed. The rise in the risk indicator (distance from nearest known normal operating mode) shows that IMS has detected the anomaly statistically. An examination of the components of the distance metric responsible for the deviation picks out the battery sensor as the offending entity, allowing for a reasonable diagnosis. In Fig 6(b), however, where the detection task involves a more sophisticated causally complex fault, the IMS risk indicator, while adequate for detecting that ‘some’ anomaly is being observed, cannot pin it down to a specific component. That is, even an analysis of the deviation components, in this case, proves insufficient to identify the faulty component. In Fig 6 we see that our hybrid-logic approach retrieves accurate predictions in both the GOX and ADAPT datasets, while also presenting a meaningful risk metric for a functionally complex anomaly in the rock climbing data. In contrast, IMS can neither detect, nor diagnose these anomalies. IMS fails entirely in detecting faults on the rock climber data, since it fails to define statistically significant ‘normal’ modes of operation for the climber. Finally, since the climbing dataset is of our own construction, we can access the ground truth with respect to the systemic risk faced by the climber by tracking his cumulative endurance reserve. This datum, which is inaccessible to measurement in the problem formulation, must necessarily be inversely correlated with systemic risk. As we show in Fig 7(b), the hybrid-logic algorithm reliably reproduces this inverse correlation with a very small phase. Thus, in comparing performance on our
first two datasets, it is evident that hybrid-logic performs comparably well with IMS in detecting simple anomalies, and outperforms it in detecting complex anomalies. Table 1: Diagnostic performance on ADAPT dataset. Test #
Bayesian network
Hybrid-logic
309 310 305 306
BATT1 INV1 ESH175 ISH262
BATT1 INV1 ESH175 ISH262
In the absence of access to the intricate Bayesian networks developed in (Mengshoel et al., 2008) etc., we rely on reported results therein to attest to the ability of Bayesian networks to detect both simple and causally complex anomalies. Specifically, for both the examples from the ADAPT dataset mentioned above, (Mengshoel et al., 2008) report accurate fault detection using MAP inference over their Bayesian network. Thus, Bayesian networks can detect both simple and causally complex anomalies. In Table 1, we describe the diagnostic inference of both regular Bayesian networks and our hybridlogic approach on two simple and two complex anomalies in the ADAPT dataset. Our algorithm’s running time does not yet compare favorably with reported Bayesian network inference times of O(10−3 ), with test sample prediction occurring in closer to O(10−1 ) seconds on average on the ADAPT dataset. However, considerable performance improvement might be expected in upgrading from the current implementation (in Matlab). While, in theory, Bayesian networks should also prove incapable of detecting functionally complex anomalies (for which causal information is insufficient), we have not been able to empirically test this proposition in a meaningful manner so far, since, for the dataset in question, there is no causality for the Bayesian model to perform inference with; a correct implementation of MAP inference on this completely unconnected graph is identical to fault detection using parameter estimation on individual data streams. Since the acausal nature of the rock climber data streams could be construed as a special case, we cannot yet claim empirical validation for the thesis that Bayesian networks will prove incapable of handling functionally complex systems. Further testing on a more appropriate dataset (containing causal connections as well as functional faults) is needed. A further interesting observation about the hybridlogic approach emerges from our experimental results independent of its value in detecting and diagnosing complex anomalies. In Section 3., we have described how IMS and other traditional clustering-based algorithms, through the use of a single distance metric, are susceptible to reduced performance for problems where data elements possess a large number of features. It could be argued that our approach, relying on parameter estimation techniques to assess fault probabilities in individual data streams, would also suffer from the same defect. However, note that the construction of our systemic risk indicator naturally introduces an element of modularity to the risk metric. Data features that are found 8
Annual Conference of the Prognostics and Health Management Society, 2010
(a) IMS and hybrid-logic results on GOX dataset
(b) IMS and hybrid-logic results on ADAPT dataset # 309
Figure 6: Both IMS and hybrid-logic approaches can detect simple faults quite well.
(a) Systemic risk indicator corresponding to a climber’s trajectory across a cliff-face in one run. Both IMS and Bayesian network methods completely fail to recognize danger signals given climber data.
(b) Systemic risk predicted with total endurance reserves available to climber averaged across 100 different runs on same topology with randomized climbing patterns (arm-leg placement sequences). Risk indicator reliably increases when endurance reserves decrease.
Figure 7: Hybrid-logic algorithm detects faults in latent endurance variable inaccessible to standard statistical and causal fault detection approaches.
(a) IMS results on GOX dataset with extra irrelevant features added.
(b) Hybrid-logic results on GOX dataset with extra irrelevant features added.
Figure 8: IMS and other clustering approaches can detect simple faults quite well.
9
Annual Conference of the Prognostics and Health Management Society, 2010
to be irrelevant for assessing risk potential do not correspond to logical literals in the risk formula, and hence cannot affect the quality of the result. Thus, the use of a metric sensitive to causal and functional dependencies (see Fig 9) in the underlying system allows us to decrease the space complexity of our algorithm considerably and, in practice, renders it immune to performance degradation in higher dimensional feature spaces. With reference to Fig 9(b) specifically, note that doubly counting nodes cannot diminish the statistical reliability of the hybrid approach as compared to simpler approaches as the total statistical information in the causal graph is not decreased. This ensures that our algorithm does not sacrifice predictive performance for reducing search space complexity. The trade-off is, in fact, with respect to the pre-processing and system specification overhead that goes into setting up the hybrid-logic approach. In light of the fact that this overhead is a one-time training cost, we feel that it is positive from the standpoint of fault detection. We test our hypothesis on the GOX data set by artificially appending 22 and 192 irrelevant features to each data point in two separate experiments and testing fault detection performance. Training is conducted using multiple normal runs as well as copies of faulty runs of the engine. The hybrid approach reliably learns the relationship between gas tank pressure and feed pressure. As shown in Fig 8, the hybrid approach is robust to increase in dimensionality, as opposed to existing clustering methods. 6.
DISCUSSION
The results from our experimental comparison of various fault detection approaches are summarized in Table 2. While we have not been able to empirically demonstrate a more general applicability for our algorithm as opposed to the state-of-the-art in Bayesian network inference, we have been able to show that our algorithm performs very well in a causally unconnected domain where Bayesian network inference fails to detect potential anomalies. We further show that, discounting system specification and training overhead, adopting a hybrid-logic approach should do no worse than existing statistical methods in predicting simple anomalies, while concomitantly providing detection coverage for functionally and causally contextual anomalies. Specifically, for causally complex anomalies, with a computational overhead, it allows for the introduction of causal information into the prediction algorithm. Even further, with the same computational (but further pre-processing) overhead, it allows for the introduction of domain expert knowledge to allow for the prediction of functionally complex anomalies. Finally, we have shown that using a functionally designed risk indicator instead of a uniform metric allows the hybrid-logic approach to avoid performance degradation in high-dimensional feature spaces, an innovation that could potentially be transferred into existing techniques independent of the deployment of the rest of the algorithm. Touching upon avenues for future work, we note with some dissatisfaction that developing reasonable algorithms for complex system fault detection presents the appearance of a chicken-and-egg problem, in the sense that algorithmic development has languished in the ab-
sence of sufficiently rich datasets from real-life measurements while data collection has suffered from a lack of focus arising due to the absence of clear algorithmic requirements. Having obtained some clarity with respect to the nature of interesting anomalies in physical systems, we anticipate being able to present evidence for the existence of functionally complex anomalies in realworld physical systems and the value of using hybridlogic algorithms for detecting them in the near future. ACKNOWLEDGEMENTS This material is based upon work supported by the National Science Foundation under Grant CNS 0931931 and by NASA under contract NNX08AC36A. Any opinions, findings, and conclusions or recommendations expressed in this material are those of the author(s) and do not necessarily reflect the views of the sponsoring organizations. REFERENCES Baragona, R., & Battaglia, F. (2007). Outlier detection in multivariate time series by Independent Component Analysis. Neural Computation, 19, 19621984. Chandola, V., Banerjee, A., & V., K. (2009). Anomaly detection: A survey. ACM Computing survey, 41. Cheng, H., Tan, P., Potter, C., & Klooster, S. (2009). Detection and Characterization of Anomalies in Multivariate Time Series. In Proceedings of the SIAM Data Mining Conference. Houle, M., Kriegel, H., Kroger, P., Schubert, E., & Zimek, A. (2010). Can Shared-Neighbor Distances Defeat the Curse of Dimensionality? In Proceedings of the 21th International Conference on Scientific and Statistical Database Management. Iverson, D. (2004). Inductive system health monitoring. In International Conference on Artificial Intelligence (IC-AI04). Mengshoel, O., Darwiche, A., Cascio, K., Chavira, M., Poll, S., & Uckun, S. (2008). Diagnosing Faults in Electrical Power Systems of Spacecraft and Aircraft. In Proc. of the Twentieth Innovative Applications of Artificial Intelligence, Conference (IAAI08). NASA-Dashlink. (n.d.). Retrieved on 01/12/2010 from. https://c3.ndc.nasa.gov/dl/data/ adapt-an-electrical-power-system -testbed/. Neal, R., & Hinton, G. E. (1998). A View Of The Em Algorithm That Justifies Incremental, Sparse, And Other Variants. In Learning in Graphical Models (p. 355-368). Kluwer Academic Publishers. Poll, S., Patterson-Hine, A., Camisa, J., Garcia, D., Hall, D., Lee, C., et al. (2007). Advanced diagnostics and prognostics testbed. In Proceedings of the 18th International Workshop on Principles of Diagnosis (DX-07) (p. 178-185). Prover9/Mace4. (n.d.). Retrieved on 06/07/2010 from. http://www.cs.unm.edu/˜mccune/ prover9/. Nisheeth Srivastava is a PhD candidate in the Department of Computer Science at the University of Minnesota. He is a Bachelor of Electrical Engineering 10
Annual Conference of the Prognostics and Health Management Society, 2010
(a) Existing fault detection algorithms will construct a risk statistic from all five data streams in a system.
(b) Hybrid-logic will use only nodes in causal module(s) presenting anomalous statistical behavior.
Figure 9: Visualization of the modular nature of risk assessment in the hybrid-logic algorithm. Table 2: Ability of anomaly detection algorithms to detect and diagnose various kinds of system faults
Clustering Bayesian networks Hybrid-logic
Simple
Causally complex
Functionally complex
! ! !
% ! !
% ?? !
from the Indian Institute of Technology, Madras. His work in statistical data mining revolves around interfacing between state-of-the-art theoretical advances and practical industry requirements, with a specialization in real-time fault detection for complex cyber-physical systems. Jaideep Srivastava is a Professor of Computer Science & Engineering at the University of Minnesota. He has a Bachelors from the Indian Institute of Technology (IIT), Kanpur, India, and MS and PhD from the University of California, Berkeley. He has established and led a laboratory that conducts research in data mining, social computing and multimedia systems. He has supervised 26 Ph.D. dissertations, 55 M.S. theses, and a number of post-doctoral researchers. In the process, he has authored or co-authored over 250 peer-reviewed papers. He has significant experience in the industry, in both consulting and executive roles. Specifically, he has lead a corporate data mining team at Amazon.com, built a data analytics department at Yodlee, and served as the Chief Technology Officer for Persistent Systems, where he built an R&D division with a number of Centers of Excellence. He has served as Technology Advisor to the State Government of Minnesota and to the Government of India. He is a Fellow of the Institute of Electrical and Electronics Engineers (IEEE), and has served as an IEEE Distinguished Visitor.
11