Accelerating fDOT image reconstruction based on path-history fluorescence Monte Carlo model by using three-level parallel architecture Xu Jiang,1,2 Yong Deng,1,2,* Zhaoyang Luo,1,2 and Qingming Luo1,2 1
2
Britton Chance Center for Biomedical Photonics, Wuhan National Laboratory for Optoelectronics-Huazhong University of Science and Technology, Wuhan 430074, China Moe Key Laboratory of Biomedical Photonics of Ministry of Education, Department of Biomedical Engineering, Huazhong University of Science and Technology, Wuhan 430074, China *
[email protected]
Abstract: The excessive time required by fluorescence diffuse optical tomography (fDOT) image reconstruction based on path-history fluorescence Monte Carlo model is its primary limiting factor. Herein, we present a method that accelerates fDOT image reconstruction. We employ three-level parallel architecture including multiple nodes in cluster, multiple cores in central processing unit (CPU), and multiple streaming multiprocessors in graphics processing unit (GPU). Different GPU memories are selectively used, the data-writing time is effectively eliminated, and the data transport per iteration is minimized. Simulation experiments demonstrated that this method can utilize general-purpose computing platforms to efficiently implement and accelerate fDOT image reconstruction, thus providing a practical means of using path-history-based fluorescence Monte Carlo model for fDOT imaging. ©2015 Optical Society of America OCIS codes: (170.6280) Spectroscopy, fluorescence and luminescence; (200.4960) Parallel processing; (170.3010) Image reconstruction techniques; (170.6960) Tomography.
References and links 1. 2. 3. 4. 5. 6. 7. 8. 9. 10. 11. 12. 13.
J. Lackowicz, Principle of Fluorescence Spectroscopy (Springer, New York, 2006). A. Corlu, R. Choe, T. Durduran, M. A. Rosen, M. Schweiger, S. R. Arridge, M. D. Schnall, and A. G. Yodh, “Three-dimensional in vivo fluorescence diffuse optical tomography of breast cancer in humans,” Opt. Express 15(11), 6696–6716 (2007). V. Ntziachristos, “Fluorescence molecular imaging,” Annu. Rev. Biomed. Eng. 8(1), 1–33 (2006). S. C. Davis, K. S. Samkoe, K. M. Tichauer, K. J. Sexton, J. R. Gunn, S. J. Deharvengt, T. Hasan, and B. W. Pogue, “Dynamic dual-tracer MRI-guided fluorescence tomography to quantify receptor density in vivo,” Proc. Natl. Acad. Sci. U.S.A. 110(22), 9025–9030 (2013). B. F. Manly, Randomization, Bootstrap and Monte Carlo Methods in Biology (CRC Press, 2006). C. Zhu and Q. Liu, “Review of Monte Carlo modeling of light transport in tissues,” J. Biomed. Opt. 18(5), 050902 (2013). T. Li, H. Gong, and Q. Luo, “MCVM: Monte Carlo modeling of photon migration in voxelized media,” J. Innov. Opt. Health Sci. 3(2), 91–102 (2010). B. H. Hokr, V. V. Yakovlev, and M. O. Scully, “Efficient time-dependent Monte Carlo simulations of stimulated raman scattering in a turbid medium,” ACS Photonics 1(12), 1322–1329 (2014). A. V. Bykov, M. Y. Kirillin, and A. V. e. Priezzhev, “Monte Carlo simulation of an optical coherence Doppler tomograph signal: the effect of the concentration of particles in a flow on the reconstructed velocity profile,” Quantum Electron. 35(2), 135–139 (2005). T. Li, Y. Zhao, Y. Sun, and K. Li, “Effects of wavelength, beam type and size on cerebral low-level laser therapy by a Monte Carlo study on visible Chinese human,” J. Innov. Opt. Health Sci. 8(1), 1540002 (2015). A. J. Welch, C. Gardner, R. Richards-Kortum, E. Chan, G. Criswell, J. Pfefer, and S. Warren, “Propagation of fluorescent light,” Lasers Surg. Med. 21(2), 166–178 (1997). V. Ntziachristos and R. Weissleder, “Experimental three-dimensional fluorescence reconstruction of diffuse media by use of a normalized Born approximation,” Opt. Lett. 26(12), 893–895 (2001). J. Chen and X. Intes, “Comparison of Monte Carlo methods for fluorescence molecular tomographycomputational efficiency,” Med. Phys. 38(10), 5788–5798 (2011).
#247350 (C) 2015 OSA
Received 4 Aug 2015; revised 12 Sep 2015; accepted 13 Sep 2015; published 24 Sep 2015 5 Oct 2015 | Vol. 23, No. 20 | DOI:10.1364/OE.23.025996 | OPTICS EXPRESS 25996
14. A. Liebert, H. Wabnitz, N. Zołek, and R. Macdonald, “Monte Carlo algorithm for efficient simulation of timeresolved fluorescence in layered turbid media,” Opt. Express 16(17), 13188–13202 (2008). 15. J. Chen, V. Venugopal, and X. Intes, “Monte Carlo based method for fluorescence tomographic imaging with lifetime multiplexing using time gates,” Biomed. Opt. Express 2(4), 871–886 (2011). 16. A. T. Kumar, “Direct Monte Carlo computation of time-resolved fluorescence in heterogeneous turbid media,” Opt. Lett. 37(22), 4783–4785 (2012). 17. Z. Luo, Y. Deng, K. Wang, L. Lian, X. Yang, and Q. Luo, “Decoupled fluorescence Monte Carlo model for direct computation of fluorescence in turbid media,” J. Biomed. Opt. 20(2), 025002 (2015). 18. X. Jiang, Y. Deng, Z. Luo, K. Wang, L. Lian, X. Yang, I. Meglinski, and Q. Luo, “Evaluation of path-historybased fluorescence Monte Carlo method for photon migration in heterogeneous media,” Opt. Express 22(26), 31948–31965 (2014). 19. Y. Deng, Z. Luo, X. Jiang, W. Xie, and Q. Luo, “Accurate quantification of fluorescent targets within turbid media based on a decoupled fluorescence Monte Carlo model,” Opt. Lett. 40(13), 3129–3132 (2015). 20. D. R. Kirkby and D. T. Delpy, “Parallel operation of Monte Carlo simulations on a diverse network of computers,” Phys. Med. Biol. 42(6), 1203–1208 (1997). 21. A. Colasanti, G. Guida, A. Kisslinger, R. Liuzzi, M. Quarto, P. Riccio, G. Roberti, and F. Villani, “Multiple processor version of a Monte Carlo code for photon transport in turbid media,” Comput. Phys. Commun. 132(12), 84–93 (2000). 22. E. Alerstam, T. Svensson, and S. Andersson-Engels, “Parallel computing with graphics processing units for highspeed Monte Carlo simulation of photon migration,” J. Biomed. Opt. 13(6), 060504 (2008). 23. Q. Fang and D. A. Boas, “Monte Carlo simulation of photon migration in 3D turbid media accelerated by graphics processing units,” Opt. Express 17(22), 20178–20190 (2009). 24. N. Ren, J. Liang, X. Qu, J. Li, B. Lu, and J. Tian, “GPU-based Monte Carlo simulation for light propagation in complex heterogeneous tissues,” Opt. Express 18(7), 6811–6823 (2010). 25. G. Quan, H. Gong, Y. Deng, J. Fu, and Q. Luo, “Monte Carlo-based fluorescence molecular tomography reconstruction method accelerated by a cluster of graphic processing units,” J. Biomed. Opt. 16(2), 026018 (2011). 26. X. Song, D. Wang, N. Chen, J. Bai, and H. Wang, “Reconstruction for free-space fluorescence tomography using a novel hybrid adaptive finite element algorithm,” Opt. Express 15(26), 18300–18317 (2007). 27. B. W. Pogue, T. O. McBride, J. Prewitt, U. L. Österberg, and K. D. Paulsen, “Spatially variant regularization improves diffuse optical tomography,” Appl. Opt. 38(13), 2950–2961 (1999). 28. J. Ye, C. Chi, Z. Xue, P. Wu, Y. An, H. Xu, S. Zhang, and J. Tian, “Fast and robust reconstruction for fluorescence molecular tomography via a sparsity adaptive subspace pursuit method,” Biomed. Opt. Express 5(2), 387–406 (2014). 29. Y. Wang, P. Li, C. Jiang, J. Wang, and Q. Luo, “GPU accelerated electric field Monte Carlo simulation of light propagation in turbid media using a finite-size beam model,” Opt. Express 20(15), 16618–16630 (2012). 30. “Nvidia Corporation, “CUDA programming guide 6.5,” (2014).” 31. J. R. Shewchuk, An Introduction to the Conjugate Gradient Method Without the Agonizing Pain (CarnegieMellon University, Department of Computer Science, 1994). 32. T. Correia, N. Ducros, C. D’Andrea, M. Schweiger, and S. Arridge, “Quantitative fluorescence diffuse optical tomography in the presence of heterogeneities,” Opt. Lett. 38(11), 1903–1905 (2013).
1. Introduction Fluorescence diffuse optical tomography technology (fDOT) plays an important role in biomedical research [1] and has broad application potential in functional genomics and proteomics, genetic pathology, cancer diagnostics, cellular and molecular biology, and pharmaceuticals [2,3]. It enables quantitative observation and precise location of biochemical reactions and the corresponding changes that occur inside living organisms [4]. Most biological tissues are highly scattering media. It is essential to establish a model that can accurately simulate the excitation and propagation of fluorescence for quantitative and locative fDOT imaging. As is well known, photon propagation in biological tissue can be described by the radiative transfer equation. The Monte Carlo model derived from the radiative transfer equation [5] has become the gold standard to describe photon transport in biological tissue [6– 10]. In 1997, a standard fluorescence Monte Carlo (sfMC) model was proposed [11], which describes fluorescence excitation and transport in biological tissue. Due to its low computational efficiency, the sfMC model cannot be utilized for fDOT image reconstruction. Subsequently, an adjoint fluorescence Monte Carlo (afMC) model was proposed [12], which is based on the Born approximation. It can be applied to smaller numbers of source-detector (SD) pairs; however, as the number of SD pairs increases, the calculation time required by the
#247350 (C) 2015 OSA
Received 4 Aug 2015; revised 12 Sep 2015; accepted 13 Sep 2015; published 24 Sep 2015 5 Oct 2015 | Vol. 23, No. 20 | DOI:10.1364/OE.23.025996 | OPTICS EXPRESS 25997
afMC model increases exponentially [13]. In order to overcome this difficulty, path-historybased fluorescence Monte Carlo models were developed, such as the perturbation fluorescence Monte Carlo (pfMC) model [14–16] and the decoupled fluorescence Monte Carlo (dfMC) model [17–19]. Both methods can directly calculate fluorescence by using path information of the excitation light when the optical parameters are changed. They both can improve the computational efficiency of the fDOT image reconstruction [14–19]. The excessive time required by the aforementioned Monte Carlo methods is the main drawback to using these techniques. Initially, researchers reduced the calculation time by employing parallel multi-node and parallel multi-processor methods. In 1997, the design of a Monte Carlo program that could run simultaneously on up to 24 computers was presented [20]. Similarly, in 2000, a Monte Carlo program that could run on a multi-processor computer was developed [21]. Over the past 20 years, Intel and AMD have continuously improved central processing unit (CPU) performance. CPU have developed from single-core to multicore. Multi-core CPUs can execute programs simultaneously in parallel. During the same time, NVIDIA developed programmable graphics processor units (GPUs), which are more suitable than CPUs for parallel computing. In 2008, executing a Monte Carlo program on a GPU was first proposed [22], and in 2009, a parallel Monte Carlo algorithm to simulate timeresolved photon transport in arbitrary 3D turbid media accelerating by GPU was reported [23]. Parallel implementation of a Monte Carlo simulation based on a triangle mesh model was first demonstrated in 2010 [24]. In 2011, a GPU-accelerated method was first introduced into fDOT image reconstruction [25] and used the afMC Monte Carlo model. From 2011 to 2015, a path-history-based fluorescence Monte Carlo model was widely used for fDOT image reconstruction [15,19]. Nowadays, due to the development of computer technology, multiple nodes in parallel in cluster, multiple cores in parallel in CPU, and multiple streaming multiprocessors in parallel in GPU preclude the ability to rapidly reconstruct images via fDOT. However, in all the above acceleration methods, either multiple nodes in parallel in cluster or multiple streaming multiprocessors in parallel in GPU was used to accelerate Monte Carlo simulations, which makes fDOT image reconstruction significantly time-consuming on general-purpose computing platforms. There has been no research thus far on accelerating fDOT image reconstruction based on path-history fluorescence Monte Carlo model. In this study, we combined multiple parallel nodes in cluster, multiple parallel cores in CPU, and multiple parallel streaming multiprocessors in GPU to develop and implement a more rapid fDOT image reconstruction method based on the dfMC model. Likewise, this acceleration method is also suitable for the fDOT image reconstruction based on the pfMC model. First, we introduce the dfMC model and apply it to fDOT image reconstruction. Then, we present the three-level parallel architecture scheme and the implementation of fDOT image reconstruction using this architecture. After that, we introduce how to store, read/write, and transfer the large amounts of data involved in fDOT image reconstruction. Furthermore, we present a simulation experiment in which the effects of different tissue optical parameters on the image reconstruction time required by the three-level parallel architecture fDOT image reconstruction were studied. A discussion of the results follows. Finally, we summarize the paper. 2. Methods 2.1 fDOT image reconstruction problem The fDOT image reconstruction process mainly consists of two parts: 1) establishing an accurate forward model to simulate fluorescence excitation and transport in biological tissue and 2) reconstructing the concentrations of fluorescence targets in biological tissue based on the intensities of excitation light and fluorescence measured by the detectors.
#247350 (C) 2015 OSA
Received 4 Aug 2015; revised 12 Sep 2015; accepted 13 Sep 2015; published 24 Sep 2015 5 Oct 2015 | Vol. 23, No. 20 | DOI:10.1364/OE.23.025996 | OPTICS EXPRESS 25998
2.1.1 Decoupled fluorescence Monte Carlo forward model By decoupling the excitation-to-emission and transport process of fluorescence from the path probability density function [17], the dfMC method calculates fluorescence along the trajectories of the excitation light. The calculation process can be divided into three parts: excitation light transmission, fluorescence excitation, and fluorescence transmission. In the dfMC forward model, p is defined as the state of photon transmission and is a sixdimensional vector that includes information about the spatial position and direction of the transmitted photons. An excitation photon with initial weight w0 is incident on the tissue surface at rs . The weight of an excitation photon that achieves fluorescence excitation at position r has decreased to w(rs , r ) = w0 Γ( p0 → p1 , μ aex + μ af )Γ( p1 → p2 , μ aex + μ af )... ×Γ( pm −1 → pm , μaex + μaf )
(1)
,
= w0 Γ( p0 → pm , μ + μ af ) ex a
where p0 , p1 , p2 , , pm −1 are the states that the excitation photon experienced before reaching the fluorescence excitation position; μ aex is the absorption coefficient at excitation wavelength λx ; μ af is the specific absorption coefficient of the fluorophore at emission wavelength λm ; Γ ( p ' → p, μ ) = exp ( − μ l ) , where μ represents the absorption coefficient at different wavelength; p ' is the state before p ; and l is the distance between states p ' and p . Note that when the excitation photon is in a non-fluorescent region, μ af is 0. In the process of fluorescence excitation, the probability of conversion from excitation to emission at r is ημaf ( rm ) PI ( sˆm −1 ⋅ sˆm ) (2) tran = ex , μ s ( rm ) PA ( sˆm −1 ⋅ sˆm , g ex ( rm −1 ) ) where sˆm −1 and sˆm are the directions of photon when it is in states pm −1 and pm , respectively; rm −1 and rm are the positions of the photon when it is in states pm −1 and pm , respectively; η is the quantum efficiency; μ sex is the scattering coefficient at λx ; g ex is the anisotropy constant at λx ; and PI and PA are the isotropic and anisotropic scattering phase functions, respectively. In general, the isotropic scattering phase function is the HenyeyGreenstein phase function. Assuming that the initial weight of an excited fluorescence photon is w0' , then when the fluorescence photon reaches the detector at rd , its weight will have decreased to w(r , rd ) = w0′ Γ( pm → pm +1 , μaex )Γ( pm +1 → pm + 2 , μaex ) Γ( pn −1 → pn , μaex ) ×Γ( pm → pm +1 , μtem − μtex )Γ( pm +1 → pm + 2 , μtem − μtex ) Γ( pn −1 → pn , μtem − μtex ) em n −1 μ r j PA ( sˆ j ⋅ sˆ j +1 , g em r j ) s ×∏ , (3) ex r j PA ( sˆ j ⋅ sˆ j +1 , g ex r j ) j = m μs em n −1 μ ˆ j ⋅ sˆ j +1 , g em r j ) r j PA ( s s w0′ Γ( pm → pn , μaex )Γ( pm → pn , μtem − μtex )∏ ex r j PA ( sˆ j ⋅ sˆ j +1 , g ex r j ) j = m μs
( ) ( )
#247350 (C) 2015 OSA
( ) ( )
( ) ( )
( ) ( )
Received 4 Aug 2015; revised 12 Sep 2015; accepted 13 Sep 2015; published 24 Sep 2015 5 Oct 2015 | Vol. 23, No. 20 | DOI:10.1364/OE.23.025996 | OPTICS EXPRESS 25999
where pm , pm +1 , pm + 2 , , pn are the states that the fluorescence photon experienced before reaching the detector; μ sem is the scattering coefficient at λm ; μtex and μtem are the extinction coefficients at λx and λm , respectively; and g em is the anisotropy constant at λm . Integrating Eqs. (1), (2), and (3) indicates that the weight of the i th detected fluorescence photon is wiem ( pn ) = w0 Γ ( p0 → pm , μ aex + μ af ) ημaf ( rm ) PI ( sˆm −1 ⋅ sˆm ) × ex Γ ( pm → pn , μ aex ) Γ ( pm → pn , μtem − μtex ) . (4) μ s ( rm ) PA ( sˆm −1 ⋅ sˆm , g ex ( rm −1 ) ) em n −1 μ em ( r ) P ˆ ˆ ( rj ) A s j ⋅ s j +1 , g s j ×∏ ex ˆ j ⋅ sˆ j +1 , g ex ( rj ) j = m μ s ( rj ) PA s
( (
) )
In fDOT image reconstruction, we calculate the fluorescence intensity on the detector along the excitation light path. If an excitation photon with initial weight w0 propagates from rs and is detected at rd , then its weight will have decreased to wiex ( pn ) = w0 Γ ( p0 → pn , μaex ) .
(5)
Substituting Eq. (5) into Eq. (4), the relationship between the weight of the excitation light and the fluorescence can be obtained: ημaf ( rm ) PI ( sˆm −1 ⋅ sˆm ) wiem ( pn ) = wiex ( pn ) Γ ( p0 → pm , μ af ) ex . μ s ( rm ) PA ( sˆm −1 ⋅ sˆm , g ex ( rm −1 ) ) (6) em n −1 μ em ( r ) P ˆ ˆ ( rj ) A s j ⋅ s j +1 , g s j em ex ×Γ ( pm → pn , μt − μt ) ∏ ex ˆ j ⋅ sˆ j +1 , g ex ( rj ) j = m μ s ( rj ) PA s
( (
) )
Since the difference between the excitation and emission wavelengths is generally negligible [14,15], we can approximate μaex ≈ μaem , μ sex ≈ μ sem , so Eq. (6) can be written as: wiem ( pn ) = wiex ( pn ) Γ ( p0 → pm , μaf
ημ ( r ) P sˆ ⋅ sˆ ) μ exaf ( r m) P sˆ I (⋅ sˆm −,1g exm )r . ( m −1 ) ) s m m A ( m −1
(7)
For calculation convenience, the biological tissue can be voxelized. In a single voxel v f , if
the
optical
parameter
distribution
is
considered
to
be
uniform,
then
μaf ( r ) r∈voxel v = μafv , μ s ( r ) r∈voxel v = μ sv , and g ( r ) r∈voxel v = g v . There may be multiple f
f
f
f
f
f
scattering points in a single voxel, and it is likely that fluorescence will be excited at each scattering point. If an excitation photon propagates from a source at rs and is excited in voxel v f , then the total weight of fluorescence detected at rd can be expressed as:
(
))
(
(
(
wivemf ( pn ) = wiex ( pn ) exp − μ afv0 l ph0 → ph1 exp − μ afv f −1 l ph f −1 → ph f ×
η μafv μ
ex sv f
f
k +t
m=k
PI ( sˆm −1 ⋅ sˆm )
(
PA sˆm −1 ⋅ sˆm , g vexf
)
(
exp − μ afv f l ( pk −1 → pm )
)
)) (8)
The excitation photon passes through f voxels before reaching voxel v f in which fluorescence is excited. Here, ph f −1 +1 , , ph f ( h0 = 0, h f = k − 1 ) represents the sequence of
#247350 (C) 2015 OSA
Received 4 Aug 2015; revised 12 Sep 2015; accepted 13 Sep 2015; published 24 Sep 2015 5 Oct 2015 | Vol. 23, No. 20 | DOI:10.1364/OE.23.025996 | OPTICS EXPRESS 26000
states of a propagating photon that falls within the f th voxel, while pk , , pk + t represents the sequence of states of a propagating photon that falls within voxel v f . In the forward calculation, it is necessary to store the physical quantities L1 = l ( pk −1 → pk ) and
(
L2 = PI ( sˆk −1 ⋅ sˆk ) PA sˆk −1 ⋅ sˆk , g vexf
)
at each step along the excitation light path to perform
fDOT image reconstruction. 2.1.2 Image reconstruction with Tikhonov regularization Because of the nonlinearity and ill-posedness of the inverse problem [26], Tikhonov regularization is usually introduced into the reverse calculation to improve its stability [27]. The process of fDOT image reconstruction involves finding the optimal solution to minimize the objective function [28], which can be expressed as min E ( x ) = x
1 2 2 Jx − D 2 + λ x 2 , 2
(9)
where E ( x ) is the objective function; λ is the specific regularization parameter; J ∈ R a×b is the fluorescence Jacobi matrix, where a is the number of sources and b is the number of detectors; x ∈ R w is the specific absorption coefficient of the fluorophore to be reconstructed, where w is the number of voxels needed to reconstruct the specific absorption coefficient of the fluorophore; and D ∈ R b is the actual fluorescence intensity incident on the detectors. For calculation convenience, Eq. (9) can be transformed into the equivalent form min E ( Δx ) = Δx
1 T T Δx ( J J + λ ) Δx − ΔxT J T ΔD , 2 2
(10)
where Δx is the iterative step of the specific absorption coefficient of the fluorophore, ΔD is the difference between the actual fluorescence intensity incident on the detectors and the fluorescence intensity obtained from the reverse calculation. In the reverse calculation, the fluorescence Jacobi matrix element with respect to an unknown voxel v f can be obtained by taking the differential of Eq. (8), yielding s
vf
J sd =
i =1
∂wiv
em
(p ) n
∂μ afv
f
η
s
=
f
k +t
w (p ) μ P ex
i
i =1
n
ex
sv f
m =k
A
PI ( sˆm −1 ⋅ sˆm )
( sˆ
m −1
⋅ sˆm , g v
ex f
1 − μ )
k +t
afv f
l ( p m =k
k −1
→ pm
) exp ( − μ
afv f
)
(11)
l ( p k −1 → p m ) .
where s is the total number of photons that propagate from the source at rs , are excited in voxel v f and are detected at rd . 2.2 Three-level parallel architecture scheme for fDOT image reconstruction In order to obtain the accurate image reconstruction results, a large number of photons must be simulated in the forward calculation. Furthermore, the stored information about the photons’ states when they reach the detectors and their paths in the tissue must be imported to calculate the Jacobi matrix, and then image reconstruction results are obtained by iteration in the reverse calculation. Obviously, this task is computationally intensive task. The calculations for each photon are independent from one another. Since the process of fDOT image reconstruction is well suited to parallel calculation, we ported the program executed by
#247350 (C) 2015 OSA
Received 4 Aug 2015; revised 12 Sep 2015; accepted 13 Sep 2015; published 24 Sep 2015 5 Oct 2015 | Vol. 23, No. 20 | DOI:10.1364/OE.23.025996 | OPTICS EXPRESS 26001
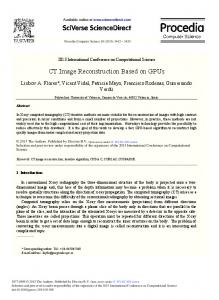
CPUs in serial to three-level parallel architecture in parallel execution, thus greatly reducing the image reconstruction time. In Fig. 1(a), we show the developed three-level parallel architecture, which can analyze in parallel multiple nodes in cluster, multiple cores in CPU, and multiple streaming multiprocessors (SMs) in GPU. The implementation process for the three-level parallel architecture is as follows. 1. By employing a Message Passing Interface (MPI), multiple nodes in cluster can be coordinated to execute a program in parallel. The specific steps are as follows. (1) Each computer is regarded as a node. Node 0 is regarded as the host node, while the other nodes are regarded as the child node. Each node obtains information about its own number and type of GPUs. (2) Each child node transfers the information about its own number and type of GPUs to the host node. (3) According to the GPU number and type at each child node, the host node assigns computing tasks to the child nodes. 2. By using Open Multi-Processing (OpenMP), multiple cores in CPU can be coordinated to execute a program in parallel. The specific steps are as follows: (1) The CPU on each node starts with a number of processes that corresponds to the number of GPUs. Each CPU core is assigned a process, thus enabling the multiple cores to function in parallel in CPU. (2) The CPU further assigns the computing tasks to each GPU. 3. Compute unified device architecture (CUDA) can be utilized to coordinate multiple streaming multiprocessor in GPU to execute a program in parallel. The specific steps are as follows: (1) According to the type of GPU, the available resources in each streaming multiprocessor is determined. According to the program, the amount of resource used in each streaming multiprocessor is determined. (2) According to the scale of the task, the dimension and size of the grid and block in each streaming multiprocessor is determined. (3) The GPU further assigns the computing tasks to each streaming multiprocessor. In Fig. 1(b), we present a schematic of fDOT image reconstruction on single child node. The specific process used for fDOT image reconstruction in the three-level parallel architecture is as follows: 1. The parallel MPI environment is initialized, and the child node obtains information about its own number and type of GPUs, transfers the information to the host node, and receives the serial numbers of the sources to be calculated from the host node. 2. The parallel Open MP environment is initialized, and the multi-core CPU on the child node starts the number of processes corresponding to its number of GPUs and assigns the serial numbers of the sources to be calculated to each process. 3. The parallel CUDA environment is initialized, and the number of blocks in each grid and the number of threads in each block is determined according to the available resources in streaming multiprocessor on GPU. The child node reads the number of photons to be calculated for each source. Each photon is processed on single thread.
#247350 (C) 2015 OSA
Received 4 Aug 2015; revised 12 Sep 2015; accepted 13 Sep 2015; published 24 Sep 2015 5 Oct 2015 | Vol. 23, No. 20 | DOI:10.1364/OE.23.025996 | OPTICS EXPRESS 26002
4. In the forward calculation, the transmission of each photon through the biological tissue is tracked on each thread. In the reverse calculation, the contribution of each photon to the Jacobi matrix is calculated on each thread. 5. After the computing tasks have been completed on each thread, in the forward calculation, the child node writes the information about the photon’s path in the tissue and its state on the detector onto its disk. In the reverse calculation, the child node calculates the corresponding vector and transfers them to the host node. The image reconstruction results can then be obtained by performing the conjugate gradient method on the host node.
Fig. 1. (a) Three-level parallel architecture. (b) Implementation of fDOT image reconstruction on single child node.
2.3 Programmatic implementation of three-level parallel architecture In the forward calculation, it is necessary to read the initial information about each photon, size of the tissue model, optical parameters of the tissue and store the information about each photon’s state on the detector and its path in the tissue. In the reverse calculation, it is necessary to read the information about each photon’s state on the detector and its path in the tissue. Due to the large amount of data acquired in the three-level parallel calculation method, it is particularly important to efficiently store, read/write, and transfer the data. In the following section, we will discuss data processing in this method.
#247350 (C) 2015 OSA
Received 4 Aug 2015; revised 12 Sep 2015; accepted 13 Sep 2015; published 24 Sep 2015 5 Oct 2015 | Vol. 23, No. 20 | DOI:10.1364/OE.23.025996 | OPTICS EXPRESS 26003
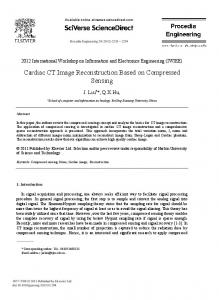
2.3.1 Allocation of memory CUDA has a specific memory model in which each thread has its own registers and each block has its own shared memory. All threads in the grid can access the global memory, constant memory, and texture memory. The read/write speeds of the different memory types vary significantly. The read/write speed of global memory is the slowest, but its memory space is the greatest among the aforementioned memory types. To implement programs, it is preferred to use high-speed memory. The allocation of memory is shown in Fig. 2. The register and shared memory are used to store temporary variables. The global memory is used to store the information about the photon states on the detectors. Constant memory can be used to store the initial information about the photon, the size of the tissue model, and the optical parameters of the tissue, while texture memory can be used to store the index of the tissue model, as all of these quantities only need to be read [24,29]. The amount of information about the photons’ path in the tissue to be stored is large and must be copied from the CPU memory to the GPU memory in the forward calculation. Data copying requires significant time. The page-locked host memory located at the CPU can be mapped into the address space of the GPU, eliminating the need to copy it to or from the GPU memory [30]. Thus, there is no need to allocate memory on the GPU. Hence, in order to save data-copying time, the page-locked host memory can be used to store information about the photons’ path in the tissue.
Fig. 2. Scheme of memory allocation.
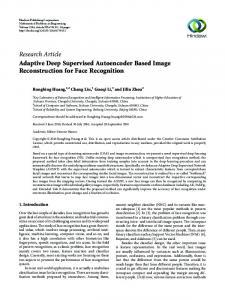
2.3.2 Eliminating the data-writing time As shown in Fig. 3(a), in the original forward calculation time flow, one CPU core on each node starts a process to call the GPU and simulate the photon transport in the biological tissue. After the simulation has been completed, the information about the photons’ states on the detectors and their paths in the tissue is copied from the GPU memory to the CPU memory and is written onto the disk. This process is called a simulation cycle. Thus, a simulation cycle includes GPU computing time, data-copying time, and data-writing time. From Fig. 3(a), it is apparent that the CPU resources are not fully utilized and that the data-
#247350 (C) 2015 OSA
Received 4 Aug 2015; revised 12 Sep 2015; accepted 13 Sep 2015; published 24 Sep 2015 5 Oct 2015 | Vol. 23, No. 20 | DOI:10.1364/OE.23.025996 | OPTICS EXPRESS 26004
writing time occupies a large proportion of the time consumed by each simulation cycle. In order to accelerate the calculations, we optimized the forward calculation time flow. As shown in Fig. 3(b), in the optimized time flow, one CPU core starts a process to call the GPU to simulate the photon transport in the biological tissue and complete the data-copying. At the same time, the other core starts a process to write onto the disk the stored information from the previous simulation cycle about the photons’ states on the detectors and their paths in the tissue. After both of these tasks have been completed for both processes, the simulation cycle ends. In Fig. 3(b), it is apparent that, after optimizing the time flow, the parallelism of the entire simulation is maximized and the time required for one simulation cycle can be reduced from TA to TB .
Fig. 3. (a) Original time flow of forward calculation process. (b) Optimized time flow of forward calculation process.
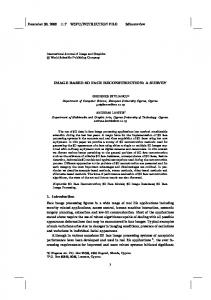
2.3.3 Minimization of data transport per iteration In the forward calculation, each node only stores the state and path information for photons propagated from a portion of the sources. Thus, in the reverse calculation, each node only calculates one block of the Jacobi matrix. If the block of the Jacobi matrix on each child node is transferred to the host node and the total iteration process is completed on the host node, then the amount of data transferred will be immense and the computational burden on the host node will be excessive. As shown in Fig. 4, our technique uses the conjugate gradient method [31] to perform iterative reconstruction on the three-level parallel architecture. As shown, only a portion of the computing tasks are assigned to each node. Thus, the amount of data transfer and the memory space required in the host node are reduced. The specific steps are as follows: 1. Each child node initializes iteration step x 0 for the specific absorption coefficient of the fluorophore and calculates the vector J iT J i x 0 − J iT ΔD i , where i is the serial number of the node. After that, it is transferred to the host node to calculate ∇f ( x 0 ) . The calculation process on the host node is as follows:
#247350 (C) 2015 OSA
Received 4 Aug 2015; revised 12 Sep 2015; accepted 13 Sep 2015; published 24 Sep 2015 5 Oct 2015 | Vol. 23, No. 20 | DOI:10.1364/OE.23.025996 | OPTICS EXPRESS 26005
∇f ( x 0 ) = Hx 0 + b
= ( J T J +λ ) x 0 − J T ΔD
.
(
)
(12)
n -1
= ( J 0T J 0 + λ ) x 0 − J 0T ΔD 0 + ( J iT J i x 0 − J iT ΔD i ) i =1
where n is the total number of nodes. 2. The host node judges whether iteration step x k minimizes the objective function, where k is the index of the iteration. If the value of g k is less than the threshold, 2
the iteration ends; otherwise, the algorithm proceeds to the third step. Here, g k = ∇f ( x k ) . 3. The search direction s k is calculated on the host node and transferred to each child node. If k = 0 , then s 0 = −∇f ( x 0 ) = − g 0 . If k > 0 , then s k = − g k + β k −1 s k −1 .
4. The vector J iT J i s k is calculated on each child node. After that, it is transferred to the host node to calculate Hs k . The calculation process on the host node is as follows: Hs k = ( J T J +λ ) s k
(13)
n -1
= ( J 0T J 0 + λ ) s k + ( J iT J i s k ). i =1
(g ) s =− ( s ) Hs k T
5. The intermediate variable mk
k T
k k
, g
k +1
= g + Hs m , and β k = k
k
k
2
g k +1 gk
2
are calculated on the host node in order. 6. A new iterative step is determined by x k +1 = x k + mk s k on the host node, and the algorithm returns to step 2.
#247350 (C) 2015 OSA
Received 4 Aug 2015; revised 12 Sep 2015; accepted 13 Sep 2015; published 24 Sep 2015 5 Oct 2015 | Vol. 23, No. 20 | DOI:10.1364/OE.23.025996 | OPTICS EXPRESS 26006
Fig. 4. Implementation of one iteration of data transport in conjugate gradient method on threelevel parallel architecture.
3. Results
The three-level parallel architecture cluster we built has three nodes. The first node has a sixcore Intel E5-2630 v2 CPU with 32 GB of RAM. It contains two GPUs (Quadro K4000), and the GPU with 768 CUDA cores has four streaming multiprocessors. The second node has a six-core Intel Xeon X5680 with 32 GB of RAM. It contains two GPUs (GTX770), and the GPU with 1536 CUDA cores has eight streaming multiprocessors. The third node has a fourcore Intel i7-2600 CPU with 16 GB of RAM. It contains two GPUs (GTX670), and the GPU with 1344 CUDA cores has seven streaming multiprocessors. 3.1 Image reconstruction time for cylindrical model We tested the three-level-parallel-architecture fDOT image reconstruction through simulation experiments. The designed cylinder model is homogeneous, as shown in Fig. 5(a). It contains three fluorescent targets with different specific absorption coefficients. In general, the optical parameters at the excitation and emission wavelengths are considered to be the same [14,15], so we set μa = μaex = μaem and μ s = μ sex = μ sem . The quantum efficiency was set to 1, and the
#247350 (C) 2015 OSA
Received 4 Aug 2015; revised 12 Sep 2015; accepted 13 Sep 2015; published 24 Sep 2015 5 Oct 2015 | Vol. 23, No. 20 | DOI:10.1364/OE.23.025996 | OPTICS EXPRESS 26007
other optical parameters used in the simulation are shown in Table 1 [13,14,32]. The cylinder model is 2.0 cm × 2.0 cm × 3.0 cm in size and was discretized into 12,000 voxels, which were each 0.1 cm in size. The reconstructed region, which is 12 mm in height, was discretized into 3,660 voxels. In the fDOT image reconstruction, we simulated 120 sources that were 10 mm in height and were located at azimuthal angles ranging from 0° to 360° . The sources were evenly distributed in six rings with 20 sources in each ring. We selected 240 detectors that were 20 mm in height and were located at azimuthal angles ranging from 0° to 360° . The 240 sources were evenly distributed in 10 layers with 24 detectors in each layer. For each source, 2 × 10⁶ photons were simulated. Table 1. Optical parameters of the cylindrical model used in the simulations
Object
n
Background Fluorescent target (F1) Fluorescent target (F2) Fluorescent target (F3)
1.37 1.37 1.37 1.37
μ s cm 80 80 80 80
−1
μa cm
−1
0.08 0.08 0.08 0.08
g 0.9 0.9 0.9 0.9
μ af cm
−1
– 0.2 0.4 0.6
Fig. 5. (a) 3D view of cylindrical model. (b) 3D and (c) cross-sectional views of reconstructed concentrations of fluorescent targets. (d) Linear correlation between actual and reconstructed concentrations of fluorescent targets. All images are normalized by the maximum of reconstruction values. The color bar represents the normalized fluorescence concentrations. Table 2. Image reconstruction time
Number
Reconstruction time (min)
1
13.7
2
13.7
3
13.8
4
13.9
5
13.8
Average Time(min)
Standard Deviation
13.78
0.07
According to the number and type of GPUs as well as the read/write performance of the disk on each node, the numbers of sources assigned to the three nodes were 25, 50, and 45. We selected the conjugate gradient method to iterate. The 3D and cross-section (z = 15 mm) image reconstruction results for the concentrations of the fluorescent targets are shown in #247350 (C) 2015 OSA
Received 4 Aug 2015; revised 12 Sep 2015; accepted 13 Sep 2015; published 24 Sep 2015 5 Oct 2015 | Vol. 23, No. 20 | DOI:10.1364/OE.23.025996 | OPTICS EXPRESS 26008
Figs. 5(b) and 5(c), respectively. In Fig. 5(d), the linear correlation between the reconstructed and actual fluorescence concentrations can reach 0.985. For a linear correlation of 0.985, the time required for image reconstruction is shown in Table 2. We repeated the simulation experiments five times, and the standard deviation of the image reconstruction time was determined to be 0.07. 3.2 Factors influencing reconstruction efficiency When the path-history fluorescence Monte Carlo model is used, the image reconstruction efficiency of the three-level parallel architecture is mainly influenced by two factors. Firstly, it is influenced by the optical parameters of the cylinder model, such as the absorption coefficient of the background medium, scattering coefficient of the background medium, and specific absorption coefficient of the fluorescent target. In addition, it is influenced by the fDOT image reconstruction parameters, such as the numbers of sources, detectors, and photons simulated for each source. The pfMC and dfMC models are both path-history fluorescence Monte Carlo models, and they have the similar calculation process. As the numbers of sources and photons increase, the time required for fDOT image reconstruction increases linearly [13]. We mainly studied the effects of the cylinder model optical parameters on the computational efficiency of fDOT image reconstruction. The numbers of sources, detectors, and photons simulated for each source are consistent with those in the case described in 3.1. In the fDOT image reconstruction, the initial specific absorption coefficient of the fluorescent target was set to 0. When the linear correlation between the reconstructed and actual fluorescence concentrations reached 0.98, the iteration ended. The other parameters were held constant, and the effects of the absorption coefficient of the background medium, scattering coefficient of the background medium, and specific absorption coefficient of the fluorescent target on the image reconstruction time were investigated. When the absorption coefficient of the background medium is changed, the experimental results are shown in Table 3 and Fig. 6. When the scattering coefficient of the background medium is changed, the experimental results are shown in Table 4 and Fig. 7. When the specific absorption coefficient of the fluorescent targets are changed, the experimental results are shown in Table 5 and Fig. 8. Table 3. Image reconstruction time for different absorption coefficient of the background −1
medium. The scattering coefficient of the background medium is 80 cm and the specific −1
−1
−1
absorption coefficient of the three fluorescent targets are 0.2 cm , 0.4 cm , 0.6 cm , respectively.
#247350 (C) 2015 OSA
Number
μa cm −1
Average Time(min)
Standard Deviation
1 2 3 4 5
0.04 0.08 0.12 0.16 0.20
13.76 13.78 14.10 14.28 14.58
0.03 0.07 0.12 0.05 0.05
Received 4 Aug 2015; revised 12 Sep 2015; accepted 13 Sep 2015; published 24 Sep 2015 5 Oct 2015 | Vol. 23, No. 20 | DOI:10.1364/OE.23.025996 | OPTICS EXPRESS 26009
Fig. 6. Image reconstruction time versus absorption coefficient of the background medium. Table 4. Image reconstruction time for different scattering coefficient of the background −1
medium. The absorption coefficient of the background medium is 0.08 cm and the −1
−1
specific absorption coefficient of the three fluorescent targets are 0.2 cm , 0.4 cm , −1
0.6 cm , respectively.
Number
μ s cm −1
Average Time(min)
Standard Deviation
1 2 3 4 5
80 100 120 140 160
13.78 16.98 19.68 21.72 25.50
0.07 0.05 0.06 0.05 0.10
Fig. 7. Image reconstruction time versus scattering coefficient of the background medium. Table 5. Image reconstruction time for different specific absorption coefficient of the three fluorescent targets. The absorption and scattering coefficient of the background medium are 0.08 cm
Number 1 2 3 4 5
#247350 (C) 2015 OSA
μ af cm (F1) 0.1 0.2 0.3 0.4 0.5
−1
μ af cm (F2) 0.2 0.4 0.6 0.8 1.0
−1
−1
−1
and 80 cm , respectively.
μ af cm (F3) 0.3 0.6 0.9 1.2 1.5
−1
Average Time(min)
Standard Deviation
9.22 13.78 18.18 20.72 25.30
0.16 0.07 0.08 0.04 0.03
Received 4 Aug 2015; revised 12 Sep 2015; accepted 13 Sep 2015; published 24 Sep 2015 5 Oct 2015 | Vol. 23, No. 20 | DOI:10.1364/OE.23.025996 | OPTICS EXPRESS 26010
Fig. 8. Image reconstruction time versus varied ratio of specific absorption coefficient of the three fluorescent targets.
4. Discussion and conclusions
In Figs. 5(b) and 5(c), it is evident that the reconstructed and actual fluorescent target positions are very close to each other. In Fig. 5(d), the linear correlation between the reconstructed and actual fluorescent target concentrations is high. The image reconstruction results confirm that three-level parallel architecture fDOT image reconstruction can recover the positions and concentrations of fluorescent targets correctly. From Table 2, it is evident that the image reconstruction time is very stable. Its minor variation mainly originates from the random changes in the read/write speed of the disk over time. Thus, the use of three-level parallel architecture reduces the image reconstruction time to an acceptable level. As shown in Table 3 and Fig. 6, as the absorption coefficient of the background medium increases, the image reconstruction time is stable at first and then increases slightly. This trend appears because, as the absorption coefficient of the background medium increases, the number of photons that reach the detector decreases. Therefore, to achieve the same reconstructed accuracy, more iterations are needed. Table 4 and Fig. 7 demonstrate that, as the scattering coefficient of the background medium increases, the image reconstruction time increases. This increase is present because a larger scattering coefficient of the background medium corresponds to longer photon paths through the voxels and, hence, a greater amount of path information that must be read/written. In Table 5 and Fig. 8, when the initial specific absorption coefficient of the fluorescent target in the iteration is set to 0, the image reconstruction time increases linearly as the specific absorption coefficient of the fluorescent target increases. This increase is caused because, with a fixed iteration step size, when the actual specific absorption coefficient of the fluorescent target is closer to the initial value, the iteration proceeds faster. In conclusion, utilizing general-purpose computing platforms, we developed the threelevel parallel architecture to accelerate fDOT image reconstruction based on path-history fluorescence Monte Carlo model. Through the simulation experiments, we demonstrated the stability and efficiency of the three-level parallel architecture fDOT image reconstruction. With the development of electronic technology, the CPU and GPU performances can be further improved. In addition, if the numbers of nodes and of CPUs are increased, the image reconstruction time can be further reduced. This accelerating method of fDOT image reconstruction based on path-history fluorescence Monte Carlo model will potentially be useful for in vivo optical imaging in the future. Acknowledgments
This work was supported by National Major Scientific Research Program of China (No. 2011CB910401), National Key Scientific Instrument & Equipment Development Program of China (No. 2012YQ030260), Science Fund for Creative Research Group (No. 61421064), and National Natural Science Fund (No. 61078072).
#247350 (C) 2015 OSA
Received 4 Aug 2015; revised 12 Sep 2015; accepted 13 Sep 2015; published 24 Sep 2015 5 Oct 2015 | Vol. 23, No. 20 | DOI:10.1364/OE.23.025996 | OPTICS EXPRESS 26011