finished in 2004. 1.2 Estimating forest parameters with kNN. Country-wide mapping of forest variables using satellite data had a successful beginning in Finland, ...
Automated estimation of forest parameters for Sweden using Landsat data and the kNN algorithm H. Reese, T. Granqvist-Pahlén*, M. Egberth, M. Nilsson, H. Olsson Remote Sensing Laboratory, Department of Forest Resource Management and Geomatics, Swedish University of Agricultural Sciences, SE-901 83 Umeå, SWEDEN– (Heather.Reese, Tina.Granqvist.Pahlen, Mikael.Egberth, Mats.Nilsson, Hakan.Olsson)@resgeom.slu.se
Abstract – The project “kNN-Sweden” has mapped forest parameters, such as wood volume, age, and height over Sweden. Landsat ETM satellite data from 2000, digital map data, and forest inventory data were combined to produce continuous estimates of forest parameters. The method for estimating the forest parameters was a ”kNearest Neighbor” algorithm. Reference data were obtained from the Swedish National Forest Inventory. The project was completed through use of an automated production-line, written in-house. The production-line includes steps such as haze reduction and topographic correction of the satellite data, as well as updating of the inventory data. The end product results in several raster files including total wood volume; volume for Norway spruce, Scots pine, birch, lodgepole pine, beech, and oak; height; and, age. Spin-off products, such as dominant tree species, stand delineation through generalisation of the data, and base information for property taxation are made. Future directions are estimation using SPOT data and neural network implementation. Keywords: kNN, estimation, forest parameters, automation 1.
INTRODUCTION
The requests for current digital and detailed information about the Swedish forests are increasing in parallel to the growing use of Geographic Information Systems (GIS). The existing wood volume for a certain area, the age of stands, or the tree species composition are of interest to many different users. Forest owners, buyers of timber, energy forest interests, researchers and public agencies within the environmental, nature conservation, and forestry branches need information in order to follow changes, forecast future scenarios, or for use in decision-making. They need information on areas of varying scales, whether that is a stand, an estate, a watershed, a county, province, or the entire country. They have a common wish to use current digital information with an acceptable and known accuracy, provided at as low a price as possible. 1.1 Objectives The objective of the kNN-Sweden project was to meet the needs of Sweden’s users of forest information by providing nationwide digital data about forest variables for the country in a time-efficient manner. The forest variables were to be total wood volume, wood volume by species, age, and height. This dataset was to be created from Landsat ETM images from as near the year 2000 as possible. By combining satellite images with the National Forest Inventory (NFI) in an automated production system, a dataset of continuous values for each of the forest variables could be produced. The production system will also allow easier updating of the dataset, which is aimed to be done every 5 years (Granqvist-
Pahlén et al., 2004). Additional “spin-off” products have also been created, such as volume-based dominant-tree species maps, a generalization into forest stands based on the forest variables and data usable as a basis in forest taxation by the Swedish tax authorities. The national kNN product was finished in 2004. 1.2 Estimating forest parameters with kNN Country-wide mapping of forest variables using satellite data had a successful beginning in Finland, with the first operative multi-source inventory in 1990 (Tomppo 1993). The method used in Finland is termed the “kNN” or “k-Nearest Neighbor” method (Tomppo 1993), which is also referred to as the Reference Sample Plot method (Killki, and Päivinen, 1987). Development work using similar methods as in Finland was started at SLU around 1992 (Nilsson 1997). A review of several smaller-area projects leading up to the nationwide kNN-Sweden project can be read about in Reese et al., 2002. 1.3 The Swedish forest landscape The forests of Sweden cover 22.6 million ha of the 41.0 million ha land area (Skogsstyrelsen, 2003). The forests are primarily boreal forests in middle and northern Sweden, and more dominated by broad-leaved species in the southern tip of Sweden. Forestry is a dominant activity in Sweden, both privately and commercially with around 3 billion m3/ha cut per year (Skogsstyrelsen, 2003). The mean stand size is approximately 2 ha in the south and 10 ha in the north of Sweden. Mountains and mountain vegetation in Sweden cover an area of approximately 4.4 million ha and is dominated primarily by heath vegetation. Wetlands cover 4.6 million ha and agricultural land covers 3.5 million ha (Skogsstyrelsen, 2003). 2.
DATA
The materials used in producing the forest variables are a combination of satellite data, National Forest Inventory plots, and map data. Each of these materials is described below. 2.1 Landsat ETM Satellite data from Landsat 7 Enhanced Thematic Mapper (ETM) have been used in this project. Landsat 7 data cover a swath width of 185 km in eight different wavelength bands. In the kNN-Sweden project, bands 3, 4, 5 and 7 are used for the estimations. The satellite data are geometrically precisioncorrected by the Swedish National Mapping Agency to the Swedish National Grid (RT90) with an overall geometric error of one pixel, and resampled to 25m x 25m pixels. Most of the images were provided through the European-wide Image 2000 dataset, administered by the European Environmental Agency (EEA). To cover Sweden completely with satellite data requires approximately 30 Landsat TM scenes.
2.2 NFI The field data are taken from the Swedish NFI that is an annual national field sample of forest variables. It is based on a systematic grid across the country consisting of square clusters with eight to twelve circular sample plots (Ranneby et al., 1987). The clusters vary in size for different regions of Sweden (Anon., 2004). The coordinates for the NFI plots have been recorded in field using the Global Positioning System (GPS) since 1996. The GPS recordings are differentially corrected, giving a positional accuracy between 5 and 6.5 meters RMSE (Reese et al., 2003). 2.3 Map data Digital map data from 1:100,000 scale topographic maps are used to create a forest mask, as only forest land is estimated. Non-forest land areas are excluded from the analysis using the map data. 3.
METHODS
The methods used to produce the forest variable estimates involve several steps. These processes are carried out using a production line (called “Munin”) programmed at SLU. The separate steps and methods are described in this section. 3.1 Pre-processing in Munin Two pre-processing steps are automatically carried out on the satellite data. A haze correction is done by calculating a hazeindex based on the satellite image’s digital values over forests and relating it to NFI plots with known forest properties (Hagner and Olsson, 2004). In addition, an illumination correction is performed using the c-correction (Teillet et al., 1982). A subset of NFI plots is extracted over a scene’s geographic extent. Plot data is generally taken from a six-year time span however, if necessary, plot data from up to a ten-year time span can be used in order to give a larger number of reference plots. Forest variables such as volume, biomass, age, ground moisture, site quality and field layer are extracted for each NFI plot. A growth function (standard deviation calculated to be about 10 per cent) projecting 5-year growth (Söderberg 1986) is applied to stem volume measurements to reconcile the differences between the image acquisition date and the date the NFI plots were inventoried. Errors due to poor geographic location of the NFI plot or the satellite data, change in vegetation over time, or atmospheric conditions are corrected for by using image to plot matching, and regression to eliminate outlier plot data. 3.2 kNN Using the NFI plot dataset with outliers removed, total wood volume; wood volume for the species Norway spruce, Scots pine, Lodgepole pine, birch, oak, beech, and other deciduous species; age; and tree height are calculated for every pixel under the forest map mask. This is done using the kNN algorithm. With kNN, the estimated forest variable value for each pixel is calculated as a weighted mean value of the reference plots’ forest variable of the k nearest samples in spectral space. Weights, which are proportional to the inversesquared Euclidean distance between the spectral values of the pixel to be estimated and the reference plot, are assigned to
each of the k samples. In the country-wide estimates for Sweden, k = 15 has been chosen, based on previous studies and experiences at SLU (Reese et al., 2003). 3.3 Accuracy assessment Because all NFI plots are used in the estimation of each scene and none are reserved for an accuracy assessment, a crossvalidation method is used for evaluation of the accuracy on the pixel level for each individual scene. For every forest variable produced, a RMSE is calculated. If errors are not acceptable, the scene may be estimated again, for example by using plots from a ten-year time period and the cross-validation results are re-evaluated. 3.4 Generalization of kNN A generalization of the kNN data into more homogenous “stands” is done for each scene in an automated process where the satellite image is segmented using a T-statistic (Hagner 1990). The process is actually done in several steps: a presegmentation, an aggregation of these segments into homogenous areas, and assignment of statistics for each segment from the kNN data, such as mean value and standard deviation for each forest parameter. The minimum size of segments is 0.5 ha and a maximum of 50m. The resulting mean size of segments is 2 ha in southern Sweden and 10 ha in northern Sweden. 3.5 General property taxation In 2003, a project was undertaken where kNN estimates of forest volume were used as an information base in assessing real estate values for tax purposes. This is part of the general assessment of farm holdings for 2005. Briefly, the assessment procedure involves each owner of farm holdings checking and making necessary changes to reporting of their forest data according to a real estate tax form provided by the Swedish Tax Agency. If the forest owner does not accept the figures proposed by the Tax Agency, they should provide new data. One way of assessing these new data is to relate the forest condition on the property to the average data given for that district (called the “value district”) in which the property is situated. The size of a value district is between 2000 ha and 400 000 ha. 4.
RESULTS AND DISCUSSION
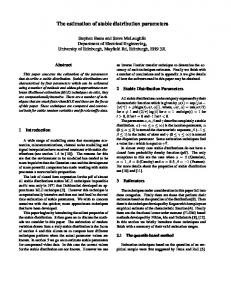
kNN-Sweden gives a current picture of what the Swedish forest looks like in the year 2000 (Figure 1). It covers 96% of the country (some small areas not covered). The information for each variable is stored in a separate raster layer, with a spatial resolution of 25x25m (single pixel resolution). It should be mentioned that the kNN dataset is not intended for use for very small areas. In previous studies, it has been shown that at the pixel level the data have an RMSE ranging from 58% to 80% for total wood volume (Reese et al., 2002). It is best to use the estimates for areas of 100 ha or larger, where the mean error for total wood volume is around 10-15%. Reasons for error can be connected to any number of sources, such as errors in the field data, issues with the satellite data, the map data or even the calculation method. Higher volumes tend to be under-estimated in the kNN data due difficulties in estimating volume beyond a certain closing of the canopy.
efficiency of the MUNIN program itself. Use of SPOT data will require spectral calibration of SPOT scenes in order to use NFI plots from adjacent scenes with different dates. 5. CONCLUSIONS A nationwide coverage of continuous estimates of forest variables has been produced using the automated production line “Munin”. The use of a production line allowed the efficient processing of over 30 Landsat scenes and corresponding forest inventory data for production of these maps. The kNN data provide useful information to multiple users and agencies, and products such as stand maps and base information for taxation have been developed. The kNN data have some short-comings when it comes to error levels and should be used at an aggregated scale as opposed to the pixel level. The planned repetition to update the kNN-Sweden dataset will try to improve the estimations through developing an automated production line using neural networks and capable of processing SPOT data. 6. ACKNOWLEDGEMENTS
Figure 1. The nationwide kNN estimates of forest parameters. Over-estimation of lower volumes also occurs. Forest types that are less prevalent in the field data, such as older broadleaved forest, tend to be under-represented in the kNN data. For the property taxation application, the average forest volume of coniferous trees and deciduous trees for all value districts in Sweden were calculated based on calibrated kNN data (Nilsson et. al., 2004). The kNN estimates for coniferous and deciduous forest were calibrated on a county level to match statistics reported from the NFI based on field data collected between 1998 and 2002. The reason for calibrating the kNN estimates was that a comparison forest volume estimates for counties derived using uncalibrated kNN data, NFI data post-stratified using kNN data (uncalibrated), and NFI data alone showed that the use of uncalibrated kNN data led to systematic errors in the estimations (10% lower overall for coniferous forest). The results also showed that using poststratification with strata created from the kNN data led to an improvement at the county-level of 35-40% of the total wood volume statistics as compared to using NFI data alone. The reason for using calibrated kNN data and not post-stratified NFI data or NFI data alone was that there were too few NFI plots within many of the value districts whereas the kNN data gave complete area coverage over the whole value district. Preparations for a repetition of the kNN project began in 2005. Due to problems with the Landsat 7 sensor, a method which can be used with SPOT data will be developed. Earlier problems seen with the first run of kNN-Sweden warrant improvement, primarily through replacement of the kNN method with neural networks and an improvement in the
The work on kNN, kNN generalization, and the AFT (taxation) project has been funded from several sources: the Swedish research program Remote Sensing for the Environment (RESE), financed by the Swedish Foundation for Strategic Environmental Research (MISTRA); the Swedish National Space Board; the Swedish National Forest Inventory; County Administration Boards (Dalarna, Gävleborg, and Norbotten); Regional Forestry Board of Norrbotten; the Swedish National Board of Forestry; and the Swedish Nature Protection Agency. Thanks to J. Engberg and J. Bolin for their work on generalization and AFT projects. 7. REFERENCES Anonymous. 2004. Instruktion för Fältarbetet vid Risksskogstaxeringen. Swedish University of Agricultural Sciences, Department of forest resource management and geomatics, Umeå, Sweden. Granqvist-Pahlén, T., Nilsson, M., Egberth, M., Hagner, O.,and Olsson, H., 2004. kNN-Sverige: Aktuella kartdata över skogsmarken. Fakta Skog, Swedish University of Agricultural Sciences, Umeå. Nr. 12, 2004. 4 p. Hagner, O. and Olsson, H., 2004. Normalization of withinscene optical depth levels in multi-spectral satellite imagery using National Forest Inventory plot data. In Proceedings from the 24th EARSeL Symposium, Workshop on "Remote sensing of land use and land cover", Dubrovnik, Croatia, May 28-29, 2004. Hagner, O. 1990. Computer aided forest stand delineation and inventory based on satellite remote sensing. In: SNS/IUFRO workshop, The Usability of Remote Sensing for Forest Inventory and Planning, Umeå, Sweden. p.94-105. Killki, P. and Päivinen, R. 1987. Reference sample plots to combine field measurements and satellite data in forest inventory. In: Remote Sensing-Aided Forest Inventory.
Seminars organised by SNS and Taksaattoriklubi, Hyytiälä, Finland, pp. 209-212. Nilsson, M. 1997. Estimation of forest variables using satellite image data and airborne Lidar. Acta Universitatis Agriculturae Suecia. Silvestria 17. Swedish University of Agricultural Sciences. Department of forest resource management and geomatics, Umeå, Sweden. Nilsson, M., Bohlin, J., Olsson, H., Svensson, S.A., and Haapaniemi, M. 2004. Operational use of remote sensing for regional level assessment of forest estate values. In Proceedings from the 24’th EARSeL Symposium, Dubrovnik, Croatia. Ranneby, B., Cruse, T., Hägglund, B., Jonasson, H., and Swärd, J. 1987. Designing a new national forest survey for Sweden. Studia Forestalia Suecica, No. 177. Swedish University of Agricultural Sciences, Faculty of Forestry, Uppsala, Sweden. Reese, H., Nilsson, M., Granqvist Pahlén, T., Hagner, O., Joyce, S., Tingelöf, U., Egberth, M., and Olsson, H., 2003. Countrywide estimates of forest variables using satellite data and field data from the National Forest Inventory. Ambio, 32(8):542-548.
Reese, H., Nilsson, M., Sandström, P., and Olsson, H. 2002. Applications using estimates of forest parameters derived from satellite and forest inventory data. Computers and Electronics in Agriculture 37(1):37-55. Skogsstyrelsen, 2003. Skogsstatistiksk ärsbok 2003. (Statistical Yearbook of Forestry 2003). Jönköping, Sweden. Söderberg, U. 1986. Functions for forecasting of timber yields – Increment and form height for individual trees of native species in Sweden. (In Swedish with English summary pages 126 – 135) Report No. 14. Swedish University of Agricultural Sciences. Department of Forest Mensuration and Management. Teillet, P.M., Guindon, B., and Goodenough, D.G. 1982. On the slope-aspect correction of multispectral scanner data. Canadian Journal of Remote Sensing 8:84-106. Tomppo, E. 1993. Multi-source National Forest Inventory of Finland. In: Proceedings of Ilvessalo Symposium on National Forest Inventories, August 17-21, Finland. pp. 52-59.