COMPARISON OF OUTLIER DETECTION METHODS IN BIOMEDICAL DATA. In this paper the use of outlier detection methods is discussed. This analysis is an ...
JOURNAL OF MEDICAL INFORMATICS & TECHNOLOGIES Vol. 16/2010, ISSN 1642-6037 outlier detection, medical diagnoses, outlier test
Kornel CHROMIŃSKI, Magdalena TKACZ 1
COMPARISON OF OUTLIER DETECTION METHODS IN BIOMEDICAL DATA In this paper the use of outlier detection methods is discussed. This analysis is an introduction to the use of various methods of outlier detection in medical diagnoses (screening). The authors investigated the usefulness of selected outlier detection methods in the context of detection sensitivity, speed performance analysis and the difficulty of automating the performance analysis by using the test methods for outlier detection.
1. BACKGROUND AND MOTIVATION Routine health tests are commonplace and widespread among adults in almost all of the developed countries – they are a type of screening. It is common knowledge that prevention is less expensive than treatment, and the detection of any disease in its early stages of development gives the patient a greater chance of treatment and convalescence than discovering the disease in an advanced stage of development. Even if we do not know how to heal the patient, the treatment will be helpful and will provide life comfort. One very important aspect of the health routine test is the blood count. The results of this test are the first that the physician takes into account to determine the patient’s overall health. The standard ranges for any blood count tests are well known. Current analytical laboratory equipment is computerized – so to do this type of analysis automatically or semi-automatically should be easy. In fact, the laboratory equipment is able to mark a level which is not between the reference level for a certain test. But these marks are set for everyone, a separate parameter – without taking into account other results. That is why every laboratory test has to be examined by a physician, as automatically marked results do not reflect the patient’s general condition. These conditions can be influenced by other factors, such as drugs, other types of treatment or one’s lifestyle. A level different from the reference level should be recognized as correct, or conversely, what is usually recognized as the “normal level” should be detected as inappropriate because of a certain type of treatment. In all of these cases we need to detect all of the values that are different from the rest of the data. In an ideal case the context taken into account from the other data (other tests) should be taken into account during data mining, or knowledge discovery from data. This is the general aim of the authors. The first step is to investigate and appreciate the known methods of anomaly detection (outlier detection). In the experiments described in this paper the authors prepared a special artificial data set with some specially prepared values, i.e. values which should be detected as an anomaly (outlier). The artificial data set was created because the authors wanted to find out the amount of outlier data in the whole data set. The aim of this experiment was to determine which of the known outlier detection methods is the best method for outlier detection. When a certain method is chosen (or methods), it will be tested on real data sets. When these are investigated they can be embedded in a dedicated decision support system design of the speech recognition system Isolated words recognition systems comprise three basic blocks (Fig. 1). The first block is responsible for voice signal acquisition and conversion to a form enabling feature extraction [6, 7, 8]. Within block two, the signal is converted to a form enabling quick and easy storage and classification of the voice word patterns obtained. Block three is responsible for the decision on the signal classification in a correct group or specific pattern from the pattern base [3, 6, 8].
1
University of Silesia, Institute of Computer Science, 41-200 Sosnowiec, ul. Będzińska 39, Poland
MEDICAL DATA ANALYSIS
2. TESTING DATA SET AND TESTED METHODS: A SHORT DESCRIPTION 2.1. PREPARATION OF THE TESTING DATA SET All of the methods were compared using artificial specially prepared data sets which include 80 values. In the data sets 10% of the data (i.e. 8 values) was changed so that this data is different from the rest of the data. These different data were created in two different ways (we have two artificial testing sets). In the first set (called Set 1) the “special” data values were chosen in a random way from the interval:
(5 ⋅ x ;7 ⋅ x )
(1)
where: x
– mean of the data set,
In the second set (called Set 2), the “special” data values were chosen in a random way from the interval:
( Me + x ; Me + 2 ⋅ x )
(2)
where: Me – median, x – mean of the data set.
In Set 1 the difference between the “normal” data and the changed data is bigger than in Set 2 – in this way it was possible to analyze the sensitivity of the tested methods, i.e. whether the method is effective in detecting only extreme outliers or whether it is also effective in detecting mild outliers. The authors wanted to make sure that the values were “out of scope” for the other values and that they would be able to test the “sensitivity” of the selected methods on outliers with different “weights” (different values). Our test should allow us to find out if (and how many) outliers the tested method will be able to detect. 2.2. METHODS FOR OUTLIER DETECTION TESTED IN THIS PAPER In this section all of the tested methods are briefly presented. A description of a method consists of information about the method and the way of counting by testing the method with a formula necessary to find the outliers. The last part of the method description discusses the certain conditions under which a decision whether the checked data is/are outlier(s) or not is made. 2.2.1. GRUBB’S TEST [1, 2] Grubb’s Test is a test based on normal distribution, the effects of which are that the data analyzed with this method should have normal distribution. The name of this test comes from the author’s name – Frank Grubbs. This test should be performed as long as all outliers will be detected. In this test we have two hypotheses: the null-hypothesis (H0) and the alternative hypothesis (H1): H0: There are no outliers in the data set. H1: There is at least one outlier in the data set.
90
MEDICAL DATA ANALYSIS
The general formula for Grubb’s Test can be presented as follows:
G=
max x1 − x i −1... N
σ
(3)
where: xi x σ
– element of the data set, – mean of the data set, – standard deviation of the data set.
The calculated value of parameter G is compared with the critical value for Grubb’s Test. When the calculated value is higher or lower than the critical value for the chosen statistical significance, then the calculated value can be accepted as an outlier. The statistical significance (α) describes the maximum mistake level which a person searching for outliers can accept. 2.2.2. DIXON’S TEST [2, 3, 4] This method was created by J.W. Dixon. This test has some restrictions – it is impossible to use this test with a big data set. Dixon’s Test begins by organizing the data in an ascending order, the next step is to count parameter Q. To use Dixon’s Test we must use a formula to count parameter Q: To check if the first element of the data set is an outlier we use the formula:
Q1 =
x3 − x1 x n − 2 − x1
(4)
To check if the last element of the data set is an outlier we use the formula:
Qn =
xn − xn −2 x n − x3
(5)
where: X 1, 2,3,n− 2,n – are data from the data set.
The calculated value of parameter Q is compared with the Dixon’s Test critical value for the chosen statistical significance. When the calculated value of parameter Q is bigger than the critical value then it is possible to accept the data from the data set as an outlier. 2.2.3. HAMPEL’S TEST [5, 6] To calculate Hampel’s Test statistical tables are not necessary. Theoretically, this method is resistant, which means that it is not sensitive to outliers (the quantity and value of the outliers should not affect the Hampel’s Test effectiveness), it also has no restrictions as to the abundance of the data set. The steps to perform Hampel’s Test for a data set are as follows: 1. Calculate the median ( Me ) for the whole data set. The median is described as the numeric value separating the higher half of a data set from the lower half. 2. Calculate the value of deviation ri from the median value; this calculation should be done for all elements from the data set:
ri = ( xi − Me)
(6) 91
MEDICAL DATA ANALYSIS
where:
x i n Me
– simple data from the data set, – belongs to the set for 1 to n, – number of all element of the set, – median.
3.
Calculate the median for deviation Me ri
4.
Check the condition:
| ri |≥ 4.5 Me|ri |
(7)
When the condition is executed, then the value from the data set can be accepted as an outlier. 2.2.4. QUARTILE METHOD [7] In this method (as in Hampel’s Test) there is no need to use statistical tables. To find an outlier using the Quartile Method it is necessary to carry out the following steps: 1. Find the upper quartile – Q3 – 75% of data in the data set are lower than this. 2. Find the lower quartile – Q1 – 25% of data in the data set are higher than this. 3. Calculate the gap between the quartiles:
H = Q3 − Q1
(8)
a. A value lower than Q1 − 1.5 ⋅ H and higher than Q3 + 1.5 ⋅ H is considered to be a mild outlier. b. A value lower than Q1 − 3 ⋅ H and higher than Q3 + 3 ⋅ H is considered to be an extreme outlier.
3. EXPERIMENT RESULTS In this part the results of the experiments are presented. All of the methods described above have been tested in the context of finding outliers in two prepared data sets. The experiment was carried out to: • find the sensitivity of each tested method, • find the time that is necessary for outlier(s) detection, • compare the effectiveness of every method. All of these factors should let us identify the fastest and most efficient method. For the purpose of our experiment, for every tested method a script (in “The R”) was written – this allowed us to automate the testing procedure. Developing our own code for all of the methods also allowed us to count the computational time for every package (method) in the same environment. In the first part of the experiment, the sensitivity of all the methods was checked. The results, i.e. the number of outliers found (in both sets), are summarized in Table 1. Based on this test’s results we can notice that two methods, i.e. Hampel’s Test and the Quartile Method, have 100% efficiency in finding outliers (using both Set 1 and Set 2) for mild outliers. All 8 outliers (in both sets) were found with these two methods. This means that these two methods are the most sensitive of all the tested methods. A less sensitive method proved to be the Dixon’s Test – it was less sensitive for all of the testing significance levels.
92
MEDICAL DATA ANALYSIS Table 1. Number of detected outliers for particular methods.
Method Grubb’s Test α=0.05 Grubb’s Test α=0.01 Dixon’s Test α=0.05 Dixon’s Test α=0.01 Dixon’s Test α=0.2 Hampel Test Quartile Method (1.5*H) Quartile Method (3*H)
Number of detected outliers Set 1 Set 2 8 7 7 5 2 1 2 0 3 3 8 8 8 8 8 5
The second parameter in the context of testing outlier detection methods was the time needed to find outliers using a certain method. The time was measured four times, the results of which are shown in Table 2. Table 2. Measured time of analyzing a data set with the tested methods.
time (s) Method Grubb’s Test Dixon’s Test Hampel Test Quartile Method
1st 2nd 3rd 4th measurement measurement measurement measurement 0.53 0.52 0.55 0.51 0.42 0.44 0.42 0.43 0.48 0.49 0.46 0.47 0.31 0.33 0.33 0.32
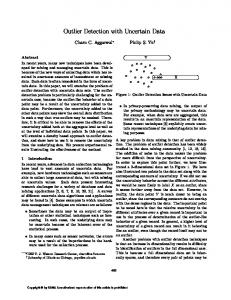
The fastest method (needing the least amount of time to find all the outliers in a testing data set) was the Quartile Method, followed by Dixon’s Test. The worst method, i.e. the slowest method, was Grubb’s Test. For these two data sets (Set 1 and Set 2) time does not differ between the various methods. Yet if we need to use a certain method to find the outliers in a bigger data set then the time parameter can become very important. The average times for the methods are shown in Figure 3.
Fig 1. Average time for the tested methods.
93
MEDICAL DATA ANALYSIS
4. CONCLUSION The tested parameters (sensitivity and time (average)) are summarized in Table 3. Table 3. Experiment summary.
average time (s) Method Grubb’s Test α=0.05 Grubb’s Test α=0.01 Dixon’s Test α=0.05 Dixon’s Test α=0.01 Dixon’s Test α=0.2 Hampel Test Quartile method (1.5·H) Quartile method (3·H)
0.53 0.53 0.43 0.43 0.43 0.47 0.32 0.32
finding outliers 1st set 100% 88% 25% 25% 38% 100% 100% 100%
2nd set 88% 63% 13% 0% 38% 100% 100% 63%
It can be noticed (in Table 3) that the fastest method that allowed us to find all of the outliers (in both data sets) was the Quartile Method for mild outliers. The second method that achieved quite good results in our tests was Hampel’s Test. The running time was not as good as for the Quartile Method but all of the outliers in both testing data sets were detected. Dixon’s Test had the worst results, i.e. this outlier detection method had low sensitivity in our experiments – the maximum number of outliers (for all significance levels there are 3 (3 anomaly values are only 38% for all the outliers in the data set)). Additionally, when we take into account the ease of use (and development) then the easier methods are the Quartile Method and Hampel’s Test because neither one needs statistical tables (special parameters). This analysis is an introduction to the analyses of real multi-dimensional data. The authors would like to use the methods which were effective in this analysis to carry out analyses of blood test results and to investigate how to cope with the problem of checking the context of other data, i.e. relationship between different data values – different analytical or biochemical laboratory information. The authors would also like to find out how a certain method will cope with huge data sets and how sensitive the various methods are to outlier quantities in the data set.
BIBLIOGRAPHY [1] OSTASIEWICZ W., Statistical methods of data analysis (in Polish), Wrocław, Wydawnictwo Akademii Ekonomicznej, 1999. [2] FALLON A., SPADA Ch., Detection and Accommodation of Outliers in Normally Distributed Data Sets, article available online at: http://www.cee.vt.edu/ewr/environmental/teach/smprimer/outlier/outlier.html. [3] TAYLOR J.R., Introduction to the analysis of measurement error , PWN, Warszawa 1999. [4] KONIECZKA P., NAMIEŚNIK J., Evaluation and quality control of analytical measurements, Warszawa, WNT, 2007, (in Polish). [5] REDMAN T. C., Data Quality. The Field Guide, Boston Digital Press, 2001, [6] BEN-GAL I., Outlier detection, Data Mining and Knowledge Discovery Handbook: A Complete Guide for Practitioners and Researchers, Kluwer Academic Publishers, 2005. [7] FILZMOSER P., A multivariate outlier detection method, article available online at: http://computerwranglers.com/Com531/Handouts/Mahalanobis.pdf .
94