Design and Implementation of Wuhan Geospatial Information Sharing Platform Deren Li, Laixing Liu∗, Zhenfeng Shao State Key Laboratory of Information Engineering in Surveying, Mapping, and Remote Sensing, Wuhan University, Wuhan, China, 430079 ABSTRACT Geospatial metadata, data, and services have been widely collected, developed and deployed in recent years. This flourishing of geospatial resources also added to the problem of geospatial heterogeneity. Interoperability research and implementation are needed for advancement in potential solutions to integrate and interoperate these widely dispersed geospatial resources. We design and implement Wuhan Geospatial Information Sharing Platform based on existing WMS. This platform consists of three components: Web Client, Metadata Catalog, and Data Services. Data Services provide WMS. All spatial information from different sources has been published as WMS. These WMS have been described by geospatial metadata compatible with geospatial metadata standard. These geospatial metadata has been stored in Metadata Catalog. Web Client provides functionalities to access and process WMS described by geospatial metadata in Metadata Catalog. Keywords: WebGIS; WMS; catalog service; geospatial information sharing; Web Service
1. INTRODUCTION Geographical Information Systems (GIS) are widely used in government and municipality institutions, resulting in massive increase in the amount of available information. In the local community environments (e.g. city services, local offices, local telecom, public utilities, water and power supply services etc) different information systems deal with huge amount of data, most of which is geo-referenced [1]. Most geospatial resources are separately collected, archived, managed, analyzed, and presented to suit different objectives at geographically dispersed locations and computers. Isolated, application-specific systems can impede the sharing of geospatial resources. The problem of bringing together heterogeneous and distributed information system is known as the interoperability problem [2]. Interoperability is the ability of two or more systems or components to exchange information and to use the information that has been exchanged. The realization of interoperable GISs is difficult process, due to two main system characteristic distributed data sources and their heterogeneity [3]. The distributed geographic information sharing technology includes three models, which are Microsoft’s DCOM (Distributed Component Object Model)/ActiveX, Sun's Java/RMI and OMG's (object management group) CORBA (common object request broker architecture). The ActiveX/DCOM model only runs on the Microsoft Windows platform, and Java/RMI technology localizes on the Java language. In despite of the independency of languages and Operate Systems, CORBA adapts to construct the distributed systems of compact coupling [4]. In a sense, Web Services extend the distributed Objects/Component technology. By contrast with the former Interoperable methods, Web Services accomplish the accesses to objects in the loose coupling circumstances. Web components can implement and publish in any computer which provides corresponding functions and services, and also integrate the heterogeneous applications. Therefore, the technology of Web Services adapts to share the Geo-information of heterogeneous GISs [4]. Web services are Web sites intended for use by computer programs rather than human users. The W3C has defined a general-purpose Web service architecture based on a trio of standards – SOAP, the Web Service Description Language (WSDL), and Universal Description, Discovery, and Integration (UDDI) – as well as others for business processes, security, coordination, transaction, inspection, and so on [5]. SOAP is platform-independent and enables different ∗
[email protected] International Conference on Earth Observation Data Processing and Analysis (ICEODPA), edited by Deren Li, Jianya Gong, Huayi Wu, Proc. of SPIE Vol. 7285, 72852P · © 2008 SPIE · CCC code: 0277-786X/08/$18 · doi: 10.1117/12.815913
Proc. of SPIE Vol. 7285 72852P-1 2008 SPIE Digital Library -- Subscriber Archive Copy
applications to communicate, because it is an XML-based format used as a remote procedure call, transmitted over HTTP through firewalls and proxy servers to invoke remote methods. Additionally, WSDL is used to describe the public interface of a Web service. The WSDL file is an XML document that describes a set of SOAP messages and provides the information necessary for a client to interact with the web service. At last, the web service interfaces described by WSDL may be put into a directory called UDDI. The UDDI is a central directory service where businesses can publish, register, and search for Web services [6]. In parallel with the development of these general-purpose Web services, OGC has successfully executed efforts for GIS interoperability. OGC has defined various specifications for spatial web services, such as the OGC Web Mapping Service (WMS) [7], Web Coverage Service (WCS) [8], Web Feature Service (WFS) [9], Catalog Service for Web (CSW) [10], and Processing Services, which support application developers in integrating a variety of online geo-processing and location services. CS-W specifications facilitate communication among catalogs. WMS is for distributed visualization of geospatial information as mapped images. WCS facilitates the sharing of data from earth observations, scientific assimilations, or modeling. WFS helps in sharing discrete data objects, and SLD supports rendering data obtained via WFS or WCS. Based on these service specifications and standards, the SOA can provide a publish-find-bind pattern to support sharing components and prototyping applications. Service providers publish service descriptions to a catalog. Clients find published services through service descriptions. Services are bound according to application logic to support specific client applications. Nowadays, with the development of information technology, "Digital City" has been paid more and more attentions. On the basis of full development of various urban industries management department information, the demand of urban geospatial information service have turned to key technology research and practice about cross-sectoral city’s comprehensive decision-making, management and exchange of information services, information sharing, information retrieval, and information mining and information presentation. To enhance continuously urban information technology governance and public service capacity, to form unified norms and facilitate the sharing of services to achieve the effective integration of urban geospatial data and socioeconomic statistics data must first build a cross-cutting, crosssectoral and interdepartmental heterogeneous urban geospatial information-sharing and service platform-Wuhan geospatial sharing platform for the government to provide information to support decision-making. Wuhan geospatial sharing platform provides new ways to achieve the standardization, intelligent and visualization of urban planning information management. Wuhan geospatial sharing platform promote the sufficient use of all kinds of geospatial information for the development of Wuhan City and provide standard, on-demand, real or near real time service for government management, resource management, and urban planning, and so on. The remainder of this paper is structured as follows. Section 2 introduces a generic architecture of Wuhan geospatial information sharing platform. Section 3 describes the function modules of this system. Section 4 gives out the implementation of this system. The final section draws conclusions and discusses.
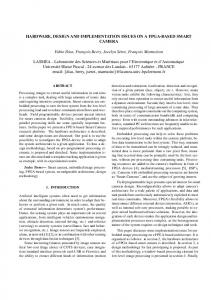
2. ARCHITECTURE OF THIS SYSTEM Leveraging the geospatial interoperability, we developed a conceptual architecture (Figure 1) to share geospatial components. This platform consists of Web Client, Metadata Catalog, and Data services. The architecture is a serviceoriented architecture based on Web Services. Metadata Catalog acts as the registry and index of the services. Web Client can discover needed metadata of the services from the catalog and bind them to form applications. Data Services box as services provider publishes and registers services to Metadata Catalog. It provides data or information services via WMS. Data services reside on geographically dispersed locations and computer. Metadata of geospatial data and web services store in Metadata Database. Metadata Catalog box is populated with service metadata of data services. It plays the role of service broker in Web Service Architecture. This means that the Metadata Catalog is the centre to register services. Metadata records are designed to store in the Metadata database. Web Client, which is Web-based applications that will be loaded to a Web Brower when being accessed, provides visualization, searching, publishing, administration, and processing. They find the service description from Metadata Catalog, then bind Data services and invoke the service.
Proc. of SPIE Vol. 7285 72852P-2
Web Client
Find
Bind
Publish Metadata Catalog
Data Services
Fig.1. Architecture of the Platform
3. FUNCTIONS AND COMPONENTS This platform consists of Web Client, Metadata Catalog, and Data services. Web Client can provide functions, such as exploring and inquiring map layers, overlapping map layers, accounting, analysis, system management and so on. Catalog Services can provide functions, such as publishing and discovering services. Data services provide WMS services for this system. 3.1 Web Client Web Client provides visualization, searching, publishing, administration, and processing. Function modules of Web Client is made up of view, select, counting, spatial analysis, print map and management as described in Figure 2. Web
Client
Management
Print Map
Spatial Analysis
Counting
Select
View Fig.2. Function Modules of Web Client
1) View A map is the most common view for users to work with geographic information. It's the primary application in any GIS to work with geographic information. Common map elements include the data frame containing map layers for a given
Proc. of SPIE Vol. 7285 72852P-3
extent plus a scale bar, north arrow, title, descriptive text, and a symbol legend. This system makes every thematic map as a service. You can zoom in or out on the data in a map and pan your data in a map by dragging the display in any direction with mouse. You can also zoom to the full extent of a map so you can see the entire area covered by the map. A map layer is created automatically each time you import a data source. The map's table of contents helps you manage the display order and symbols properties of each map layer. The table of contents lists all the layers on the map and shows what the features in each layer represent. The order of layers within the table of contents specifies their drawing order in the data frame. You can expand or collapse the map layer hierarchy, drag and drop a layer or layers to another position in the list, make a layer visible or invisible in the map view, set the dynamic styles for each layer, set the properties for each layer. This system provides two map views. One is on the left, and the other on the right. If we hide the right one, it is called on a single-screen mode, otherwise, two map view at the same open that is on a double-screen mode. Double-screen mode and a single-screen mode can switch each other. There is a map view on a single-screen mode. We can display and overlay different thematic map services. The left map view and the right map view can independently load different services on a double-screen mode. The advantage of double-screen mode is they can compare the same features of the different thematic map services, such as a feature of a terrain map on the left map view compares the same feature of an image on the right one. Left map view and right one can achieve linkage. The extent of the left and right is identical. The left map view zooms in and its extent changes, the right map’s extent varies to accord with the extent of the left map. The same is to zoom out, pan and full extent. 2) Select There are different ways to search catalog services to discover map, features and their attributes. We can select a feature from a map, and then this feature’ attributes are listed. We can also search the map id or map name within the entire record. A map according with query condition was displayed in the working area. We can input the place name as query condition. While the features requested are being retrieved, the platform will highlight the features and show their attributes listed in a table. You can select anyone to find the features. We can select features by attributes. A menu on the Select By Attributes dialog box lets you choose how fields will be listed. You first choose the layer containing the features you want to select, and then the fields of this layer are listed. Double-click a field to add the field name to the SQL expression box. Click an operation to add it to the expression. Click Get Unique Values to see the values for the selected field. Double-click a value to add it to the expression. You can add more fields and values to the expression. Between two fields connect with Boolean calculation. Click the verify button to see if you are using proper syntax or if the criteria you've entered will select any features. After execute the select, the results of the search are displayed as a table derived from the records citing each found information item. For each feature the result shows some attributes. 3) Counting We can calculate the construction area of the feature contained in the selected range. The way of select has interactive selection, boundary rectangle cross-selection, border overlap selection, contain selection and so on. According to the configuration of the selected way, calling feature query can get the records set, and calculate the construction area of these features. This system also provides the tools to get the coordinate of a selected point. We can also calculate the map length of a broken line and the area of the selected polygon. 4) Spatial Analysis GIS is designed to support a range of different kinds of analysis of geographic information: techniques to examine and explore data from a geographic perspective, to develop and test models, and to present data in ways that lead to greater insight and understanding. All of these techniques fall under the general umbrella of "spatial analysis". This platform provide point buffer zone query and analysis functions in a simple vector data service layer. The establishment of the buffer zone is to create a circle. We must know the center point and radius. The center point is a point the mouse clicking on the screen. The screen coordinates point need to transform to map coordinates point. The radius can be configured. This point and radius can create a circle as buffer zone graphic. According to the overlap operation between this buffer graphic and map layer, you can get the features the buffer zone covering. These features are highlighted and their attributes are displayed. When setting the buffer zone radius, the input text will be verified,
Proc. of SPIE Vol. 7285 72852P-4
which will ensure that the number of the buffer zone radius is the number greater than 0, and units can be selected in the drop-down list box behind the text box. 5) Print map You can print your map directly from this system. You can print the currently visible extent, the north arrow, all copyright information, and a title. This system can print the contents of the map view by merging its resources into a single image. You can set various properties for the print page. A user-customizable title is displayed at the head of the page. The page is opened as a new browser window from the current window. Except for the title, you can set the specific scale, size and resolution in the browser. You can print the page to any available printer locally or on the network. In the case of the page size and print quality, the text (small, medium, large; draft, and normal) will display in the print dialog that appears when the end user of your application wants to print the map. You can change these values. 6) Management Management includes User Management, Group Management, Metadata Management, and Category Management. A group is a container for a set of users with common privileges regarding a metadata. Groups are created by users with the Administrator profile. Each user can belong to several groups. Each user has a profile which identifies the services he can access. We can create users and configure the users. Metadata Management allows publishers to create, upload, and manage their metadata records in metadata repository. Publishers maintain their metadata records and must ensure that the data services referenced are current and accessible. In addition, publishers can register metadata repositories. To publish metadata, you must be granted privilege by the portal administrator. They can create their metadata using an independent XML editor and upload the records to Catalog services. They can also create their metadata and post it using online metadata editor form. These metadata records follow the Federal Geographic Data Committee (FGDC) [11], ISO 19115 [12], or ISO 19139 standards metadata profiles. This system provides functionality that can be engaged to automatically validate submitted metadata records against applicable metadata standards. Users are informed of metadata records that fail this automatic validation before final posting. You can manage your metadata online, review metadata records, view its status, and modify metadata content for those documents that you created using the online form. You can research metadata records from metadata repository. The simple search allows users to search text within the entire record, such as keywords of the metadata. The advanced search option works similar to the simple search, however, you can be more specific in your search criteria. Here you can also search directly in the title or abstract fields and add more keywords to customize your search further. The results of the search are displayed as summary statements derived from the metadata records citing each found information item. For each metadata the result page shows the title, a hint of the abstract, keywords and so on. The user can then elect to display more detailed descriptions of each information item or the full metadata record itself. The services described by the metadata records can be provided to view and process. Categories provide quick access to authoritative data resources stored as metadata in metadata repository. Metadata can be classified many categories. Category can facilitate to search metadata. You can update category content. Category Management provides functionalities to creating, deleting, and modifying the category. 3.2 Metadata Catalog Metadata Catalogue supports the ability to publish and search collections of descriptive information (metadata) for data, services, and related information objects. Metadata Catalog has a local metadata repository. Metadata are stored and organized in the repository. Metadata represent resource characteristics that can be queried and presented for evaluation and further processing by both humans and software. The Metadata Catalog implement the OGC's Catalog Services for Web (CSW), which is an industry consensus regarding an open, standard interface to online catalogs for geographic information and Web-accessible geoprocessing services. CSW specifies interface, HTTP protocol bindings, and a framework for defining application profiles required to publish and access digital catalogues of metadata for geographic data, services, and related resource information. CSW protocol supports the registry and discovery of geospatial information resources. It plays a directory role in the open, distributed Web Service environment. Data and services providers register their capabilities using metadata, and users can then query the metadata to discover interesting information.
Proc. of SPIE Vol. 7285 72852P-5
The metadata profile used by this system to describe the geographic data and services is compliant with FGDC or ISO (19115 or 19139) requirements. FGDC establishes the names of data elements and compound elements. The standard was developed from the perspective of defining the information required by a prospective user to determine the availability of a set of geospatial data, to determine the fitness the set of geospatial data for an intended use, to determine the means of accessing the set of geospatial data, and to successfully transfer the set of geospatial data. ISO 19115 describes the general content of the metadata and relationships between metadata elements. It defines the schema required for describing geographic information and services. It provides information about the identification, the extent, the quality, the spatial and temporal schema, spatial reference, and distribution of digital geographic data. This implementation specification is applicable to digital geographic datasets and can be used to describe many other forms of geographic data such as maps, charts, and textual documents. It provides information about the identification, the extent, the quality, the spatial and temporal reference, and the distribution of digital geographic data. More specifically, this specification provides an implementation UML model based on the ISO 19115 abstract UML model and defines an XML schema derived from the implementation UML model. ISO 19115 does not, however, provide any guidance on how the metadata records should be built and formatted. To address this need an additional standard, ISO 19139, was undertaken to create an XML schema that prescribes the format of the metadata record. The ISO 19139 standard incorporates metadata elements referenced, but not defined, in ISO 19115 such as the entity and attribute descriptions addressed by ISO 19109 geospatial data standard. ISO 19139 provides an encoding schema for describing, validating, and exchanging metadata about geographic datasets, dataset series, individual geographic features, feature attributes, feature types, feature properties, etc. 3.3 Data Services There are multiple government departments or officials such as Surviving and Mapping Department, Environment department and so on, which locate in different geographic places in Wuhan. These functional departments or officials provide plenty of GIS resources including base terrain data, urban planning data, road planning data, controlling detailed planning data, land use planning data, transfer red line data, divest red line data and so on. These functional departments or officials utilize the database to store and manage these data together with attribute data. These data was published as WMS. This WMS specification [7] defines three WMS operations: GetCapabilities (required) returns service-level metadata, which is a machine-readable (and human-readable) description of the WMS service’s information content and acceptable request parameters; GetMap (required) returns a map image whose geospatial and dimensional parameters are well-defined; GetFeatureInfo (optional) returns information about particular features shown on a map. A "map" defined as a visual representation of geo-data is not the data itself.
4. IMPLEMENTATION OF THIS SYSTEM The system is a distributed integrated environment based on SOA and OGC geospatial services. The system is made up of Web Client, Metadata Catalog, and Data Services. The system has been deployed in many high performance servers. Required software of developing this system is Windows Server 2003, Oracle 10g, ArcSDE 9.2 SP4, IIS 6, J2SDK 1.5.0_06, Tomcat 5.5.17, ArcIMS 9.2 SP4, ArcGIS Server 9.2 SP4, ArcGIS 9.2 SP4, and Visual Studio 2005. We utilize these tools to implement the system. Web Client server' OS is Windows Server 2003 with IIS. IIS is a Web server. The integrated development Environment is Microsoft Visual Studio .NET 2005 and ArcIMS for Web ADF, development language is C#. Web Client is a Webbased application which provides contents from IIS to a Web browser as a visual interface for a user. Much of logic and process are developed using C#. HTML and JavaScript are used to develop web page, which can be displayed within any Web browser. Metadata Catalog compatible to CSW provides the ability to publish, store, and research metadata. We use ArcIMS to implement the catalogue. ArcIMS is able to create a central, online metadata repository that facilities publishing and browsing metadata over the Internet. With ArcIMS Metadata Services, metadata can easily be published and quickly searched. The user also has full control over who can publish their metadata and what metadata the server contains. ArcIMS Metadata Services are made up of the ArcIMS Spatial Server combined with data residing in a relational database. The data in this database is accessed using ArcSDE, which is required to use ArcIMS Metadata Services. To create metadata services, you need J2SDK, Tomcat, ArcIMS, ArcSDE, Oracle 10g. ArcIMS provides the mechanism for hosting a Metadata Service, allowing clients to publish to the service as well as search its contents. ArcIMS uses ArcSDE and Oracle with which it’s configured to store, index, and search the published metadata documents. When a
Proc. of SPIE Vol. 7285 72852P-6
Metadata Service is created, several tables are created in the database to store and index the documents. Each time a client publishes a metadata document to the service and new records are added to the database tables. Metadata documents are indexed to optimize search and retrieval performance. The CSW Connector is provided to support searching a Metadata Service using CSW. The CSW Connector is a Web application that can be deployed on the Web Server. ArcIMS Metadata Services can be used to create a central, online metadata repository that allows you to easily publish and browse metadata over the Internet. You can author your metadata throuth the ArcGIS ArcCatalog application using industry-standard and user-definable style templates, and then publish your metadata by simply dragging and dropping it into the ArcIMS Metadata Server. Metadata is optimized for rapid and efficient searches using a variety of clients including lightweight browse-based clients and ArcGIS Desktop. Data services are distributed in functional departments and officials. Different organizations could use different geospatial data format. These organizations only need to publish these geospatial data as WMS. Now there are many tools which can do this, such as ArcIMS, ArcGIS Server, MapXtreme, and so on. ArcIMS uses the WMS Connector to provides WMS interface to data servered by ArcIMS Image and ArcMap Image Services. A translation engine receives WMS requests and converts them into ArcXML requests that are forwarded to the published ArcIMS services. The ArcXML responses are translated into OGC standard response and are returned to the requesting clients. You can enable capabilities the various ways the servces hosted in the ArcGIS Server provide. Image services and Map services can get WMS capability. MapXtreme provides the tools to deploy a WMS server for others to query. To set up your own WMS server, you must configure a server connection to IIS and create the XML file necessary for providing the data connection required to host a Web Map Service.
5. CONCLUSION This paper introduces Wuhan geospatial sharing platform designed and developed to leverage the advantages of interoperability, SOA, and OGC Web Services. Its interoperability provides quick and easy integration of systems and components through open interfaces. This system is a robust and flexible information infrastructure and extensible to incorporate new technology components or business relationships. But there are several challenges. System performance within Web Services environment may be a significant issue. This portal’s reliance on distributed, independently managed services makes it hard to control its performance. It is also difficult to ensure the Quality of Service that may be required by the reliability of the services. Also, the burden of the interoperability put on computing system and network bandwidth is significant when big volume of data is accessed. These are all areas needing further investigation [13]. This system has also highlighted the importance of full adherence to standards. Arbitrary shortcuts or simplifying assumptions inevitably lead to errors when drawing on an open ended set of services across different communities of practice, with different priorities and assumptions [14]. Information systems heterogeneity may be considered as structural (schematic heterogeneity), semantic (data heterogeneity), and syntactic heterogeneity (database heterogeneity) [15]. Syntactic heterogeneity means that various database systems use different query languages. Structural heterogeneity means that different information systems store their data in different structures. Semantic heterogeneity considers the content of an information item and its meaning. Semantic conflicts among information systems occur whenever information systems do not use the same interpretation of the information. This system can solve structural and syntactic heterogeneity, but semantic heterogeneity has been not solved [1]. We are developing more application system in terms of this platform. As new standards and specifications are approved in OGC and implemented in products, we will integrate new services and into this infrastructure. We will use ontologies as semantic translators to overcome the problem of semantic heterogeneity [16]. Semantic augmentations to CSW can improve the discovery ability of data and services [17].
Proc. of SPIE Vol. 7285 72852P-7
REFERENCES [1] [2] [3] [4] [5] [6] [7] [8] [9] [10] [11] [12] [13] [14]
[15] [16] [17]
Stoimenov, L. and Djordjevic-Kajan, S., "An architecture for interoperable GIS use in a local community environment." Computers & Geosciences 31(2): 211-220 (2005). Yang, P., Evans, J., et al, "The emerging concepts and applications of the spatial web portal." Photogrammetric Engineering and Remote Sensing 73(6): 691-698(2007). Genesereth, M., Keller, A.M., and Duschka, O.M., "Infomaster: an information integration system", ACM SIGMOD Record 26(2): 539-542 (1997). Qiang, L., Boyan, C., et al, "Constructing geo-information sharing architecture for the southwestern China based on WMS." Geoscience and Remote Sensing Symposium, 2005. IGARSS '05. Proceedings. 2005 IEEE International. W3C, 2003. Web Services and Service Oriented Architecture, http://www.w3.org/2003/Talks/1211-xml2003wssoa/. Xiang, M., Qunhua P., et al, "Integration and Share of Spatial Data Based on Web Service." Parallel and Distributed Computing, Applications and Technologies, 2005. PDCAT 2005. Sixth International Conference on. OGC Web Map Service, Open Geospatial Consortium, 2004, http://portal.opengis.org/files/?artifact_id=5316. OGC Web Feature Service, Open Geospatial Consortium, 2002, http://portal.opengeospatial.org/files/?artifact_id=7176. OGC Web Coverage Service, Open Geospatial Consortium, 2003, http://portal.opengeospatial.org/files/?artifact_id=3837&version=2. OGC. Catalogue Services. Catalogue Services Specification.2005; http://portal.opengeospatial.org/files/?artifact_id=5929&version=1 FGDC. 1998. Content standard for digital geospatial metadata, http://www.fgdc.gov/standards/projects/FGDCstandardsprojects/metadata/base-metadata/v2_0698.pdf. ISO. 2003. International standard: geographic information-metadata; http://www.ncits.org/refdocs/FDIS_19115.pdf. Yang, C., D. W. Wong, R.X. Yang, M. Kafatos, and Q. Li. "Performance-improving techniques in web-based GIS." International Journal of Geographical Information Science 19(3): 319-342 (2005). Evans, J. D. and Bambacus, M. J., "NASA's earth-sun system gateway: an open standards-based portal to geospatial data and services." Geoscience and Remote Sensing Symposium, 2005. IGARSS '05. Proceedings. 2005 IEEE International. Bishr, Y.A., "Overcoming the semantic and other barriers to GIS interoperability." International Journal of Geographic Information Science 12 (4): 299-314 (1998). Hakimpour, F. and Timpf, S., "Using Ontologies for Resolution of Semantic Heterogeneity in GIS." Presented at 4th AGILE Conference on Geographic Information Science, Brno, Czech Republic, 2001. Yue, P., Di, L., et al, "Semantic Augmentations for Geospatial Catalogue Service." Geoscience and Remote Sensing Symposium, 2006. IGARSS 2006. IEEE International Conference on.
Proc. of SPIE Vol. 7285 72852P-8