GR-57001 Thermi, Thessaloniki Greece. Marzuki Khalid ...... [29] Y. K. Siah, T. Haur, M. Khalid, and T. Ahmad, âVehicle licence plate recognition by fuzzy artmap ...
(IJACSA) International Journal of Advanced Computer Science and Applications, Vol. 7, No. 6, 2016
Determining adaptive thresholds for image segmentation for a license plate recognition system Siti Norul Huda Sheikh Abdullah
Khairuddin Omar
Abbas Salimi Zaini
Center for Artificial Intelligence and Technology (CAIT), Faculty of Information System and Technology, Universiti Kebangsaan Malaysia, 43600 Selangor, Malaysia
Center for Artificial Intelligence and Technology (CAIT), Faculty of Information System and Technology, Universiti Kebangsaan Malaysia, 43600 Selangor, Malaysia
Center for Artificial Intelligence and Technology (CAIT), Faculty of Information System and Technology, Universiti Kebangsaan Malaysia, 43600 Selangor, Malaysia
Maria Petrou
Marzuki Khalid
Informatic and Telematics Institute (ITI), Center for Research and Technology Hellas, 6th km Charilaou - Thermi road, P.O.Box 60361, GR-57001 Thermi, Thessaloniki Greece
Centre for Artificial Intelligence and Robotics (CAIRO), Faculty of Electrical Engineering, Universiti Teknologi Malaysia, Jalan Semarak,54100 Kuala Lumpur
Abstract—A vehicle license plate recognition (LPR) system is useful to many applications, such as entrance admission, security, parking control, airport and cargo, traffic and speed control. This paper describe an adaptive threshold for image segmentation applied to a system for Malaysian intelligent license plate recognition (MyiLPR). Due to the different types of license plates used, the requirements of an automatic LPR system are rather different for each country. Upon receiving the input car image, this system (MyiLPR) detects and segments the license plate based on proposed adaptive threshold via image and blob histogram, and blob agglomeration, and finally, it extracts geometric character features and classifies them using neural network. The use of the proposed adaptive threshold increased the detection, segmentation and recognition rate to 99%, 94.98% and 90% correspondingly, from 95%, 78.27% and 71.08% obtained with the fixed threshold used in the originally proposed system.
An important issue in image preprocessing for a real time application, like license plate recognition, is the selection of the best threshold value for image binarization. Choosing the wrong threshold can cause failure in either the detection or the segmentation process, as the thresholded image could either totally hide the required objects or cause distraction in the region of interest due to variable illumination. Several researchers have proposed different ways for selecting the best threshold. For example Yoshimori et al. [1] used a real-coded genetic algorithm and a so called hereditary threshold determination method, Kim et al. [2] used an enhanced neural network, and Lee et al. [3] used adaptive local binarization. Another technique referred to as the Otsu automatic threshold [4] has also been extensively used in LPR and other applications.
Keywords—adaptive threshold; image segmentation; license plate recognition; neural network; computer surveillance;
I.
I NTRODUCTION
Automatic license plate recognition (LPR) is an important research subject due to its many applications. For local authorities, LPR is required for the purposes of law enforcement, border protection, vehicle thefts, automatic toll collection and perhaps traffic control. For others, automatic LPR can be applied to gain access into housing areas, automatic parking control and as a marketing tool in large shopping complexes, as well as for surveillance. LPR consists of five major steps: image capturing, image processing, segmentation, feature extraction and pattern classification. Usually, an LPR system includes targeted functions and specifications, such as a fast alphanumeric character recognition system. In addition, 24 hours non-stop operation is expected and the ability to issue alarm messages which are sent out after the recognition phase.
(a)
(b)
Fig. 1: (a) Samples of common license plates and (b) Samples of special license plates in Malaysia. In Malaysia, perhaps 95% of the vehicles’ license plates are in the form of a single or a double line with normal fonts (Figure 1(a)). The other 5% are made of special fonts, such as those shown in Figure 1(b). The halo or illumination and unstandardized Malaysian plate issues have made license plate recognition continues to face big challenges [5]–[9]. On 20th January 2015, the signing ceremony for memorandum 510 | P a g e
www.ijacsa.thesai.org
(IJACSA) International Journal of Advanced Computer Science and Applications, Vol. 7, No. 6, 2016
of agreement (MoA) between UKM Tech (M) Sdn. Bhd. and Synergy Saver (M) Sdn. Bhd. was held successfully. According to Synergy Saver CEO Mr. Shariffpudin Basiron;
threshold value M divides the matrix into four quadrants (see Figure 2). The entropy of each quadrant can be computed and M
0
Up to date, the license plate recognition technology for Malaysian license plate cases are still an open issue. Our company purchased and tested several existing LPR products, yet we failed to achieve high accuracy rate. It is due to lack of enforcement towards unstandardized license plate format practice from road user. We believed that a collaboration between researchers (UKM) and industry will be able to solve the issues regarding Malaysia license plate recognition. The objective of this paper is to propose an adaptive thresholding method for thresholding both the number plate from the car image and the individual characters within the number plate region, and to compare its results with those obtained by a fixed threshold, another state of the art thresholding method, as well as Otsu’s automatic thresholding method, in relation to a Malaysian license plate recognition system. This paper is organized as follows. Section II reviews the state of the art in automatic threshold selection. Section III explains the proposed method and Section IV presents and analyses the experimental results. Finally, conclusions are presented in Section V.
B
D
C
..N-1
Fig. 2: A threshold M partitions the co-occurrence matrix into four quadrants. The maximum entropy threshold maximises the entropy in quadrants A and C. For a bright object, quadrant C corresponds to pairs of object pixels. the threshold that maximises the sum of the entropies of the quadrants that correspond to the object and the background is selected. If pij is an element of the co-occurrence matrix, we normalise it so that the sum of all values inside each quadrant is 1. Assuming a bright object, the elements of the matrix in quadrant C (see figure 2) are divided by PO , and the elements of the matrix in quadrant A are divided by PB ,
S TATE OF THE A RT
Thresholding is a straightforward technique in transforming a gray scale image into a binary image that can facilitate the segmentation process. If h, is the input image, the value of the output image, ℘, at position (x, y), given a threshold Ω, is: � 1 if h(x, y) ≥ Ω, ℘(x, y) = (1) 0 else h(x, y) < Ω.
A M
PijO ≡ II.
pij PO
PijB ≡
One of the most recent introduced methods for threshold determination is based on the local entropy [21]. This approach has been widely used for measuring the local information content or uncertainty and the information content of a probability distribution [22], [23]. First, the co-occurrence matrix of the image is constructed considering pairs of pixels that are either one below the other or one next to the other. For N grey level values, the co-occurrence matrix is N × N in size. Selecting a
pij , PB
(2)
where, PO ≡
N −1 �
N −1 �
pij
PB ≡
M � M �
pij .
(3)
i=0 j=0
i=M +1 j=M +1
Then the Shanon entropy, EO (M ) and EB (M ) for object and background respectively, is: 1 �� O P log2 PijO , 2 i=0 j=0 ij M
Recent most popular global binarization used on license plate recognition is Otsu thresholding method [10]–[12] for its simplicity and fast performance. In addition, one of the most recently introduced methods for threshold determination known as adaptive contrast is also based on Otsu method [13]. Meanwhile, Niblacks and Sauvolas methods become an alternative to solve shadows and illumination problem [14], [15] on license plate images. Global binarization methods are dependent on distinct image foreground and background such that the preprocessing and post-processing on binarization can contribute towards optimal results. Some recent work such deblurring [16], image filtering algorithms [17], [18] and super-resolution [19] are good example for preprocessing. Although post-processing approach are not popular compared to preprocessing, some recent work such dirt effect elimination [20] show decent result in character segmentation.
...N-1
EO (M ) = −
EB (M ) = −
N −1 1 � 2
M
N −1 �
(4)
PijB log2 PijB
(5)
i=M +1 j=M +1
The threshold that maximises the total entropy, ET (M ) ≡ EO (M ) + EB (M )
(6)
is considered to be the optimal threshold. Fuzzy [24], excess [25] and honey bee optimization [26] has been incorporated into the method of threshold identification. The local entropy computation time is similar to that for Otsu’s automatic threshold determination method. In this paper, we shall compare the results of the entropy-based and Otsu’s methods with the results of a heuristic method presented in the next section for an LPR system. In some cases, a single threshold is not applicable for global segmentation. Hence, multiple threshold values are identified to segment an image globally. A statistical recursive approach proposed in [27] calculates first the mean μ and standard deviation σ of the image. Two thresholds are then defined: S1 =μ+κ1 × σ (7) 511 | P a g e
www.ijacsa.thesai.org
(IJACSA) International Journal of Advanced Computer Science and Applications, Vol. 7, No. 6, 2016
S2 =μ−κ2 × σ
versus the threshold used. We then consider the thresholds that created the peaks in these graphs. This sub-process determines the peak as the adaptive thresholds as the more number of blobs gained, therefore the higher potential for the important objects (foreground) to be segmented or separated from the background of an image.
(8)
where κ1 and κ2 are free parameters. Pixels with value below the low threshold constitute one segment and pixels with value above the high threshold another segment. In the output image, each such pixels is assigned the average grey value of the segment to which it belongs. Pixels with values in between the two thresholds are thresholded further, in the same way, by calculating their mean and standard deviation, to form two new segments in the output image, carrying grey values equal to their respective means, and a central segment, which may be further subdivided in the same way. The method is repeated recursively, until the central segment diminishes, or a prespecified number of thresholds has been defined, or the Peak Signal to Noise Ratio (PSNR) reaches a certain value. PSNR computes noise introduced in the image by replacing the true grey values of the pixels with the average grey values of the segments to which they belong: � � 255 P SN R = 20 × log10 , (9) RM SE
3) Selection of the thresholds: Some preliminary experiments showed that if the type of image is of ‘medium brightness’, a threshold of 130 sometimes leads to good results. So for this type of image, threshold 130 is always used in addition to the other thresholds identified as explained next. For all types of image, all thresholds that correspond to the peaks of the blob distributions had to be used. Open circles identify the peaks of the blob distributions as in in Figure 5, and dictates in a listing as in Table I, for the example images of Figure 3. TThese thresholds produce images as shown in Figure 6. We notice that in Figure 6(a) and 6(c), which correspond to the images in the category of ‘dark’, and ‘bright’, respectively, there is a clear character separation in the number plate for thresholds ΩSelect = 40 for the ‘ACN65’ image, and ΩSelect = 60, 90, 110, 170 for the ‘ADG676’ image. So, in the subsequent steps, the thresholds selected at this stage will be used to identify all white blobs. The flow chart of the proposed method for threshold selection is shown in Figure 7.
where
� � � RM SE = �
T S 1 �� 2 [℘(x, y) − h(x, y)] S × T x=1 y=1
(10)
T HE P ROPOSED M ETHOD
III.
The proposed thresholding method consists of three steps: (1) identify the type of image according to its histogram; (2) calculate blob distributions for various threshold values and (3) select threshold value(s) based on a simple heuristic decision rule. Each of the steps is explained next. 1) Identify the type of image according to its histogram: At this stage the contrast of the image is assessed and the image is categorised as dark, of medium brightness or bright, according to the shape of its histogram. We simply partition the 8-bit image into three levels by dividing 256 into 3 predetermined categories and sum those pixel frequencies for each category. Hence, we used the following heuristic rules to assess the shape of the histogram of the image: �g=85 � �g=85 � ⎧ g=170 g=255
⎪ ⎪ dark if ρ ≥ ρ ∧ ρ ≥ ρ , g g g g ⎪ ⎪ ⎪ g=0 g=86 g=0 g=171 � � � � ⎪ ⎨ g=170 g=85 g=170 g=255
Θ=
⎪ ⎪ ⎪ ⎪ ⎪ ⎪ ⎩
medium
bright
if
if
g=86 �g=255
ρg ≥
ρg ≥
g=171
ρg
0 g=85
g=0
ρg
∧
g=86 � �g=255
∧
ρg ≥
ρg ≥
g=171
ρg
g=171 g=170
,
�
ρg
.
g=86
(11)
Here ρg is the number of pixels in the image with grey value g and the image is assumed to be an 8-bit grey image.The histograms of images ‘ADG676’, ‘ACP92’ and ‘ACN65’ (Figure 3) are shown in Figure 4. 2) Calculation of blob distributions for various threshold values: We transform source image into binary images using as a series of 25 thresholds, starting from threshold 0 and increasing its value in steps of 10. For each threshold, the number of the connected components created is identified. In Figure 5 we plot the number of the connected components identified this way for each of the example images of Figure 3, 512 | P a g e www.ijacsa.thesai.org
(IJACSA) International Journal of Advanced Computer Science and Applications, Vol. 7, No. 6, 2016
(a)
(c)
(b)
Fig. 3: Examples of (a) ‘dark’, (b) ‘medium’ and (c) ‘bright’ license plate images.
2000 1000 0
50
100 150 Number of pixels versus gray scale for ’ACP92’ image
200
250
0 4 x 10
50
100 150 Number of pixels versus gray scale for ’ACN65’ image
200
250
0
50
200
250
6000 4000 2000 0 Number of pixels
Number of pixels
Number of pixels
Number of pixels versus gray scale for ’ADG676’ image 3000
4 2 0
100
150 Gray scale
Fig. 4: The histogram distribution, ρ(0,1,...,255) , for the ‘ADG676’, ‘ACP92’ and ‘ACN65’ car image from top to bottom, respectively.
513 | P a g e www.ijacsa.thesai.org
(IJACSA) International Journal of Advanced Computer Science and Applications, Vol. 7, No. 6, 2016
Blob distribution versus threshold for ’ADG676’ image
Blob distribution versus threshold for ’ACP92’ image
600
500 450
500
400 350 Number of blobs
Number of blobs
400
300
200
300 250 200 150 100
100
50 0
0
50
150 100
150 Threshold
200
0 0
250
50
(a)
100
150 Threshold
200
250
(b)
Blob distribution versus threshold for ’ACN65’ image. 600
Number of blobs
500
400
300
200
100
0 0
0
10 20
30
5 40
50 60
70
80
10 100 110 120 130 140 15 150 160 170 180 20 190 200 210 220 230 25 240 250 90
Threshold
(c)
Fig. 5: Each threshold used for (a) ADG676, (b) ACP92, and (c) ACN65 images created a distributions for number of blobs. Identified circles represent the local maxima in each distribution.
TABLE I: The thresholds that create the peaks in the distributions of Figure 5. Peak index, p 0 1 2 3 4 5 6
Peak threshold values, ΩP eak(0,1,...,p−1) ADG676 ACP92 ACN65 60 10 40 90 50 130 110 70 200 170 120 250 200 150 240 200 230 -
514 | P a g e www.ijacsa.thesai.org
(IJACSA) International Journal of Advanced Computer Science and Applications, Vol. 7, No. 6, 2016
peak0=60
peak1=90
peak2 =110 peak0 = 10
peak3 =170
peak4 =200
peak4 = 150
peak5 =240
peak2 = 70
peak1 = 50
(6)
peak5 = 200
peak6 = 230
peak3 = 120
selectq-1 =130 (inclusive FIXED THRESHOLD)
(a)
(b)
peak0 = 40
peak1 = 130
peak3 = 250
peak2 = 200
(c)
Fig. 6: Examples of the thresholding results using as thresholds the grey values that correspond to the peaks of the graphs in Figure 5 for (a) ‘ADG676’, (b) ‘ACP92’ (also includes the result for the 130 threshold value), and (c) ‘ACN65’, respectively.
515 | P a g e www.ijacsa.thesai.org
(IJACSA) International Journal of Advanced Computer Science and Applications, Vol. 7, No. 6, 2016
Select threshold values
Obtain peak threshold(s)
Obtain image category
Heuristic Threshold Process
Calculate histogram distribution, p0,1..,255
Get Original image, imgO
( +(
If p0..86 >= p0..86 >=
State 1
p87...170 ) p171...255 )
no
If ( p87...170 >= p0..86 ) + ( p87...170 >= p171...255 )
no
Set as bright
yes yes Set
State 1a
as medium
Set image category, as dark
State 1a
Set thresh=0
If thresh < 256
yes
Apply Thresholding process on img0 at =thresh
Apply CCL and Blob Analysis on imgTthresh
Blob distribution R1..s
Calculate number of blobs of imgTthresh
no Peak threshold value candidates
thresh = thresh+10
Identify peaks, p and threshold value, peak(0,1...p-1)
if Get p and and threshold values, peak(0,1...p-1)
( = bright V ) dark
yes
Select all peaks, Opeak0,1,...p-1
Selected threshold values, OSelect
State 2
no
if ( =medium)
yes
Select =130 and all peaks, peak0,1,...p-1
Fig. 7: The flow chart of the proposed threshold selection process.
516 | P a g e www.ijacsa.thesai.org
(IJACSA) International Journal of Advanced Computer Science and Applications, Vol. 7, No. 6, 2016
A. Blob Agglomeration Further processing will only consider all white blobs identified by the selected threshold applied to an image. Hence, the minimum enclosing rectangle will represent each blob. Eventually, we remove noise by considering each blobs’ height and width at a certain size. In an LPR operational system, the scale of the images captured is assumed to be known. So, these size thresholds may easily be selected and fixed from the beginning. In our case, blobs narrower than 5 pixels and shorter than 15 pixels were treated as due to noise and removed. Then, the agglomeration process selects the remaining blobs into several clusters, starting from the top left, corner of the top left blob and agglomerates blobs that did not differ very much in their vertical position in the image will build up the cluster, as well as in height. In particular, if Ycurrent is the vertical coordinate of the top left corner of the minimum enclosing box � of the cluster, and Y is the vertical coordinate of the top left corner of a blob, and Hcurrent is the height of the minimum enclosing box of the cluster, the new blob is added to the cluster if, � � �� � �Ycurrent − Y � ≤ α × Hcurrent � � �� � �Hcurrent − H � ≤ α × Hcurrent
and
�
where H is the height of the blob and α is some parameter (See Figure 8). The cluster with the maximum number of blobs is considered to be the identified number plate. Then we consider the blobs in the cluster, one at a time. The system as explained in [28] will identify the characters inside the blobs.
1) 2) 3) 4)
the local entropy method [21]; Otsu’s method [4], Multi level method [27], the proposed method,
and compare the results obtained with those of the original system. CAIRO and CAIT members collected a dataset consist of 1216 images and it was used in the experiments. The experiments were performed using the dataset on Intel Dual Core PC with 1.33Ghz processor speed. If all clusters identified in an image consist of a single blob, then we say that no number plate was identified in this image. The first row of Table II shows the percentage of images in which the number plate was not identified. Note that at this stage we do not consider cases where a number plate region had been found but it was totally wrongly placed. These cases will be identified only at the character recognition stage. Of the clusters that are considered as candidate number plates, we consider first whether the number of blobs corresponds correctly to the true number of characters in the number plate. If it does, we consider that the segmentation was right. Table II also lists the percentage of images for which one, two, or more characters were not segmented, as well as the cases when more blobs than characters in the number plate were identified. Finally, we report the results of the recognition stage. Of the correctly segmented blobs, Table III gives the percentage of wrongly recognised characters for each of the tested methods. The same results are presented also in Figure 9. Finally, the overall performance of the LPR system is reported in Table V, for the various thresholding methods, for license plate. TABLE II: Segmentation results.
u
2 1
HCurrent
5
3
6
Not found Miss 1 Miss 2 Miss >2 Extra
H
4
v
WCurrent
Otsu
Thresholding method Fixed Multilevel
41.17% 4.39% 3.58% 10.33% 1.46%
4.33% 3.10% 4.49% 7.19% 2.61%
Proposed
4.05% 4.13% 5.45% 14.42% 5.14%
0.33% 1.40% 1.07% 0.99% 1.23%
W
Fig. 8: The blob on the right is added to the cluster on the left, only if u + v ≤ α × Hcurrent .
IV.
Local Entropy 4.48% 2.36% 4.56% 7.33% 2.77%
E XPERIMENTAL EVALUATIONS
The proposed thresholding method was tested within the LPR system presented in [28]–[30]. This system uses geometric features [28], [30] and either a back-propagation multilayer perceptron (MLP-BP) or a support vector machine (SVM) to classify the characters. In this paper we use only the version with MLP-BP as it gave better results than SVM. This system uses Opencv library support to implement the thresholding method at its back end. While at its front end a fixed threshold (equal to 130) interface also provided to binarise the captured image [29]. In this paper we supplement the front end of the system with automatic selection of the threshold using
TABLE III: Classification results with MLP-BP.
Wrong 1 Wrong 2 Wrong >2
Local Entropy 5.46% 1.22% 0.65%
Otsu
Thresholding method Fixed Multilevel
3.74% 0.49% 1.87%
5.39% 1.14% 0.65%
5.61% 1.64% 0.86%
Proposed 1.48% 1.97% 1.40%
The 1216 images in the dataset includes 7835 characters in the number plates. Various schemes tested shows the percentage of correctly segmented characters and the percentage of the correctly recognized characters from those segmented are given in the first and second rows of Table IV. However, the recognition of full number plates was one of the criteria judged for the performance of an LPR system. A number plate is recognised if all its characters are fully segmented and all are correctly recognised. The percentages 517 | P a g e
www.ijacsa.thesai.org
(IJACSA) International Journal of Advanced Computer Science and Applications, Vol. 7, No. 6, 2016
Local Entropy
Local Entropy
40
8
Otsu
7
Multilevel Proposed
Otsu
TABLE V: LPD, LPS and LPR rate for Local Entropy, Otsu, Fixed, Multilevel and the proposed framework.
Fixed
Fixed Multilevel Proposed
Local Entropy 95.50% 78.41% 71.05%
LPD LPS LPR
30
Otsu 58.83% 39.06% 32.55%
Accuracy rates Fixed Multilevel 95.67% 78.27% 71.08%
94.86% 67.21% 59.11%
Proposed 99.67% 94.98% 90.13%
6
accuracy % 1.00 Proposed 20
4
0.75
Percentage
3
10
Fixed Local Entropy
2
Multilevel 0.50
1
(a)
1
2
Wrong2
0
Wrong1
Extra
MissMore2
Miss 2
Miss 1
0
(b)
WrongMore2
Otsu
0 NotFound
Percentage %
5
3
0.25
Fig. 9: Error Analysis for Local Entropy, Otsu, Fixed, Multilevel and the proposed framework in the (a)segmentation, and (b)classification phases.
TABLE IV: Blob error analysis for Local Entropy, Otsu, Fixed, Multilevel and the proposed framework based on correctly segmented and correctly recognised characters.
correctly segmented correctly recognised
Thresholding method Fixed Multilevel
Local Entropy 58.49%
Otsu
39.06%
78.27%
87.08%
92.33%
97.11%
83.33%
90.81%
76.26%
97.61%
0 LPS
LPD
LPR phase
Fig. 10: LPD, LPS and LPR accuracy rates for Local Entropy, Otsu, Fixed, Local Entropy, Multilevel thresholds and the proposed framework.
Proposed
accuracy rates are calculated as follows [31]: LP D
of correctly identified number plates (LPD) includes all images for which a number plate region was identified and at least 60% with the true number plate region was overlapped. The percentage of the correctly segmented characters (LPS) includes all images for which the number of blobs identified inside the candidate number plate region is at least equal to the number of characters in the number plate. Finally, the percentage of correctly identified number plates (LPR) includes only those images for which the full car number was recognised. These results are presented in Table V and in Figure 10. Table V and Figure 10 are constructed based on three types of accuracy rate: LPD, LPS and LPR. The LPD, LPS and LPR
LP S LP R
rate rate
rate
= =
=
(1216−Notfound−Smalloverlap) , 1216
(12a)
) − LP D, ( (1216−Miss1−Miss2−Miss>2) 1216 (12b) (1216−W rong1−W rong2−W rong 2) 1216
− LP S. (12c) Even though the fixed threshold [29] system has poor performance, it has the lowest recognition time (973.485ms) compared with the Otsu [4](3549.31ms), Local Entropy [21](2630.81ms), Multilevel [27] (3789.18ms) and the proposed threshold (4026.14ms). This is due to its lower complexity. 518 | P a g e
www.ijacsa.thesai.org
(IJACSA) International Journal of Advanced Computer Science and Applications, Vol. 7, No. 6, 2016
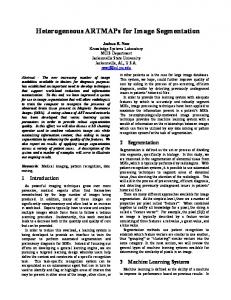
Some results of success and failures of the Otsu threshold [4] LPR system are shown in Figure 11. Some results of success and failures of the fixed threshold [29] LPR system are shown in Figure 12. Some results of success and failures of the multilevel threshold [27] LPR system are shown in Figure 13. Examples of successful and failed experiments of the system using the proposed thresholding method are shown in Figure 14. V.
C ONCLUSIONS
Specific applications have their own peculiarities. License plate recognition systems are commercially available nowadays. However, generic LPR systems are not appropriate for all countries, due to variations in the lay out and the font of the characters used in the number plates. A Malaysian LPR system developed recently uses a fixed threshold to segment the number plate and the characters. In this paper, we showed that with the help of a taylor-made thresholding method we can increase the performance of the algorithm significantly. However, the proposed approach is computationally intensive and it cannot be used in its present form for a real time application. It may, however, be used for off-line processing of images with license plates. Another advantage of the proposed approach, is that the adaptive threshold values can adapt to the environment where the system is to be used, for example when there is a high or low contrast situation, such as during the night, mid-day, underground and in a rainy day. ACKNOWLEDGMENT Special thanks to: Shahnorbanum Sahran, Sharifah Norziatul Said Samsudin, Sharifah Norzulhida bt Said Samsudin, Noor Faridatul Ainun Bt Zainal, Fadhilah Bt Mustapha, Rosmizan Mat Nong and Nor Hidayah Kasim who had worked hard in giving ideas and collecting the image data in various states. The FRGS/1/2014/ICT07/UKM/02/5 grant entitled OVERLAPPED IRREGULAR SHAPE DESCRIPTOR BASED ON NON-LINEAR APPROACH and also DIP-2015023 grant entitled OBJECT DESCRIPTOR VIA OPTIMIZED UNSUPERVISED LEARNING APPROACHES are used to fund this project.
[6] F. M. Khaleel, S. N. H. S. Abdullah, and M. K. B. Ismail, “License plate detection based on speeded up robust features and bag of words model,” in Smart Instrumentation, Measurement and Applications (ICSIMA), 2013 IEEE International Conference on, Nov 2013, pp. 1–5. [7] N. A. Bakar, M. R. M. Nawawi, A. R. Abdullah, A. Noordin, Z. Musa, and O. C. Xian, “Malaysian vehicle license plate recognition using double edge detection,” in Control System, Computing and Engineering (ICCSCE), 2012 IEEE International Conference on, Nov 2012, pp. 422– 426. [8] K. Thanin, S. Mashohor, and W. Al-Faqheri, “An improved malaysian automatic license plate recognition (m-alpr) system using hybrid fuzzy in c++ environment,” in Innovative Technologies in Intelligent Systems and Industrial Applications, 2009. CITISIA 2009, July 2009, pp. 51–55. [9] M. D. Saleh, H. Mellah, A. Mueen, and N. D. Salih, “An efficient method for vehicle license plate xtraction,” in 2008 International Symposium on Information Technology, vol. 2, Aug 2008, pp. 1–5. [10] C. M. Wang, J. D. Hong, G. C. Lin, J. Y. Su, and Z. F. Lin, “License plate location system using smart-phone with g-sensor,” in Intelligent Information Hiding and Multimedia Signal Processing (IIH-MSP), 2014 Tenth International Conference on, Aug 2014, pp. 451–454. [11] Y. Bolotova, A. Druki, and V. Spitsyn, “License plate recognition with hierarchical temporal memory model,” in Strategic Technology (IFOST), 2014 9th International Forum on, Oct 2014, pp. 136–139. [12] Z. Zhi-Yong and S. Yang, “The license plate image binarization based on otsu algorithm and matlab realize,” in Industrial Control and Electronics Engineering (ICICEE), 2012 International Conference on, Aug 2012, pp. 1657–1659. [13] B. Su, S. Lu, and C. L. Tan, “Robust document image binarization technique for degraded document images,” Image Processing, IEEE Transactions on, vol. 22, no. 4, pp. 1408–1417, April 2013. [14] Y. Yoon, K.-D. Ban, H. Yoon, and J. Kim, “Blob extraction based character segmentation method for automatic license plate recognition system,” in Systems, Man, and Cybernetics (SMC), 2011 IEEE International Conference on, Oct 2011, pp. 2192–2196. [15] J. He, Q. Do, A. Downton, and J. Kim, “A comparison of binarization methods for historical archive documents,” in Document Analysis and Recognition, 2005. Proceedings. Eighth International Conference on, Aug 2005, pp. 538–542 Vol. 1. [16] J. Fang, Y. Yuan, W. Ji, P. Tang, and Y. Zhao, “Licence plate images deblurring with binarization threshold,” in Imaging Systems and Techniques (IST), 2015 IEEE International Conference on, Sept 2015, pp. 1–6. [17] I. El Khatib, Y. Sweidan, S.-M. Omar, and A. Al Ghouwayel, “An efficient algorithm for automatic recognition of the lebanese car license plate,” in Technological Advances in Electrical, Electronics and Computer Engineering (TAEECE), 2015 Third International Conference on, April 2015, pp. 185–189. [18] S. Nigussie and Y. Assabie, “Automatic recognition of ethiopian license plates,” in AFRICON, 2015, Sept 2015, pp. 1–5.
R EFERENCES [1] S. Yoshimori, Y. Mitsukura, M. Fukumi, and N. Akamatsu., “A design of the object detection system using real-coded genetic algorithm,” in Proceedings of Joint conference on neural networks, vol. 2, 20-24 July. 2003, pp. 1227–1231. [2] K.-B. Kim, S.-W. Jang, and C.-K. Kim, Recognition of Car License Plate by Using Dynamical Thresholding Method and Enhanced Neural Networks. Lecture Notes in Computer Science, 2003, vol. 2756/2003, ch. Book Computer Analysis of Images and Patterns, pp. 309–319. [3] B. R. Lee, K. Park, H. Kang, H. Kim, and C. Kim, “Adaptive local binarization method for recognition of vehicle license plates,” Lecture notes in Computer Science:Combinatorial Image Analysis, vol. 3322/2004, pp. 646–655, 2004. [4] N. Otsu, “A threshold selection method from gray level histograms,” IEEE Trans. Systems, Man and Cybernetics, vol. 9, pp. 62–66, Mar. 1979, minimize inter class variance. [5] H. Y. Chai, H. H. Woon, L. K. Meng, and Y. S. Li, “Non-standard malaysian car license plate recognition,” in Computer Applications and Industrial Electronics (ISCAIE), 2014 IEEE Symposium on, April 2014, pp. 152–157.
[19] F. Bouchara and T. Lelore, “A fast and robust super-resolved binarization algorithm for license plate recognition,” in Transparent Optical Networks (ICTON), 2012 14th International Conference on, July 2012, pp. 1–5. [20] J. Park, “An intelligent framework of illumination effects elimination for car license plate character segmentation,” in Machine Learning and Cybernetics (ICMLC), 2010 International Conference on, vol. 3, July 2010, pp. 1268–1272. [21] E. Y. Du and C.-I. Chang, “An unsupervised approach to colour video thresholding,” in IEEE Proc. International Conference on Multimedia and Expo ICME03, vol. 3, no. III, 2003, pp. 337–40. [22] M. L. Alhouse and C.-I. Chang, “Image segmentation by local entropy methods,” in Proc. International Conference on Image Processing, vol. 3, 1995, pp. 61–64. [23] P. Yang and O. A. Basir, “Adaptive weighted median filter using local entropy for ultrasonic image denoising,” in Proc. of the 3rd International Symposium on Image and Signal Processing and Analysis, 2003, pp. 799–803. [24] M. Bourjandi, “Image segmentation using thresholding by local fuzzy entropy-based competitive fuzzy edge detection,” in Computer and Elec-
519 | P a g e www.ijacsa.thesai.org
(IJACSA) International Journal of Advanced Computer Science and Applications, Vol. 7, No. 6, 2016
(a)
(b)
(c)
(d)
Fig. 11: Examples of screen shots of Otsu [4] threshold LPR system for successful and unsuccessful detection. (a) Successfully guessed as ‘WJD2519’, (b) unsuccessfully guessed as ‘W25’. (c) Successfully guessed as ‘AFH5321’, and (d) unsuccessful detecting the location of the license plate.
trical Engineering, 2009. ICCEE ’09. Second International Conference on, vol. 2, Dec. 2009, pp. 298–301.
using dtcnns.” in Proceedings 1998 Fifth IEEE International Workshop on Publish Security Technology, 1997., 1998, pp. 212–217.
[25] A. Bardera, I. Boada, M. Feixas, and M. Sbert, “Image segmentation using excess entropy,” Journal of Signal Processing Systems, vol. 54, pp. 2005–214, 2009. [Online]. Available: http://www.springerlink.com/content/xq26752861ln0351 [26] M.-H. Horng, “A multilevel image thresholding using the honey bee mating optimization,” Applied Mathematics and Computation, vol. 215, no. 9, pp. 3302 – 3310, 2010. [Online]. Available: http://www.sciencedirect.com/science/article/B6TY8-4XH0MJW-2/2/2b4a2d8ebafd5906c000b776a42d05df [27] S. Arora, J. Acharya, A. Verma, and P. K. Panigrahi, “Multilevel thresholding for image segmentation through a fast statistical recursive algorithm,” Pattern Recogn. Lett., vol. 29, no. 2, pp. 119–125, 2008. [28] S. N. H. S. Abdullah, M. Khalid, R. Yusof, and K. Omar, “License plate recognition based on geometry features topological analysis and support vector machine,” in Proceedings of Malaysia-Japan International Symposium On Advanced Technology (MJISAT2007), Kuala Lumpur, Malaysia, 12th-15 November 2007, cD Proceeding. [29] Y. K. Siah, T. Haur, M. Khalid, and T. Ahmad, “Vehicle licence plate recognition by fuzzy artmap neural network,” in World Engineering Congress (WEC99), Sheraton Subang, Malaysia, 1999. [30] S. N. H. S. Abdullah, M. Khalid, R. Yusof, and K. Omar, “Comparison of feature extractors in license plate recognition,” in IEEE Proceedings of First Asia International Conference on Modelling & Simulation (AMS2007), Phuket, Thailand, 2007. [31] J. Nijhuis, M. Brugge, and K. Helmholt, “License plate recognition
520 | P a g e www.ijacsa.thesai.org
(IJACSA) International Journal of Advanced Computer Science and Applications, Vol. 7, No. 6, 2016
(b)
(a)
(d)
(c)
Fig. 12: Examples of screen shots of Fixed [29] threshold LPR system for successful and unsuccessful detection. (a) Successfully guessed as ‘WJD2519’, (b) unsuccessfully guessed as ‘W4WX25000’, (c) unsuccessful to detect the location of the license plate, and (d) unsuccessful to detect the characters.
521 | P a g e www.ijacsa.thesai.org
(IJACSA) International Journal of Advanced Computer Science and Applications, Vol. 7, No. 6, 2016
a
(a)
(b)
(d)
(c)
Fig. 13: Examples of screen shots of Multilevel [27] threshold LPR system for successful and unsuccessful detection. (a) Successfully guessed as ’TS9867’, (b) successfully guessed as ’WBM5181’. (c) unsuccessfully guessed as’555’, and (d) unsuccessful guessed as ’N87’.
522 | P a g e www.ijacsa.thesai.org
(IJACSA) International Journal of Advanced Computer Science and Applications, Vol. 7, No. 6, 2016
(a)
(b)
(c)
(d)
Fig. 14: Examples of screen shots of the output of the LPR system that uses the proposed thresholding method for (a) (b) successful, and (c) (d) fail detection.
523 | P a g e www.ijacsa.thesai.org