Compton Gamma Ray Observatory has measured the spec- ... and inverse Compton emission. ...... Brennan, Katie Burns, Jaci Conrad, Jim Hinton, William.
THE ASTROPHYSICAL JOURNAL, 547 : 949È958, 2001 February 1 ( 2001. The American Astronomical Society. All rights reserved. Printed in U.S.A.
HIGH-ENERGY GAMMA-RAY OBSERVATIONS OF THE CRAB NEBULA AND PULSAR WITH THE SOLAR TOWER ATMOSPHERIC CERENKOV EFFECT EXPERIMENT S. OSER,1,2 D. BHATTACHARYA,3 L. M. BOONE,4 M. C. CHANTELL,1 Z. CONNER,1,5 C. E. COVAULT,1 M. DRAGOVAN,1,6 P. FORTIN,7 D. T. GREGORICH,8 D. S. HANNA,7 R. MUKHERJEE,9 R. A. ONG,1 K. RAGAN,7 R. A. SCALZO,1 D. R. SCHUETTE,1 C. G. THE� ORET,7 T. O. TU� MER,3 D. A. WILLIAMS,4 AND J. A. ZWEERINK3 Received 2000 June 16 ; accepted 2000 September 24
ABSTRACT The Solar Tower Atmospheric Cerenkov E†ect Experiment (STACEE) is a new ground-based atmospheric Cerenkov telescope for gamma-ray astronomy. STACEE uses the large mirror area of a solar heliostat facility to achieve a low energy threshold. A prototype experiment that uses 32 heliostat mirrors with a total mirror area of D1200 m2 has been constructed. This prototype, called STACEE-32, was used to search for high-energy gamma-ray emission from the Crab Nebula and Pulsar. Observations taken between 1998 November and 1999 February yield a strong statistical excess of gamma-like events from the Crab, with a signiÐcance of ]6.75 p in 43 hr of on-source observing time. No evidence for pulsed emission from the Crab Pulsar was found, and the upper limit on the pulsed fraction of the observed excess was less than 5.5% at the 90% conÐdence level. A subset of the data was used to determine the integral Ñux of gamma rays from the Crab. We report an energy threshold of E \ 190 ^ 60 th s~1. The GeV, and a measured integral Ñux of I(E [ E ) \ (2.2 ^ 0.6 ^ 0.2) ] 10~10 photons cm~2 th observed Ñux is in agreement with a continuation to lower energies of the power-law spectrum seen at TeV energies. Subject headings : gamma rays : observations È ISM : individual (Crab Nebula) È supernova remnants È pulsars : individual (Crab Pulsar) 1.
INTRODUCTION
which is assumed to be produced by the pulsar. Pulsed emission has not been seen at higher energies accessible to ground-based experiments (Lessard et al. 1999). The measurements require that pulsed emission cut o† somewhere between 10 GeV and D250 GeV. Polar cap models of pulsar emission (Daugherty & Harding 1982) predict sharp cuto†s near 10 GeV, whereas outer gap models (Cheng, Ho, & Ruderman 1986 ; Romani 1996) predict pulsed emission as high as D50 GeV. No previous gamma-ray detector has had sensitivity to gamma rays at energies between D10 GeV and D300 GeV. Nonetheless, there are strong motivations to observe the Crab in this energy range, not only to test inverse Compton models at previously unexplored energies, but also to search for pulsed gamma-ray emission that could distinguish between pulsar emission models. Satellite experiments have been limited to energies below D10 GeV by low statistics because of their small apertures and the rapidly falling Ñux of gamma rays. Ground-based experiments, which detect gamma rays by the Cerenkov light produced in extensive air showers initiated by the gamma ray, typically have energy thresholds of D300 GeV. The energy threshold is limited by the ability of the instrument to distinguish dim Ñashes of Cerenkov light amidst the Ñuctuations in night sky background light. From signal-to-noise considerations, the energy threshold of an atmospheric Cerenkov telescope can be shown to behave like
The Crab Nebula is the most studied object in the gamma-ray sky. Numerous ground-based experiments have detected emission from the Crab at energies from 300 GeV through 50 TeV. In addition, the EGRET detector on the Compton Gamma Ray Observatory has measured the spectrum of unpulsed gamma rays from the Crab up to an energy ofD10 GeV (Nolan et al. 1993). High-energy gamma rays are believed to result from inverse Compton scattering of relativistic electrons on synchrotron photons, thermal dust photons, and cosmic microwave photons. Such inverse Compton models have been described by de Jager & Harding (1992), Atoyan & Aharonian (1996), and de Jager et al. (1996). Under this scenario, high-energy electrons are accelerated at the pulsar wind termination shock. They then propagate through the nebula, producing both synchrotron and inverse Compton emission. In addition to unpulsed gamma rays, EGRET has also seen pulsed gamma-ray emission from the Crab (Nolan et al. 1993 ; Ramanamurthy et al. 1995 ; Fierro et al. 1998), 1 Enrico Fermi Institute, University of Chicago, Chicago, IL 60637. 2 Present address : Department of Physics and Astronomy, University of Pennsylvania, Philadelphia, PA 19104. 3 Institute of Geophysics and Planetary Physics, University of California, Riverside, CA 92521. 4 Santa Cruz Institute for Particle Physics, University of California, Santa Cruz, CA 95064. 5 Present address : Department of Physics/Women and Power Leadership Programs, The George Washington University, Washington, DC 20007. 6 Present address : Jet Propulsion Lab, Pasadena, CA 91109. 7 Department of Physics, McGill University, Montreal, QC H3A 2T8, Canada. 8 Department of Physics and Astronomy, California State University, LA, Los Angeles, CA 90032. 9 Department of Physics & Astronomy, Barnard College & Columbia University, New York, NY 10027.
E P th
S
')q . vA
(1)
Here, ' is the Ñux of night sky background light, ) is the Ðeld of view of the instrument, q is the length of the electronic trigger coincidence window, v is the efficiency for detecting Cerenkov photons, and A is the total mirror collection area of the instrument (Weekes 1988). In particular, 949
950
OSER ET AL.
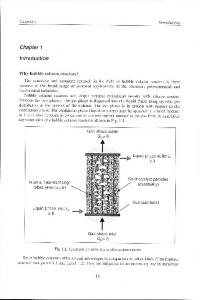
FIG. 1.ÈSTACEE detector concept drawing. An array of heliostat mirrors collects Cerenkov light produced in a gamma-ray air shower. The heliostats reÑect the light to secondary mirrors located on a central tower. The secondary mirrors image the light from each heliostat onto an individual photomultiplier tube. The STACEE-32 prototype used 32 heliostats and two secondary reÑectors. This diagram is not to scale.
the number of Cerenkov photons collected from a shower will scale with the mirror area A, while Ñuctuations in the night sky background light will increase with the square root of the light collection, and hence with JA. Thus, the energy threshold of an atmospheric Cerenkov detector decreases approximately in proportion to the inverse square root of the total mirror area. The Solar Tower Atmospheric Cerenkov E†ect Experiment (STACEE) is a new atmospheric Cerenkov detector for gamma-ray astronomy that uses the large mirror area of a solar power research facility to achieve a low energy threshold. STACEE uses an array of steerable mirrors, called heliostats, to collect Cerenkov light produced in extensive air showers. Heliostats focus the light onto secondary mirrors on a central tower, which image the light onto photomultiplier tube cameras (see Fig. 1). Previous tests demonstrate that heliostat arrays can be used to detect Cerenkov light from extensive air showers (Ong et al. 1996 ; Chantell et al. 1998). Here we report on observations of the Crab Nebula and Pulsar taken with a prototype version of the STACEE instrument. This prototype, called STACEE32, used 32 heliostats and a preliminary electronic trigger system. The full instrument incorporates 64 heliostats, and is presently under construction. It will start regular observations in the fall of 2000. 2.
DETECTOR
STACEE is located at the National Solar Thermal Test Facility (NSTTF), at Sandia National Laboratories in
Vol. 547
Albuquerque, NM (34¡.962 N, 106¡.509 W, 1705 m above sea level). The NSTTF is a solar power research facility of the US Department of Energy. It includes 212 heliostat mirrors, each D37 m2 in area, arrayed across a 300 ] 120 m area (see Fig. 2). For solar power research, heliostats track the Sun and concentrate sunlight onto a central receiver tower. At night, STACEE-32 used a subset of the heliostats to track a gamma-ray source. These heliostats reÑected Cerenkov light towards two 1.9 m diameter secondary mirrors near the top of the tower. The secondary mirrors concentrated light from the heliostats onto phototube cameras. Each photomultiplier tube (PMT) received light from a single heliostat in the array. The heliostats were tilted inwards to track ““ shower maximum,ÏÏ the point of maximum air shower development (about 11 km above sea level for vertical showers). The technique of tilting multiple reÑectors inwards to observe shower maximum was Ðrst used by Grindlay, Helmken, & Weekes (1976). Details of the site, heliostats, secondary mirrors, and cameras are given elsewhere (Chantell et al. 1998 ; Oser 2000). Each camera contained 16 photomultiplier tubes and received light from a separate portion of the heliostat Ðeld (see Fig. 2). Solid acrylic light collectors based on the Dielectric Total Internal ReÑecting Concentrator design (Ning, Winston, & OÏGallagher 1987) were placed in front of the PMTs. The collectors concentrated incident light onto 5 cm diameter photomultiplier tubes and restricted the Ðeld of view of each PMT on the secondary mirror. The Ðeld of view of a heliostat was determined by the diameter viewed by its PMT on the secondary mirror, divided by the distance between the secondary mirror and the heliostat. The Ðelds of view were adjusted so that each heliostat saw a solid angle of approximately 1.2 ] 10~4 sr on the sky. The photomultiplier tubes (Photonis XP2282B model) had bi-alkali photocathodes with peak sensitivity near 400 nm and excellent time response (D1 ns resolution). The single photoelectron rate from night sky noise on each tube
FIG. 2.ÈArrangement of heliostats at the National Solar Thermal Test Facility. Two secondary mirrors (not shown) on the central tower view sixteen heliostats each. One secondary mirror views the east half of the Ðeld, and one views the west. The four subclusters of eight heliostats each correspond to the four trigger groups described in ° 2.
No. 2, 2001
OBSERVATIONS OF THE CRAB WITH STACEE
was D1.5 GHz, and the typical operating gain was 1.1 ] 105. Signals from the PMTs were AC-coupled and ampliÐed (]100) and then routed to electronics racks inside the tower. In order to achieve a low energy threshold, the PMT signals must be combined in a short time coincidence (see eq. [1]). The heliostats are at varying distances from the tower, and light from an air shower strikes di†erent heliostats at di†erent times, depending on the orientation of the shower. Therefore, signals from di†erent heliostats must be delayed by varying amounts in order to put them into time coincidence. STACEE-32 used a two-level digital trigger to form this coincidence. The 32 heliostats were divided into four compact subclusters of eight heliostats each, as indicated in Figure 2. PMT signals were discriminated, and the discriminator outputs were individually delayed to put the eight signals within a subcluster into time coincidence with one another. If Ðve of eight tubes Ðred within a 12.5 ns window, then that subcluster triggered. The four subcluster triggers were themselves delayed and put into time coincidence. Three of four subclusters Ðring within a 15 ns window resulted in an experiment trigger, which initiated readout. Thus, a total of at least Ðfteen heliostats had to Ðre to trigger the detector. The discriminator threshold was chosen so that the accidental trigger rate due to night sky background Ñuctuations was negligible (\0.002 Hz). The typical discriminator level was D170 mV, which was approximately 5.5 times the mean single photoelectron amplitude. The mean discriminator counting rate in each channel was D2 MHz. Multihit time-to-digital converters (Lecroy 3377 TDC) measured the arrival times of pulses from each discriminator channel. Charge-integrating analog-to-digital converters (Lecroy 2249SG ADC) on 24 channels measured the pulse charge over a 37 ns integration gate. The long delay times in the trigger formation (D1 ks) required that the ADC inputs be Ðrst routed through D1200 ns of highquality RG213 coaxial cable. These cables delayed the arrival of the pulses at the ADC until after the trigger had formed. Scaler counters recorded the PMT and subcluster trigger rates, and a GPS clock recorded the Universal Time for each event trigger. The PMT currents were also read out for every event. An experiment trigger asserted a veto, which inhibited further triggers until the event was read out and the veto was cleared by the data acquisition (DAQ) system. Counters measured the live time of the experiment (the fraction of time for which triggers were enabled). The experiment was also triggered with an external pulser every 2 s to collect a sample of non-Cerenkov events for calibration purposes. All readout and control was done via an interface to a Silicon Graphics workstation. Details of the electronics are given in Oser (2000). Calibration systems for STACEE-32 included a nitrogen laser and an LED Ñasher circuit. Optical Ðbers carried pulses from the laser to small wavelength shifter plates mounted at the center of each secondary mirror. The laser light pulsed all phototubes in each camera simultaneously. A Ðlter wheel was used to attenuate the laser light level, and the slewing responses of the PMTs (time vs. pulse amplitude) were so determined. On an occasional basis, the LED Ñasher was placed in front of each PMT to measure its gain in situ. Phototubes, delay modules, and other electronics systems were also calibrated extensively in the lab before installation. In addition, the orientations and status
951
of all heliostats were logged during tracking, and any malfunctions were noted offline and the a†ected data were identiÐed. 3.
EVENT RECONSTRUCTION AND BACKGROUND REJECTION
Although the energy threshold of an atmospheric Cerenkov detector is ultimately limited by night sky background light, the sensitivity of the detector is limited by a di†erent kind of background, namely, cosmic-ray air showers. STACEE-32Ïs high-multiplicity trigger coincidence e†ectively eliminated all accidental triggers due to Ñuctuations in night sky light. The high multiplicity of the trigger also rejected approximately 98% of all Cerenkov showers initiated by cosmic rays (see ° 3.2). The remaining cosmic-ray triggers form the background from which gamma-ray events must be distinguished. Traditional atmospheric Cerenkov telescopes use a single mirror with a pixellated phototube camera. Each element in the camera is mapped to a di†erent angular region on the sky, and thus one records an image of the Cerenkov shower in the sky. However, STACEE is not an imaging detector. Instead, the experiment is a lateral array which samples the Cerenkov wave front at many locations within the light pool. In this respect, event reconstruction must be handled quite di†erently than for an imaging Cerenkov telescope. STACEE records the arrival time and photon density of the Cerenkov wave front at each heliostat for every event. From these quantities the shape and lateral density proÐle of the Cerenkov light pool are determined. For STACEE-32, the charge resolution on the ADC measurements was limited by the high night sky light levels and relatively long integration gates. The charge resolution had a typical value of 8 photoelectrons. This resolution was not adequate for reconstructing the lateral density proÐle for most events, and so the ADCs were used only for slewing corrections and diagnostics. The full STACEE detector will use 1 GHz wave form digitizers, which will provide greatly improved resolution and allow reconstruction of the lateral density proÐle. For STACEE-32, event reconstruction was based solely upon timing information. 3.1. T iming Reconstruction Multihit TDCs measured the arrival times of PMT pulses. For each channel, the signal propagation times through the electronics were calibrated, and thus the expected arrival time of each Cerenkov pulse could be calculated, relative to the trigger time. We deÐned a time window with 12 ns width centered around the expected hit location. A heliostat which had a TDC hit within its time window is said to have an ““ in-time hit.ÏÏ Some channels did not have in-time hits, if those heliostats were not hit by the air shower, or if the Cerenkov pulse failed to exceed the discriminator threshold. For every in-time hit, we reconstructed the arrival time of the Cerenkov pulse at the heliostat by correcting for the transit time of light between the heliostat and the PMT, and the calibrated transit time of the PMT pulse through the electronics. ADC measurements were used to apply a slewing correction to those channels which had ADCs. The values of the slewing correction were determined from laser calibrations. From the shape and orientation of the reconstructed timing wave front at the heliostats, we determined the incident direction of the primary which initiated the air shower.
952
OSER ET AL.
At high energies (E [ 1 TeV), the Cerenkov-emitting core of the air shower extends through the atmosphere like a line source, and the resulting Cerenkov wave front has a conical shape. At lower energies, however, the shower does not penetrate very far into the atmosphere, and most of the Cerenkov light is produced near the location of shower maximum. For this situation, the air shower approximates a point source of Cerenkov light, and the resulting wave front has a more spherical shape. A ray drawn between the center of the light pool on the ground and the center of this sphere will point back towards the gamma-ray source. The timing wave front of each triggering event was Ðtted to a spherical shape. Only those heliostats which had an in-time hit and a slewing-corrected time were used in the Ðt. The timing resolution for each channel was estimated from its discriminator rate on an event-by-event basis. Calibration runs taken with cosmic-ray triggers showed that the timing resolution for channel i was related to its rate R by i an empirical relation :
S A B
R 2 (2) i . R 0,i The constants p and R were determined for each 0,i data. Using the estimated channel from the0,icalibration timing resolution, the corrected times were Ðtted to a sphere by a least-squares Ðtting procedure. The location of the sphereÏs center was allowed to vary, but the radius of the sphere was constrained to a distance corresponding to a slant depth of 271 g cm~2 from the top of the atmosphere. This radius corresponds to the average location of shower maximum for a 100 GeV gamma ray. The Ðt was done three times in an iterative manner, Ðrst excluding points lying 4 standard deviations from the original Ðt, and then excluding any remaining points lying more than 4.5 standard deviations from the second Ðt. For STACEE-32, the angular resolution was dominated by uncertainties in the determination of the center, or core, of the Cerenkov light pool. For gamma-ray air showers, the lateral density proÐle is quite smooth, and it is difficult to determine its center. For this analysis, we assumed the core location for all events to be at the geometric center of the array. Monte Carlo simulations indicate that STACEE-32 had an angular resolution of D0¡.25 for 200 GeV gamma rays. The Ðeld of view of the instrument was only 0¡.35 (halfangle), and therefore selecting events based on the reconstructed direction would not result in any signiÐcant improvement in the signiÐcance of a detection. However, the mean direction of air showers reconstructed by STACEE-32 was within 0¡.1 of the expected pointing direction, which veriÐed the absolute pointing of the instrument to that accuracy. p \p t,i 0,i
1]
3.2. Hadronic Rejection Traditional imaging atmospheric Cerenkov telescopes for gamma-ray astronomy reject cosmic-ray background events based on the orientation and width of the shower image in the camera. As a nonimaging Cerenkov telescope, STACEE uses very di†erent means for statistically identifying and removing cosmic-ray events. Cosmic-ray showers di†er from gamma-ray showers in the total amount of Cerenkov light they produce. A gamma-ray shower produces, on average, signiÐcantly more Cerenkov photons than a cosmic ray of the same energy (see
Vol. 547
Fig. 3). This e†ect happens because the nuclear cascade of a cosmic-ray air shower contains fewer Cerenkov-producing particles than the electromagnetic cascade of a gamma-ray air shower, and because the energy threshold for Cerenkov light production is higher for nucleons than for electrons. Furthermore, the di†erence in the Cerenkov yield between gamma-ray showers and cosmic-ray showers increases as the primary energy decreases. Gamma-ray air showers are brighter and trigger the detector with much greater efficiency than cosmic-ray showers. In addition, there are large di†erences between the lateral density proÐles of the Cerenkov light in gamma-ray and cosmic-ray events. Air shower simulations show that gamma-ray showers produce smooth and uniform light pools on the ground. In contrast, cosmic-ray showers produce nonuniform light distributions. In these showers, a large proportion of the light is often concentrated in a small area on the ground. STACEE-32Ïs trigger required 15 heliostats to be hit simultaneously across the array, and it therefore imposed a uniformity requirement. The high-multiplicity requirement of the trigger thus selected the smooth, gamma-like events, and rejected most of the irregular, hadron-like events. Measured cosmic-ray rates and Monte Carlo simulations suggest a trigger rejection factor of D50 for cosmic rays, compared to gamma rays with the same energy spectrum. (The trigger rejection factor here is deÐned to be the mean e†ective area of STACEE-32 for gamma rays, averaged over an E~2.7 spectrum, divided by the mean e†ective area for cosmic rays averaged over the same spectrum.) Nonetheless, there were additional hadronic cuts that were applied offline to further suppress the hadronic background. Two hadronic cuts were developed for STACEE-32. The Ðrst cut was a trigger reimposition cut. After in-time hits
FIG. 3.ÈCerenkov photon yields vs. energy for di†erent species. Plotted is the mean Cerenkov photon density within 125 m of the shower core for vertically incident showers. Only photons with wavelengths between 300È550 nm which land within a 10 ns window around the peak arrival time are included.
No. 2, 2001
OBSERVATIONS OF THE CRAB WITH STACEE
were found for each event (as described in ° 3.1), the trigger multiplicity requirement was reimposed. The in-time hit window (12 ns wide) was smaller than the trigger coincidence width, and thus reimposing the trigger in software removed some events that passed the hardware trigger. Hadronic air showers have wider, more irregular timing proÐles than gamma-ray showers, and so reimposing the trigger with a narrower time window modestly increases the signal-to-noise for gamma rays. This cut also reduces the impact of any random PMT hits that occur in coincidence with actual air showers. The second event cut used the shape of the timing wave front to distinguish between gamma-ray showers and cosmic-ray showers. As described above, gamma-ray showers have smooth, approximately spherical, timing proÐles. Cosmic-ray showers tend to have more irregular, less spherical wave fronts (see Fig. 4). The goodness-of-Ðt of a spherical shape to the wave front was used to distinguish between gamma rays and cosmic rays. We selected events based on the value of the s2 per degree of freedom (dof ) of
953
the spherical Ðt used for angular reconstruction. This selection should further increase the signal-to-noise of a gammaray signal. 4.
OBSERVATIONS
The STACEE-32 instrument observed the Crab extensively between 1998 November 15 and 1999 February 18. Data were taken on clear and moonless nights. We required the Crab to be within 45¡ of zenith. We took calibration data during times when the Crab was low in the sky. Weather conditions and the presence of clouds were monitored regularly. STACEE uses an ON-OFF observing strategy. O†source runs are used to estimate the cosmic-ray background level. A signal for gamma-rays shows up as an excess of ON events, compared to OFF events. On-source runs of 28 minute length were taken with the heliostats tracking the gamma-ray source. O†-source runs were taken with the instrument tracking a point in the sky displaced by one-half hour in right ascension from the gamma-ray source, but at
FIG. 4.ÈTiming wave front shapes for simulated gamma-ray and proton showers. Plotted is the arrival time of the Cerenkov photons on the ground, in nanoseconds, vs. the location on the ground, in meters. Gamma-ray showers are approximately spherical near the center of the shower (becoming more conical towards the edges), while cosmic rays produce irregular, less spherical Cerenkov wave fronts.
954
OSER ET AL. TABLE 1 SUMMARY OF RUN CUTS Property
Value
Total pairs . . . . . . . . . . . . . . . . . . . . . . . . . . . . . . . . . Runs cut : Clouds . . . . . . . . . . . . . . . . . . . . . . . . . . . . . . . . . . . Sky clarity . . . . . . . . . . . . . . . . . . . . . . . . . . . . . . . Pressure front . . . . . . . . . . . . . . . . . . . . . . . . . . . Frost . . . . . . . . . . . . . . . . . . . . . . . . . . . . . . . . . . . . . DAQ malfunctions . . . . . . . . . . . . . . . . . . . . . Major heliostat malfunctions . . . . . . . . . . High/Ñuctuating subcluster rates . . . . . . Abnormally low rate . . . . . . . . . . . . . . . . . . . Remaining pairs . . . . . . . . . . . . . . . . . . . . . . . . . . .
141 6 1 1 4 2 5 20 1 101
the same declination. For each on-source run we took an o†-source run of the same length. Together these two runs form an ON-OFF pair. The ON half of the pair preceded or followed the OFF half by exactly one-half hour, and so both halves of the pair tracked the same trajectory in local coordinates on the sky. During these observations, STACEE-32 acquired a total of 141 ON-OFF pairs, corresponding to D65 hr of on-source observing time. 4.1. Run Cuts In order to do a valid background subtraction, the ON and OFF halves of each pair must be closely matched in terms of detector properties and weather conditions. A series of run cuts were imposed to remove pairs a†ected by changing conditions. Run cuts were designed to remove data with poor or changing weather, detector malfunctions, or high or Ñuctuating PMT rates. Run pairs a†ected by weather conditions were identiÐed from observing logs. Given the relative proximity of the city of Albuquerque, clouds reÑect artiÐcial lighting, and change the apparent sky brightness. Observing logs identiÐed six ON-OFF pairs taken under partially cloudy conditions. These were removed from the data set. Another pair was removed because atmospheric haze was noted. Yet another pair coincided with the arrival of a major high-pressure front, which changed the atmospheric conditions on a short timescale. Finally, on a single night, frost developed on the heliostats, and four run pairs from that night were discarded. In all, twelve ON-OFF pairs were removed because of weather conditions. Major detector malfunctions a†ected a small number of runs. Two pairs had corrupted data because of failures in the DAQ system. Runs in which multiple heliostats malfunctioned in a single subcluster were also discarded. In these runs, the a†ected subcluster had a relatively low efficiency for participating in the trigger because its e†ective coincidence level was tightened from 5 of 8 tubes to 5 of 6 tubes. Five pairs were removed on this basis. Runs in which a single heliostat malfunctioned, or in which two heliostats in di†erent subclusters malfunctioned, were left in the data set, although the a†ected heliostats were removed from event reconstruction for both halves of the ON-OFF pair, as described in ° 4.2 below. Heliostat malfunctions were almost always repaired the following day. High PMT rates degrade data in several ways. As equation (2) shows, the timing resolution worsens with increasing rate. The rate of accidental coincidences, completely negligible under normal operating conditions, increases
Vol. 547
rapidly with rising PMT rates. Finally, high rates increase dead time in the subcluster trigger delay electronics. Runs with high rates were identiÐed from their subcluster trigger rates. Typical runs have subcluster rates of D1 kHz. All runs in which the mean trigger rate for any subcluster exceeded 20 kHz were removed. If the RMS variation of a subclusterÏs rate within the run exceeded 3 kHz, the run was also removed. These stringent cuts ensure that the accidental trigger rate remained less than 0.01 Hz, and that the dead time in the trigger delay of each subcluster was less than 1%. Twenty ON-OFF pairs were removed by these cuts. Finally, the data were scanned for runs with abnormally low event trigger rates. A single anomalous run was identiÐed with a trigger rate about 8 standard deviations below that of similar runs. The low rate is indicative of a detector malfunction, the cause of which is under investigation. The pair containing this anomalous run was removed from the Ðnal data set. Run cuts were applied in a blind fashion, before the signiÐcance of any possible gamma-ray excess was determined, so as not to bias the result. After application of run cuts, 101 ON-OFF pairs remain in the data set. Table 1 summarizes the various run cuts. 4.2. PMT Cuts It was not uncommon for a single heliostat or electronics channel to malfunction. Removing the entire run in this circumstance is rather draconian, and unnecessarily reduces the data set. Instead, bad channels were identiÐed on a run-by-run basis. O†ending channels were then removed from the offline analysis in both the ON and OFF halves of the run pair, and the data were analyzed as if the PMT were simply turned o†. The most common problems were heliostat tracking errors, which could be identiÐed from the heliostat log Ðles. Removing the bad channels from both halves of a pair ensures that the ON and OFF pairs are balanced in terms of detector response. 5.
RESULTS
After run cuts, the Ðnal STACEE-32 data set consists of 101 ON-OFF pairs, with a total on-source observing time of 155,335 s (D43 hr). Each run was processed separately, and event reconstruction proceeded as described in ° 3. For each event, the GPS event time, Ðtted shower direction, and s2/dof of the spherical Ðt were found. The live-time fraction for each run was calculated, and the event totals for each run were corrected for dead time by dividing by the livetime fraction (typically between 88% and 92%). A gamma-ray signal shows up as an excess of events in the ON runs, compared to the OFF runs. As described in ° 3.2, two kinds of event cuts were used to enhance any potential gamma-ray signal. The Ðrst cut was to reimpose the trigger multiplicity in software. The second cut was based on the s2/dof of a spherical Ðt to the wave frontÏs shape. Monte Carlo simulations suggest that a cut of s2/ dof \ 1 will maximize the signal-to-noise. 5.1. Unpulsed Emission First we performed a search for unpulsed emission, presumed to originate in the nebula of the Crab. The number of events in the on-source and o†-source runs were tallied, with and without event cuts. Table 2 summarizes the results. The raw data show a strong excess of 4860 events, before
No. 2, 2001
OBSERVATIONS OF THE CRAB WITH STACEE TABLE 2 ON-OFF EXCESSES FOR CRAB DATA SET
Quantity
Raw Data
Trigger Reimposed
s2/dof Cut
ON events . . . . . . . . . . . . . . . . OFF events . . . . . . . . . . . . . . . Excess (ON[OFF) . . . . . . SigniÐcance . . . . . . . . . . . . . . . Pairs ]/[ . . . . . . . . . . . . . . .
426,975 422,115 4860 ]5.27p 65/36
352,030 347,479 4551 ]5.44p 70/31
182915 178853 4062 ]6.75p 77/24
NOTE.ÈON-OFF event tallies are shown for the raw data (no event cuts, but corrected for dead time), after a trigger reimposition cut, and after an additional cut on the sphericity of the shower wave front. ““ Pairs ]/[ ÏÏ refers to how many pairs showed an excess of events (]) vs. a deÐcit ([).
event cuts, against a background of D420,000 events. The Li-Ma statistical signiÐcance (Li & Ma 1983) of this excess is ]5.27 p. Of the 101 ON-OFF pairs, 65 pairs show an excess in their raw rates, while just 36 show a deÐcit. Next, the trigger multiplicity was reimposed. The total number of excess events after trigger reimposition was 4551, with a background of D350,000, for a total signiÐcance of ]5.44 p. Seventy of the 101 pairs showed an excess of events from the source. Finally, a cut on s2/dof \ 1 was applied on top of the trigger reimposition cut. The remaining number of excess events was 4062. The background was reduced by a factor of approximately 2, to D180,000 events, and the total signiÐcance of the signal increased markedly to ]6.75 p. Of the 101 pairs, 77 now show an excess of events from the source region, while just 24 show a deÐcit. The observed excess is statistically strong, being present at greater than the Ðve standard deviation level in the raw trigger rates alone. Because STACEE is a new detector using a novel technique, there is the question of whether this excess is actually due to a gamma-ray signal, or whether it could be due to some unforeseen systematic e†ect that is present in spite of our e†orts to closely match ON and OFF halves of each pair. This question will ultimately be decided by conÐrmation of the result by other experiments. Detection of other sources with this technique should provide further conÐrmation of the method. Nonetheless, there are consistency checks that can be performed to strengthen the conclusion that STACEE-32 sees gamma rays from the Crab. The Ðrst and most powerful check is that the signiÐcance of the excess increases as selection cuts are applied to the data. Both the trigger reimposition cut, and especially the cut on the s2/dof, increase the signiÐcance of the signal by amounts in agreement with expectations from simulation. In short, the observed excess behaves just as a gamma-ray signal should.
955
Secondly, one can look at the distribution of pairwise signiÐcances. The pairwise signiÐcance is deÐned as the observed excess or deÐcit, in standard deviations, for each ON-OFF pair. For a steady source with a constant Ñux, the distribution of pairwise signiÐcances should be normally distributed, with unit width and a shifted mean. As is seen in Figure 5, the distribution of pairwise signiÐcances for our data does have the expected form. This fact further supports the interpretation of the excess as a gamma-ray signal. In Table 3 the data have been broken down by month. Since fewer runs were taken in January and February of 1999, these months have been combined. An excess with a signiÐcance of D4 p is seen in each era. Also noteworthy is that the background rate (OFF events per unit time) decreased by 20% between the November data and the DecemberÈFebruary data. We interpret this decrease as an increase in the energy threshold of the experiment. Closer examination of the data shows that the rates were steady within the month of November, and within December as well. Whatever change happened to the detector must therefore have occurred during the intervening full Moon period during which STACEE did not operate. Although
FIG. 5.ÈDistribution of pairwise signiÐcances for the STACEE-32 Crab data. The pairwise signiÐcance is deÐned as the observed excess or deÐcit, in standard deviations, for each ON-OFF pair. For a steady gamma-ray signal, the distribution of pairwise signiÐcances should be a Gaussian distribution with unit width. The signiÐcances are for event totals after all event cuts.
TABLE 3 MONTHLY CRAB EXCESSES Quantity
November
December
January/February
Total
On-source time (s) . . . . . . . . . . ON events . . . . . . . . . . . . . . . . . . . OFF events . . . . . . . . . . . . . . . . . . SigniÐcance (p) . . . . . . . . . . . . . . Excess rate (minute~1) . . . . . .
56,056 76,235 74,686 3.99 1.66 ^ 0.42
51,239 55,634 54,342 3.90 1.51 ^ 0.39
48,040 51,046 49,825 3.84 1.52 ^ 0.40
155,335 182,915 178,853 6.75 1.57 ^ 0.23
NOTE.ÈResults are shown with all event cuts applied (trigger reimposition and cut on wave front sphericity). The 1999 January and February data have been combined, since fewer runs were taken in these months.
956
OSER ET AL.
Vol. 547
ability of 0.12. We therefore conclude that STACEE-32Ïs Crab phase histogram is consistent with being uniform in phase. Concluding that our data set contains no strong evidence of pulsed emission, we then set an upper limit on the pulsed fraction of the total observed excess. Because the pulse proÐle of the pulsed emission at STACEEÏs energies is unknown, we make an assumption about the phase intervals in which the gamma-ray emission would occur. We assume that the pulsed emission at STACEE energies would occur in phase with the pulsed emission seen by EGRET (Nolan et al. 1993 ; Ramanamurthy et al. 1995 ; Fierro et al. 1998). We deÐned an ““ on-pulse ÏÏ region for the phase histogram, which includes an interval centered about the main radio pulse at 0.94È0.04 of the phase histogram, and a second interval about the intrapulse from 0.32È0.43. Using the method of Helene (1983), we derive an upper limit on the pulsed fraction of less than 5.5% of the observed excess, at the 90% conÐdence level. Table 4 contains the event totals for the on-pulse and o†-pulse regions. FIG. 6.ÈSTACEE-32 Crab Pulsar phase histogram. The arrival times of on-source events are binned according to the radio phase of the Crab Pulsar. This plot includes all events passing the trigger reimposition and shower sphericity event cuts. The main radio pulse occurs at a phase of zero. The horizontal dashed line is a Ðt to a uniform phase distribution.
the reason for this increase in threshold is not known with certainty, we suspect that the angular pointing of the heliostats drifted slightly out of alignment, decreasing the optical throughput. 5.2. Pulsed Emission Search Having established the presence of a gamma-ray signal in our data, we then carried out a search for pulsed emission in phase with the Crab PulsarÏs emission. A GPS clock recorded the arrival time of every event with an accuracy of D1 ks. The arrival time of each event at Earth was corrected to barycentric dynamical time (TDB) using the JPL Planetary and Lunar Ephemerides DEC-200 package.10 The corresponding radio phases were obtained from the Jodrell Bank ephemeris.11 The phase values were interpolated between monthly epochs by expanding the phase in a Taylor series, and by requiring continuity of the phase, period, and time derivatives of the period at the midway point between the two months. The barycentering and ephemeris calculations were checked by applying them to optical pulsar data recorded by the Whipple gamma-ray collaboration. For these data, we veriÐed that the optical pulse was extracted properly. The arrival times of on-source events were then folded with the pulsar phase to produce a phase histogram for the STACEE-32 data. Figure 6 shows the phase histogram for on-source events passing all event cuts. No obviously signiÐcant structure is seen. We have applied the H-test to test the uniformity of the phase histogram (de Jager, Swanepoel, & Raubenheimer 1989 ; de Jager 1994). The test yields a value for the h parameter of 5.37, which has a chance prob10 See E. M. Standish 1997, JPL Planetary and Lunar Ephemerides, available from ftp ://navigator.jpl.nasa.gov/pub/ephem. 11 See A. G. Lyne, R. S., Pritchard, & M. Roberts 1999, Jodrell Bank Crab Pulsar Timing Results Monthly Ephemeris, available from http :// www.jb.man.ac.uk/Dpulsar/crab.html.
5.3. Energy and Integral Flux Result The energy threshold and integral Ñux for these data must be determined from careful calibration and simulations of all parts of the detector. STACEE-32 used three simulation packages to model the response of the instrument to gamma rays. The well-established MOCCA code was used to model extensive air showers and Cerenkov light production (Hillas 1985). A complete ray-tracing program followed the paths of photons through the optics. Finally, a detailed electronics simulation which made use of a library of digitized PMT pulses was used to model the performance of the PMTs and electronics. All parts of the simulations have been veriÐed against calibration data. For the purpose of determining an energy threshold and integral Ñux, only data taken in 1998 November were used. As explained in ° 5.1, these data had the lowest energy threshold, as measured by the trigger rates. Also, the detector was carefully aligned during this month. During the subsequent months, it is believed that small degradations in the alignment increased the energy threshold, but we do not have enough information to track the e†ect reliably. Using only data from 1998 November therefore provides the lowest possible energy threshold and minimizes possible systematics associated with optical alignment. The increased statistical uncertainty from using a subset of the data as opposed to the entire data set is still smaller than the systematic uncertainty on the Ñux. Likewise, we have used the total rates before event cuts in determining the energy threshold and integral Ñux, since the efficiencies of these cuts depend on the simulation, and so would introduce additional systematic uncertainties if included. TABLE 4 PULSED EMISSION SEARCH RESULTS Parameter
Value
Number of events in pulse region . . . . . . . . . . . . . . . . . . . . . . . . . Number of events outside pulse region . . . . . . . . . . . . . . . . . . . SigniÐcance for pulsed region . . . . . . . . . . . . . . . . . . . . . . . . . . . . . . Pulsed fraction of emission (90% C.L. upper limit) . . . . . .
38,173 144,742 [1.37p \5.5%
NOTE.ÈThe phase search interval is : (0.94È0.04, 0.32È0.43). The trigger reimposition cut and a cut on the s2/dof for a spherical Ðt have been applied.
No. 2, 2001
OBSERVATIONS OF THE CRAB WITH STACEE
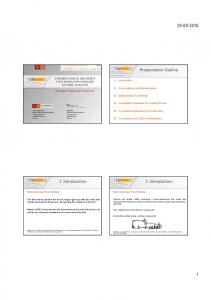
Monte Carlo simulations were used to determine the sensitivity of STACEE-32 to gamma rays. The sensitivity was calculated for gamma rays of various energies coming from multiple positions along the CrabÏs trajectory across the sky. The results were expressed as an e†ective area curve, which is the gamma-ray collection area of STACEE32 as a function of the gamma-ray energy. The average e†ective area curve for the 1998 November data was calculated by weighting each position on the sky by its exposure in the data set. Figure 7 shows the average e†ective area as a function of energy. The sensitivity of STACEE-32 starts at an energy below 100 GeV, and quickly rises with energy. The e†ective area approaches a plateau value of D28,000 m2 above 1 TeV. To determine the energy threshold and integral Ñux, we assume that the CrabÏs energy spectrum follows a di†erential power law of the form dN \ CE~2.4 . dE
(3)
assumed di†erential Ñux with the e†ective area curve, and equating this to the observed rate, we determine the integral Ñux. We Ðnd that the integral Ñux of gamma rays from the Crab Nebula above our energy threshold of E \ 190 ^ 60 th GeV is I(E [ E ) \ (2.2 ^ 0.6 ^ 0.2) ] 10~10 photons cm~2 s~1 . th (4) Here the Ðrst error is statistical, and the second error is the systematic error on the Ñux itself, not including the e†ects of uncertainty in the energy threshold. The dominant systematic error is the uncertainty in the energy threshold E , th which does not change the Ñux value itself, but which does change the energy at which that Ñux is reported. 6.
DISCUSSION
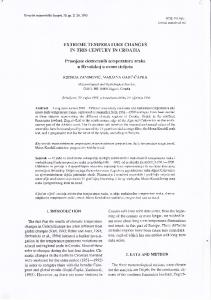
Figure 8 shows STACEE-32Ïs integral Ñux value. Also shown for comparison are measurements from the CAT (Barrau et al. 1997) and Whipple (Hillas et al. 1998) experiments. Our measured Ñux is consistent with an extension to lower energies of the power-law spectrum seen by Whipple. Inverse Compton models generally predict a hardening of the spectral slope as the energy decreases. Given the systematic uncertainties, our measurement is consistent with these expectations. No evidence of pulsed emission from the Crab Pulsar is seen, and an upper limit on the pulsed fraction is derived at less than 5.5% (90% CL) of the observed signal. At present, the energy threshold of this limit, although lower than any previous limit, is not low enough to di†erentiate between polar cap and outer gap models. As the energy threshold of STACEE is lowered further, however, future limits should constrain the theoretical models. This detection is the Ðrst for the STACEE instrument. The CELESTE collaboration, which is operating its own solar heliostat experiment at the The�mis site in France, has
-10
10
-2
-1
Integral Flux (photons cm sec )
The power-law index of [2.4 is estimated from measured Crab spectra, interpolated to STACEE-32Ïs energy range (Hillas et al. 1998). Convolving this spectrum with the e†ective area curve yields the di†erential trigger rate per unit energy. The peak rate occurs at an energy of 190 GeV. This is our estimate for the so-called spectral threshold energy. The energy threshold changes by less than ^10 GeV if the assumed spectral index is varied by ^0.2. Estimates of the uncertainty in each element of the simulations (e.g. uncertainties in measured mirror reÑectivities, PMT gains, etc.) yield a total systematic uncertainty on the energy of 32% (^60 GeV). No single factor dominates the systematic uncertainty. For the November data, a total of 183,501 on-source events were seen in the raw data (without event cuts), versus 181,349 o†-source events, in 56,056 s of observing time. The excess rate is therefore 0.038 ^ 0.011 Hz. By integrating the
957
-11
10
STACEE-32 CAT (Barrau et al. 1997) -- Whipple (Hillas et al. 1998)
-12
10
-1
10
1
1
10 Energy (TeV)
FIG. 7.ÈAverage e†ective area curve for 1998 November Crab data set. The error bars are statistical only.
FIG. 8.ÈSTACEE-32 integral Ñux result for Crab Nebula. Also shown for comparison are the integral Ñux from the CAT experiment and the measured spectrum from the Whipple Observatory. The error bars on the STACEE-32 point include systematic error on the energy threshold, and systematic and statistical errors on the Ñux. The CAT data point includes only statistical error on the Ñux.
958
OSER ET AL.
reported a preliminary detection of gamma rays from the Crab using a similar technique. Their data analysis is in progress (Smith et al. 1998, 2000). Although STACEE-32 was a prototype instrument, it achieved an unprecedentedly low energy threshold. The full STACEE detector will be completed in the year 2000, and will feature twice as many heliostats, improved trigger electronics, and 1 GHz sampling wave form digitizers. Based upon the STACEE-32 results, we expect that the full STACEE instrument will obtain its design goal of an energy threshold of D50 GeV. In the future, solar heliostat experiments such as STACEE, CELESTE (Giebels et al. 1998), and Solar Two (Zweerink et al. 1999) will provide complete spectral coverage at energies between D50 and 500 GeV for the Northern Hemisphere. These sorts of low threshold experiments will provide continuity between satellite measurements and ground-based detectors at TeV energies, and will naturally complement future satellite experiments such as GLAST.
We are grateful to the sta† at the NSTTF for their excellent support. We thank the Physics Division of Los Alamos National Laboratory for loans of electronic equipment. We also thank the SNO collaboration for providing us with acrylic for light concentrators, and the machine shop sta†s at Chicago and McGill for their assistance. The Whipple collaboration kindly provided us with optical pulsar data for testing our barycentering analysis. Many thanks to Tom Brennan, Katie Burns, Jaci Conrad, Jim Hinton, William Loh, Anthony Miceli, Gora Mohanty, Alex Montgomery, Heather Ueunten, and FrancÓois Vincent. This work was supported in part by the National Science Foundation, the Natural Sciences and Engineering Research Council, FCAR (Fonds pour la Formation de Chercheurs et lÏAide a` la Recherche), the Research Corporation, and the California Space Institute. CEC is a Cottrell Scholar of Research Corporation.
REFERENCES Atoyan, A. M., & Aharonian, F. A. 1996, MNRAS, 278, 525 Hillas, A. M. 1985, in Proc. 19th Int. Cosmic-Ray Conf. (Pasadena : CaliBarrau, A., et al. 1997, in Towards A Major Atmospheric Cerenkov Detecfornia Institute of Technology),1, 155 tor V (Kruger Park), ed. O. C. de Jager (Potchefstroom : Potchefstroom Hillas, A. M., et al. 1998, ApJ, 503, 744 Univ.), 166 Lessard, R. W., et al. 1999, ApJ, 531, L942 Chantell, M. C., et al. 1998, Nucl. Instrum. Methods, A408, 468 Li, T. P., & Ma, Y. Q. 1983, ApJ, 272, 317 Cheng, K. S., Ho, C., & Ruderman, M. 1986, ApJ, 300, 500 Ning, X., Winston, R., & OÏGallagher, J. 1987, Appl. Opt., 26, 300 Daugherty, J. K., & Harding, A. K. 1982, ApJ, 252, 337 Nolan, P. L., et al. 1993, ApJ, 409, 697 de Jager, O. C. 1994, ApJ, 436, 239 Ong, R. A., et al. 1996, Astropart. Phys., 5, 353 de Jager, O. C., & Harding, A. K. 1992, ApJ, 396, 161 Oser, S. M. 2000, Ph.D. thesis, Univ. Chicago de Jager, O. C., Harding, A. K., Michelson, P. F., Nel, H. I., Nolan, P. L., Ramanamurthy, P. V., et al. 1995, ApJ, 450, 791 Sreekumar, P., & Thompson, D. J. 1996, ApJ, 457, 253 Romani, R. W. 1996, ApJ, 470, 469 de Jager, O. C., Swanepoel, J. W. H., & Raubenheimer, B. C. 1989, A&A, Smith, D. A., et al. 1998, in Proc. of the 19th Texas Symposium on Ultrarel221, 180 ativistic Astrophysics, ed. J. Paul, T. Montmerle, & E. Aubourg (Paris : Fierro, J. M., Michelson, P. F., Nolan, P. L.,& Thompson, D. J. 1998, ApJ, CEA Saclay) 494, 734 ÈÈÈ. 2000, Nucl. Phys. Proc. Suppl., 80B, 163 Giebels, B., et al. 1998, Nucl. Instrum. Methods, A412, 329 Weekes, T. C. 1988, Phys. Rep., 160, 1 Grindlay, J. E., Helmken, H. F., & Weekes, T. C. 1976, ApJ, 209, 592 Zweerink, J. A., et al. 1999, in Proc. 26th Int. Cosmic-Ray Conf. (Salt Lake Helene, O. 1983, Nucl. Instrum. Methods, 212, 319 City), 5, 223