A Algorithms for Mining the Coevolving Relational Motifs in Dynamic Networks REZWAN AHMED, University of Minnesota GEORGE KARYPIS, University of Minnesota
Computational methods and tools that can efficiently and effectively analyze the temporal changes in dynamic complex relational networks enable us to gain significant insights regarding the entity relations and their evolution. This paper introduces a new class of dynamic graph patterns, referred to as coevolving relational motifs (CRMs), which are designed to identify recurring sets of entities whose relations change in a consistent way over time. Coevolving relational motifs can provide evidence to the existence of, possibly unknown, coordination mechanisms by identifying the relational motifs that evolve in a similar and highly conserved fashion. We developed an algorithm to efficiently analyze the frequent relational changes between the entities of the dynamic networks and capture all frequent coevolutions as CRMs. Our algorithm follows a depth-first exploration of the frequent CRM lattice and incorporates canonical labeling for redundancy elimination. Experimental results based on multiple real world dynamic networks show that the method is able to efficiently identify CRMs. In addition, a qualitative analysis of the results shows that the discovered patterns can be used as features to characterize the dynamic network. Categories and Subject Descriptors: G.2.2 [Graph Theory]: Graph mining; I.2.8 [Problem Solving, Control Methods, and Search]: Graph mining General Terms: Algorithms Additional Key Words and Phrases: Dynamic networks, Evolving pattern mining, Network evolution ACM Reference Format: Rezwan Ahmed and George Karypis, 2013. Algorithms for Mining the Coevolving Relational Motifs in Dynamic Networks. ACM Trans. Knowl. Discov. Data. V, N, Article A ( YYYY), 28 pages. DOI:http://dx.doi.org/10.1145/0000000.0000000
1. INTRODUCTION
Networks are generic models used in various applications from different domains to model the relations between various entities. Examples of some widely studied networks include the friends-networks of popular social networking sites like Facebook and Myspace [Boyd and Ellison 2007], the Enron email network [Borgwardt et al. 2006; Cohen 2005], co-authorship and citation networks [Liu et al. 2005; Lawrence et al. 1999; Chen and Redner 2010; Perc 2010], web-page linking networks [Brin and Page 1998; Liu 2007], protein-protein interaction networks [Hu 2005; Schwikowski et al. 2000], and networks derived from the IMDB movie database[Koren et al. 2007]. Many of these networks are dynamic in nature as the entities and relations that need to be modeled change over time. With the emergence of new application areas, there has been a great need to analyze the temporal changes underlying many of these systems, and to develop tools capable of capturing the dynamic aspects of the data, as well Author’s addresses: R. Ahmed and G. Karypis, Department of Computer Science & Engineering, University of Minnesota, Minneapolis, MN 55455. Email: {ahmed,karypis}@cs.umn.edu. Permission to make digital or hard copies of part or all of this work for personal or classroom use is granted without fee provided that copies are not made or distributed for profit or commercial advantage and that copies show this notice on the first page or initial screen of a display along with the full citation. Copyrights for components of this work owned by others than ACM must be honored. Abstracting with credit is permitted. To copy otherwise, to republish, to post on servers, to redistribute to lists, or to use any component of this work in other works requires prior specific permission and/or a fee. Permissions may be requested from Publications Dept., ACM, Inc., 2 Penn Plaza, Suite 701, New York, NY 10121-0701 USA, fax +1 (212) 869-0481, or
[email protected]. © YYYY ACM 1556-4681/YYYY/-ARTA $15.00 DOI:http://dx.doi.org/10.1145/0000000.0000000 ACM Transactions on Knowledge Discovery from Data, Vol. V, No. N, Article A, Publication date: YYYY.
A:2
R. Ahmed and G. Karypis
as analyze and process this data. Such analysis can identify relational patterns that provides strong observational evidence of the existence of mechanisms that control, coordinate, and trigger the evolutionary changes, which can be used to focus further ¨ 2012] analyzed various studies and analysis. A recent review [Holme and Saramaki dynamic networks and stated the need for tools to efficiently analyze and mine such networks. Additionally, a related body of research [Perc and Szolnoki 2010] presented the need for analyzing co-evolution in such networks while investigating the evolution of cooperation among humans in social dynamics. Dynamic networks have recently emerged as an important research area. The focus of this growing research has been mainly defining important recurrent structural patterns and developing algorithms for their identification. In recent years, studies have been done for finding frequent patterns [Borgwardt et al. 2006], clustering [Chakrabarti et al. 2006], characterizing network evolution rules [Berlingerio et al. 2009], detecting related cliques [Cerf et al. 2009; Robardet 2009], identifying conserved relational states [Ahmed and Karypis 2012], finding subgraph subsequences [Inokuchi and Washio 2010], and identifying co-evolution patterns capturing attribute trends [Jin et al. 2007; Desmier et al. 2012] in dynamic networks. Although the existing techniques can detect various patterns in a dynamic network, they have not focused on identifying frequent conserved changes of the relational patterns over time. Understanding the evolution of relational patterns that occur frequently can provide evidence of, possibly unknown, coordination mechanisms and to the existence of external factors that are responsible for changing the stable relational patterns in the dynamic network. Our contribution in this paper is two fold: Firstly, we introduce a new class of patterns, referred to as coevolving relational motifs (CRM), designed to capture patterns that change in a consistent way in a dynamic networks. CRMs identify consistent patterns of relational motif evolution that can provide valuable insights on the processes of the underlying networks. Secondly, we present an algorithm, referred to as CRMminer, to efficiently mine a subclass of these patterns by identifying all frequent coevolving relational motifs such that the motifs that make up the CRM share at least one relation (i.e., an edge) that changes over time. Our algorithm follows a depthfirst exploration of the frequent CRM lattice and incorporates canonical labeling for redundancy elimination. We impose both frequency based and node overlap based constraints for pruning the search space to increase efficiency and an approximate pruning to reduce the complexity of our algorithm. We provide a comprehensive evaluation of the performance of CRMminer and the usefulness of the discovered patterns. We experimentally evaluate the performance and scalability of CRMminer on a large co-authorship network, on a cell culture bioprocess network (multivariate time series data), and on a a market sales network (multivariate time series data) by varying different input parameters. Furthermore, our experiments show that the approximate version of CRMminer is able to identify the majority of the CRMs while reducing the amount of time that is required. In addition, we investigate some discovered coevolving relational motifs from all three datasets and provide a qualitative analysis of the information captured in them. We show that some of the discovered CRMs capture relational changes between the nodes that are thematically different (i.e., edge labels transition between two clusters of topics that have very low similarity). In addition, we investigate the extent to which these discovered CRMs can lead to high quality features to build a predictive model. Our results, in the context of a bioprocess dataset, show that the discovered CRMs are present mostly as part of the high yield production runs. The rest of the paper is organized as follows. Section 2 reviews some graph-related definitions and introduces the notation that is used in the paper. Section 3 captures ACM Transactions on Knowledge Discovery from Data, Vol. V, No. N, Article A, Publication date: YYYY.
Algorithms for Mining the Coevolving Relational Motifs in Dynamic Networks
A:3
a brief survey of the related research in this area. Section 4 introduces the concept of coevolving relational motifs and Section 5 describes in detail the algorithm to detect such patterns. Section 6 describes the datasets and metrics used in the experimental evaluation of our algorithm. Section 7 presents a detailed analysis of the experimental results and Section 8 provides some concluding remarks and future directions. 2. DEFINITIONS AND NOTATION
A relational network is represented via labeled graphs. A labeled graph G = (V, E, L[V ], L[E]) is composed of a set of nodes V modeling the entities of the network, a set of edges E modeling the relations between these entities, a set of node labels L[V ] modeling the type of the entities (|V | = |L[V ]|), and a set of edge labels L[E] modeling the type of the relations (|E| = |L[E]|). The labels assigned to the vertices (edges) are typically not unique and multiple vertices (edges) can have the same label. A subgraph G0 = (V 0 , E 0 , L[V 0 ], L[E 0 ]) of G is a graph such that V 0 ⊆ V , E 0 ⊆ E ∩ (V 0 × V 0 ). An induced subgraph G00 = (V 00 , E 00 , L[V 00 ], L[E 00 ]) of G is a graph such that V 00 ⊆ V , E 00 ⊆ E and ∀(u, v) ∈ E such that v ∈ V 00 and u ∈ V 00 , (u, v) ∈ E 00 . Given a connected graph G = (V, E) and a depth-first search (DFS) traversal of G, its depth-first search tree T is the tree formed by the forward edges of G. All nodes of G are encoded with subscripts to order them according to their discovery time. Given a DFS tree T of graph G containing n nodes, the root node is labeled as (v0 ) and the last discovered node is labeled as (vn−1 ). The rightmost path of the DFS tree T is the path from vertex v0 to vertex vn−1 . A dynamic network N = hG1 , G2 , . . . , GT i is modeled as a finite sequence of graphs, where each Gt = (V, Et , Lt [V ], Lt [Et ]) is a labeled graph describing the state of the system at a discrete time interval t. The term snapshot will be used to refer to each of the graphs in the sequence. Snapshots are assumed to contain the same set of nodes, which will also be referred to as the nodes of N , denoted by VN , but potentially different sets of edges and node/edge labels. When nodes appear or disappear over time, the set of nodes of each snapshot is the union of all the nodes over all snapshots. Also, the nodes across the different snapshots are numbered consistently, so that the ith node of Gk (1 ≤ k ≤ T ) will always correspond to the same ith node of N . We define the span sequence of an edge as the sequence of maximal-length time intervals in which an edge is present in a consistent state. An edge (u, v) is in a consistent state over a maximal time interval s : e if it is present in all snapshots Gs , . . . , Ge with the same label l and it is different in both Gs−1 and Ge+1 (assuming s > 1 and e < T ). The span sequence of an edge will be described by a sequence of vertex labels, edge labels and time intervals of the form h(lu1 , le1 , lv1 , s1 : e1 ), . . . , (lun , len , lvn , sn : en )i, where lui , lvi ∈ L[V ], lei ∈ L[E], si ≤ ei , and ei ≤ si+1 . An injection is defined as a function f : A → B such that ∀a, b ∈ A, if f (a) = f (b), then a = b. A function f : A → B is a bijective function or bijection, if f ∀b ∈ B, there is a unique a ∈ A such that f (a) = b. A function composition g ◦f implies that for function f : X → Y and g : Y → Z, then composite function g ◦ f : X → Z. A relational motif is a subgraph that occurs frequently in a single snapshot or a collection of snapshots. In Figure 1, the three-vertex subgraph consisting of the shaded nodes that are connected via the labeled edges corresponds to a relational motif that occurs a total of four times (twice in G1 and once in each of G2 and G3 ). The set of nodes that support the multiple occurrences of a relational motif do not need to be the same. In order to determine if a snapshot supports a relational motif (and how many times), we need to perform subgraph isomorphism operations (i.e., identify the embeddings of the relational motif ’s graph pattern). We will use M to denote a relational motif and the underlying subgraphs will be denoted by the tuple (N, A, L[N ], L[A]), where N is ACM Transactions on Knowledge Discovery from Data, Vol. V, No. N, Article A, Publication date: YYYY.
A:4
R. Ahmed and G. Karypis G1
G2
a
a c
a
b
a
b
c
a
b b
G3 a
a
a
a b
a
b
a
b
a
Fig. 1. Examples of relational motifs. The shaded nodes that are connected via the labeled edges corresponds to a relational motif.
the set of nodes, A is the set of edges (arcs), L[N ] is the set of node labels, and L[A] is the set of edge labels. 3. RELATED WORK
Unlike the problem of finding patterns in static networks for which there exist a considerable body of research [Kramer et al. 2001; Pei et al. 2001b; Zaki 2002; Asai et al. 2002; Inokuchi et al. 2000; Huan et al. 2003; Kuramochi and Karypis 2004; Hu et al. 2005; Pei et al. 2005; Yan et al. 2005], the problem of mining dynamic networks is comparatively less studied. Borgwardt et. al. [Borgwardt et al. 2006] introduced the notion of the dynamic subgraph, which extends the traditional notion of the subgraph to include the sequence of subgraphs that exist in a consecutive sequence of snapshots and developed algorithms to identify the set of dynamic subgraphs that occur frequently in a dynamic network. Jin et. al. [Jin et al. 2007] introduced the notion of the trend motif, which is a connected subgraph with nodes containing time series and each node’s time series exhibits a consistent trend over a time interval. Their work focused only on developing algorithms for finding frequently occurring trend motifs that show either an increasing or a decreasing trend. With a similar objective, Desmier et. al. [Desmier et al. 2012] defined the problem of mining cohesive co-evolving patterns which capture the local co-evolution of similar vertices at several timestamps based on their attributes trends. Lahiri et. al. [Lahiri and Berger-Wolf 2008] proposed a mining problem of finding periodic or near periodic subgraphs in dynamic networks. Berlingerio et. al. [Berlingerio et al. 2009] also provided an algorithm to detect frequent subgraphs in time-evolving graphs for deriving graph-evolution rules that satisfy a minimum confidence constraint. Robardet [Robardet 2009] represented the frequent patterns of a graph as pseudo-cliques and proposed an algorithm that first mines each graph snapshot of a dynamic graph for local patterns and then combines these with patterns from previous snapshot based on some constraints to form evolving patterns. Inokuchi et. al. [Inokuchi and Washio 2008; 2010] solved a similar problem of finding frequent induced subgraph subsequences from graph sequence data and capturing the changes of a subgraph over the subsequence. Ahmed et. al. [Ahmed and Karypis 2012] introduced a new class of patterns that captures the time-persistent relations among the nodes, called relational states and presented an algorithm to identify all maximal non-redundant evolution paths of the stable relational states of a dynamic network. A related body of research has investigated the task of identifying and tracking pat¨ terns in biological networks [You et al. 2009; Koyuturk et al. 2006; Wackersreuther ACM Transactions on Knowledge Discovery from Data, Vol. V, No. N, Article A, Publication date: YYYY.
Algorithms for Mining the Coevolving Relational Motifs in Dynamic Networks 1990
2000
A:5
2005 RM
RM
AE AE/IE/FG
AE
IE/FG AE/IE/FG
Legend AE Agricultural equipment PE Processing equipment ME Manufacturing equipment IE Industrial equipment RM Raw materials PM Processed materials FG Finished goods
PM
PE ME/FG
RM
AE IE/FG
RM
AE/IE/FG
IE/FG
AE
AE/IE/FG
PM
AE
RM
ME/FG
PE
IE/FG
RM
RM
AE
PE
PM
ME/FG AE
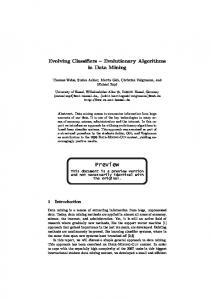
Fig. 2. An example of a coevolving relational motif in the context of a hypothetical country-to-country trading network where labels represent the commodities been traded.
et al. 2010], evolving communities in social networks [Berger-Wolf and Saia 2006; Duan et al. 2009], and evolutionary clustering [Chakrabarti et al. 2006; Tang et al. 2008]. Even though these methods provide valuable insights on the evolution of dynamic networks, the nature of co-evolving relational patterns focused in this paper is different from the various types of evolution addressed in other papers. 4. COEVOLVING RELATIONAL MOTIFS
Coevolving relational motifs are designed to identify the relational patterns that change in a consistent way over time. An example of this type of conservation is illustrated in Figure 2, in the context of a hypothetical country-to-country trading network where labels represent the commodities been traded. The network for 1990 shows a simple relational motif (M1 ) between pairs of nodes that occurs four times (shaded nodes and solid labeled edges). This relational motif has evolved in the network for 2000 in such a way so that in all four cases, a new motif (M2 ) that includes an additional node has emerged. Finally, in the network for 2005 we see that three out of these four occurrences have evolved to a new motif (M3 ) that now involves four nodes. This example shows that the initial relational motif among the four sets of nodes has changed in a fairly consistent fashion over time (i.e., it coevolved) and such a sequence of motifs M1 ; M2 ; M3 represents an instance of a CRM. CRMs identify consistent patterns of relational motif evolution that can provide valuable insights on the processes of the underlying networks. For example, the CRM of Figure 2 captures the well-known phenomenon of production specialization due to economic globalization, in which the production of goods have been broken down into different components performed by different countries [Friedman 2005]. Similarly, CRMs in health-care networks can capture how the set of medical specialties required to treat certain medical conditions have changed over the years, in communication networks CRMs can capture the evolution of themes being discussed among groups of individuals as their lifestyles change, whereas CRMs in corporate email networks can capture how the discussion related to certain topics moves through the companies’ hierarchies. The formal definition of a CRM that is used in this paper is as follows: Definition 4.1 A CRM of length m is a tuple {N, hM1 , . . . , Mm i}, where N is a set of vertices and each Mj = (Nj , Aj ) is a relational motif defined over a subset of the vertices of N that satisfies the following constraints: i) it occurs at least φ times, ii) each occurrence uses a non-identical set of nodes, iii) Mj 6= Mj+1 , and iv) |Nj | ≥ β|N | where 0 < β ≤ 1. ACM Transactions on Knowledge Discovery from Data, Vol. V, No. N, Article A, Publication date: YYYY.
A:6
R. Ahmed and G. Karypis
A relational motif Mj is defined over a subset of vertices N if there is a injection ξj from Nj to N . An m-length CRM occurs in a dynamic network whose node set is V if there is a sequence of m snapshots hGi1 , Gi2 , . . . , Gim i and a subset of vertices B of V (i.e., B ⊆ V ) such that: i) there is a bijection ξ from N to B ii) the injection ξ ◦ ξj is an embedding of Mj in Gij iii) there is no embedding of Mj via the injection ξ ◦ ξj in Gij+1 or no embedding of Mj+1 via the injection ξ ◦ ξj+1 in Gij . For example, the number of occurrences of the CRM in Figure 2 is 3. Note that the third condition in the above definition is designed to ensure that for each pair of successive motifs at least one of them is not supported by the snapshot-nodes pair that supported the other motif. This is done to ensure that there is a relational change between the nodes associated with those embeddings in each others snapshot. The purpose of the parameters φ and β in Definition 4.1 are as follows: The parameter φ is used to eliminate sequences of evolving motifs that are not frequent enough to indicate the existence of an underlying process driving these changes. The parameter β is used to control the degree of change between the sets of nodes involved in each motif of a CRM and enforces a minimum node overlap among all motifs of CRM. Finally, the third constraint of Definition 4.1 limits the discovered CRMs to only an evolving sequence of motifs and not a sequence that remains the same. Note that the frequent dynamic subgraphs introduced by Borgwardt et. al. [Borgwardt et al. 2006] (Section 3) correspond to CRMs in which the snapshots supporting each set of nodes are restricted to be consecutive and β = 1. In this paper we focus on developing an efficient algorithm to mine a subclass of the CRMs, such that in addition to the conditions mentioned in Definition 4.1, the motifs that make up the CRM, also share at least one edge that itself is a CRM. Formally, we focus on identifying the CRMs c = {Nc , hM1 , . . . , Mm i} that contain at least a pair of 0 vertices {u, v} ∈ NC such that each induced subgraph Mi of Mi on {u, v} is connected 0 0 and x = {{u, v}, hM1 , . . . , Mm i} is a CRM. A CRM like x that contains only one edge and two vertices will be called an anchor. We focus our CRM enumeration problem around the anchors, since they ensure that the CRM’s motifs contain at least a pair of nodes in common irrespective of the specified overlap constraint that evolves in a conserved way. It also characterizes how the network around these core set of entities coevolved with them. We will refer to the class of CRMs that contain an anchor as anchored CRMs. For the rest of the discussion, any references to a CRM will assume it is an anchored CRM. Given the above definition, the work in this paper is designed to develop efficient algorithm for solving the following problem: Problem 1 Given a dynamic network N containing T snapshots, a user defined minimum support φ (1 ≤ φ), a minimum number of edges kmin per CRM, and a minimum number of motifs mmin per CRM, find all CRMs such that the motifs that make up the CRM, also share an anchor CRM. A CRM that meets the requirements specified in Problem 1 is referred as a frequent CRM and it is valid if it also satisfies the minimum node overlap constraint (Definition 4.1(iv)). 5. FINDING COEVOLVING RELATIONAL MOTIFS
A consequent of the way anchored CRMs are defined is that the number of motifs that they contain is exactly the same as the number of motifs that exist in the anchor(s) that they contain. As a result, the CRMs can be identified by starting from all the ACM Transactions on Knowledge Discovery from Data, Vol. V, No. N, Article A, Publication date: YYYY.
Algorithms for Mining the Coevolving Relational Motifs in Dynamic Networks M1
M2
M3 GDR
ITA
BEL
RM
AE
v1 NTH
v1
v0
v1
BEL
NTH
BEL
NTH
v3
ω ω
v0
ω
ω ω RM
GDR GDR
v2
ω AE PE
AE
BEL BEL BEL
PM
ME/FG
v0
ω ω ITA
GDR
v2 PE
IE/FG
AE/IE/FG
v0
RM
v3
v2 AE
A:7
AE/IE/FG IE/FG ME/FG
ω RM PM
v1 NTH NTH NTH
Fig. 3. A CRM Representation. The CRM c consists of 3 motifs hM1 , M2 , M3 i and represents relations among vertices N = {v0 , v1 , v2 , v3 } using 5 edges. Gc (bottom graph) shows the CRM representation capturing vertex and edge label vectors.
available anchors and try to grow them by repeatedly adding edges as long as the newly derived CRMs satisfy the constraints and have exactly the same number of motifs as the anchor. Since a CRM can contain more than one anchor, this approach may identify redundant CRMs by generating the same CRM from multiple anchors. Therefore, the challenge is to design a strategy that is complete and non-redundant. To achieve this, we develop an approach that generates each CRM from a unique anchor. Given a CRM, the anchor from which it will be generated is referred to as its seed anchor. The algorithm that we developed, named CRMminer, for finding all non-redundant valid CRMs (Problem 1) initially identifies all frequent anchors and then performs a depth-first exploration of each anchor pattern space along with a canonical labeling that is derived by extending the ideas of the minimum DFS code [Yan and Han 2002] to the case of CRMs for redundancy elimination. We impose frequency-based constraints by stopping any further exploration of a CRM when the pattern does not occur at least φ times in the dynamic network N . 5.1. CRM Representation
A CRM c = {N, hM1 , . . . , Mm i} is represented as a graph Gc = (N, Ec ), such that an edge (u, v) ∈ Ec is a 5-item tuple (u, v, lu , lu,v , lv ), where u, v ∈ N , the vectors lu and lv contain the vertex labels and lu,v contains the edge labels of all motifs. If the CRM consists of m motifs, then lu = hlu1 , . . . , lum i, lv = hlv1 , . . . , lvm i and lu,v = hlu1 ,v1 , . . . , lum ,vm i. The kth entry in each vector lu , lu,v , and lv records the connectivity information among the vertices of the kth motif (Mk ). If an edge (u, v) is part of motif Mk , then the kth entry of lu , lv , and lu,v are set to the labels of u and v vertices, and the label of the (u, v) edge respectively. If both vertices u and v are part of motif Mk , but the (u, v) edge is not, or at least one of the vertices u or v is not part of the Mk motif (i.e., no (u, v) edge is possible), then ω is inserted at the kth entry of the lu,v to capture the ACM Transactions on Knowledge Discovery from Data, Vol. V, No. N, Article A, Publication date: YYYY.
A:8
R. Ahmed and G. Karypis
disconnected state. Similarly, if u or v does not have any incident edges in the Mk motif (i.e., the vertices are not present in that motif), then ω is added as the vertex label at the kth entry of lu or lv . Note that the value of ω is lexicographically greater than the maximum edge and vertex label. This representation is illustrated in Figure 3. The CRM consists of 3 motifs hM1 , M2 , M3 i and represents relations among vertices N ={v0 , v1 , v2 , v3 } using 5 edges. The edge between (v0 , v1 ) exists in all 3 motifs capturing changes in relation as the edge label changes from AE/IE/F G ; IE/F G ;M E/F G. It is represented as lv0 =hBEL, BEL, BELi, lv1 =hN T H, N T H, N T Hi, and lv0 ,v1 =hAE/IE/F G, IE/F G, M E/F Gi. The next edge between (v1 , v2 ) appears in 2 motifs and the label vectors are represented as lv1 =hN T H, N T H, N T Hi, lv2 =hω, GDR, GDRi, and lv0 ,v1 =hω, RM, P M i. Following similar process, we can represent edges (v2 , v0 ), (v2 , v3 ), and (v3 , v0 ). 5.2. Mining Anchors
The search for CRMs is initiated by locating the frequent anchors that satisfy the CRM definition and the restrictions defined in Problem 1. This is done as following: Given a dynamic network N , we sort all the vertices and edges by their label frequency and remove all infrequent vertices and edges. Remaining vertices and edges are relabeled in decreasing frequency. We determine the span sequences of each edge and list every edge’s span sequence if that sequence contains at least a span with an edge label that is different from the rest of the spans. At this point, we use the sequential pattern mining technique prefixSpan [Pei et al. 2001a] to determine all frequent span sequences. Since the frequent sequences can be partial sequences of the original input span sequences, it is not guaranteed that they all contain consecutive spans with different labels. Thus, the frequent sequences that contain different consecutive spans in terms of label are considered as the anchors. The number of spans in a frequent span sequence corresponds to the total number of motifs in the anchor. 5.3. CRM Enumeration
Given an anchor c, we generate the set of desired CRMs by growing the size of the current CRM one edge at a time following a depth-first approach. To ensure that each CRM is generated only once in the depth-first exploration, we use an approach similar to the gSpan algorithm [Yan and Han 2002], which we have extended for the problem of CRM mining. gSpan explores the frequent pattern lattice in a depth-first fashion. The pattern lattice is represented as a hierarchical search space where each node corresponds to a connected frequent pattern, the highest node being an empty pattern (i.e., a single vertex), the next level nodes represent 1-edge patterns, and so on. The nth level nodes, which represent n-edge patterns, contain one more edge than the corresponding (n − 1) level nodes. To ensure that each frequent pattern in this lattice is visited exactly once, gSpan’s exploration amounts to visiting the nodes of the lattice (i.e., frequent patterns) by traversing a set of edges that form a spanning tree of the lattice. This spanning tree is defined by assigning to each node of the lattice a canonical label, called the minimum DFS code. A DFS code of a graph, is a unique label that is formed based on the sequence of edges added to that node during a depth-first exploration. The minimum DFS code, is the DFS code that is lexicographically the smallest. Given this canonical labeling, the set of lattice edges that are used to form the spanning tree correspond to the edges between two successive nodes of the lattice (parent and child) such that the minimum DFS code of the child can be obtained by simply appending the extra edge to the minimum DFS code of the parent. For example, given a DFS code α = ha0 , a1 , · · · , am i, a valid child DFS code is γ = ha0 , a1 , . . . , am , bi, where b ACM Transactions on Knowledge Discovery from Data, Vol. V, No. N, Article A, Publication date: YYYY.
Algorithms for Mining the Coevolving Relational Motifs in Dynamic Networks
A:9
is the new edge. This spanning tree guarantees that each node has a unique parent and all nodes are connected [Yan and Han 2002]. To efficiently grow a node, gSpan generates the child nodes by only adding those edges that originate from the vertices on the rightmost path of the DFS-tree representation of the parent node. It then checks whether the resulting DFS code of the child node corresponds to the minimum DFS code. Construction of the child nodes generated by adding other edges (i.e., not from the rightmost path) are skipped, since such child nodes will never contain a DFS code that corresponds to the minimum DFS code. In order to apply the ideas introduced by gSpan to the problem of efficiently mining CRMs, we need to develop approaches for (i) representing the DFS code a CRM, (ii) ordering the DFS codes of a CRM using the DFS lexicographic ordering, (iii) representing the minimum DFS code of a CRM to use as the canonical label, and (iv) extending a DFS code of a CRM by adding an edge. Once properly defined, the correctness and completeness of frequent CRM enumeration follows directly from the corresponding proofs of gSpan. 5.3.1. DFS code of a CRM. In order to derive a DFS code of a CRM, we need to develop a way of ordering the edges. Given a CRM c, represented as a graph Gc = (N, Ec ), we perform a depth-first search in Gc to build a DFS tree Tc . The vertices (N ) are assigned subscripts from 0 to n − 1 for |N | = n according to their discovery time. The edges (Ec ) are grouped into two sets: the forward edge set ETc ,f w = {(vi , vj ) ∈ Ec | i < j} and the backward edge set ETc ,bw = {(vi , vj ) ∈ Ec | i > j}. Let us denote a partial order on ETc ,f w as ≺Tc ,f w , a partial order on ETc ,bw as ≺Tc ,bw , and a partial order on Ec as ≺Tc ,bw+f w . Given two edges e1 = (vi1 , vj1 ) and e2 = (vi2 , vj2 ), the partial order relations are defined as:
a) b) c) d)
∀e1 , e2 ∈ ETc ,f w , if j1 < j2 , then e1 ≺Tc ,f w e2 . ∀e1 , e2 ∈ ETc ,bw , if i1 < i2 or (i1 = i2 and j1 < j2 ), then e1 ≺Tc ,bw e2 . ∀e1 ∈ ETc ,bw and ∀e2 ∈ ETc ,f w , if i1 < j2 , then e1 ≺Tc ,bw+f w e2 . ∀e1 ∈ ETc ,f w and ∀e2 ∈ ETc ,bw , if j1 ≤ i2 , then e1 ≺Tc ,bw+f w e2 .
The combination of the three partial orders defined above enforces a linear order ≺Tc ,Ec on Ec . Given this linear order ≺Tc ,Ec , we can order all edges in Gc and construct an edge sequence to form a DFS code of a CRM, denoted as code(c, Tc ). An edge of the DFS code of a CRM is represented similar to the CRM edge definition and uses a 5-tuple representation (i, j, li , li,j , lj ), where i and j are the DFS subscripts (i.e., the discovery time) of the vertices, and li , lj , and li,j are the label vectors of the vertices and edge, respectively. The kth entry in each vector li , lj , and li,j contains the labels of vertices and edges of motif Mk . For example, Figure 4 presents two CRMs and their corresponding DFS codes. The DFS codes are listed below to show the sequence of edges and their differences (i.e., the edge labels): CRM C1 - Figure 4 (a) h(0, 1, ha, a, bi, hX, Y, Xi, hb, c, ci), (1, 2, hb, c, ci, hY, ω, Yi, hc, c, fi), (2, 0, hc, c, fi, hZ, ω, ωi, ha, a, bi), (2, 3, hc, c, fi, hω, Z, Zi, hω, d, gi)i
CRM C2 - Figure 4 (c) h(0, 1, ha, a, bi, hX, Y, Xi, hb, c, ci), (1, 2, hb, c, ci, hY, Z, ωi, hc, c, fi), (2, 0, hc, c, fi, hω, ω, Zi, ha, a, bi), (2, 3, hc, c, fi, hω, ω, Zi, hω, d, gi)i
Note that the kth entry of a vertex and edge label vector of a DFS code is filled with ω if the corresponding vertex or edge is not present in motif Mk . DFS code’s Neighborhood restriction property defined in [Yan and Han 2002] still holds for DFS code of a CRM.
ACM Transactions on Knowledge Discovery from Data, Vol. V, No. N, Article A, Publication date: YYYY.
A:10
R. Ahmed and G. Karypis M1
M2
a
a
v0 Z
X
(a)
v1 b
Y
b
v0
v1 v2
v1
c c
b c c
v2
c
Z
d
Y
v2
f
v3
Z
g
v3
v0 DFS Code:
Z ω ω
X Y X
(b)
v0 X
Y
c a a b
M3
Y ω Y c c f
v1
v2
ω Z Z
ω d g
(v0,v1) (v1,v2) (v2,v0) (v2,v3)
= = = =
(0,1, (1,2, (2,0, (2,3,
, , ) , , ) , , ) , , )
v3
M1
M2
a
a
v0 X
M3 b
v0
v0 Z
X
Y
(c) v1 b
Y
v1 v2
c
c
c a a b
b c c
v2
c f
v2
Z
g
v3
v0 X Y X
(d)
v1
Z
v1
DFS Code:
ω ω Z Y Z ω c c f
v2
ω ω Z
ω ω g
(v0,v1) (v1,v2) (v2,v0) (v2,v3)
= = = =
(0,1, (1,2, (2,0, (2,3,
, , ) , , ) , , ) , , )
v3
Fig. 4. DFS code for two CRMs represented as a sequence of edges (v0 , v1 ), (v1 , v2 ), (v2 , v0 ), and (v2 , v3 ). (a) Presents CRM C1 consisting of 3 motifs, 4 vertices, and 4 edges. (b) Presents GC1 and the corresponding DFS code for CRM C1 . (c) Presents CRM C2 consisting of 3 motifs, 4 vertices, and 4 edges. (d) Presents GC2 and the corresponding DFS code for CRM C2 .
5.3.2. DFS Lexicographic Ordering. To establish a canonical labeling system for a CRM, CRMminer defines the DFS lexicographical ordering based on the CRM’s DFS code definition. The linear ordering is defined as follows. Let two DFS codes of a CRM consisting of m motifs be α = code(cα , Tα ) = he0α , e1α , . . . , epα i and δ = code(cδ , Tδ ) = he0δ , e1δ , . . . , eqδ i, where p and q are the number of edges in α and δ, and 0 ≤ p, q. Let the forward and backward edge set for Tα and Tδ be Eα,f w , Eα,bw , Eδ,f w , and Eδ,bw , respecACM Transactions on Knowledge Discovery from Data, Vol. V, No. N, Article A, Publication date: YYYY.
Algorithms for Mining the Coevolving Relational Motifs in Dynamic Networks
A:11
tively. Also, let exα = (ixα , jαx , lixα , lixα ,jαx , ljαx ) and eyδ = (iyδ , jδy , liyδ , liyδ ,jδy , ljδy ) be two edges, one in each of the α and δ DFS codes. Now, exα < eyδ , if any of the following is true: i) ii) iii) iv) v) vi) vii)
exα exα exα exα exα exα exα
∈ Eα,bw and eyδ ∈ Eδ,f w , or ∈ Eα,bw , eyδ ∈ Eδ,bw , and jαx < jδy , or ∈ Eα,bw , eyδ ∈ Eδ,bw , jαx = jδy and lixα ,jαx < liyδ ,jδy , or ∈ Eα,f w , eyδ ∈ Eδ,f w , and iyδ < ixα , or ∈ Eα,f w , eyδ ∈ Eδ,f w , ixα = iyδ and lixα < liyδ , or ∈ Eα,f w , eyδ ∈ Eδ,f w , ixα = iyδ , lixα = liyδ and lixα ,jαx < liyδ ,jδy , or ∈ Eα,f w , eyδ ∈ Eδ,f w , ixα = iyδ , lixα = liyδ , lixα ,jαx = liyδ ,jδy , and ljαx < ljδy .
Based on the above definitions, we derive the following conditions to compare two DFS codes of a CRM. We define α ≤ δ, iff any of the following conditions is true: a) Fω (α) ≤ Fω (δ), where Fω (x) is the number of edges (litx ,jxt ) that are set to ω, or b) ∃t, 0 ≤ t ≤ min(p, q), ekα = ekδ for k < t, and etα < etδ , or c) ekα = ekδ for 0 ≤ k ≤ p and p ≤ q. Note that the DFS lexicographical ordering ranks edges with label vectors containing no ω labels higher than the edges which does. To define the relation between ω and valid vertex/edge label, the value of ω is set to a lexicographically higher value than the maximum edge and vertex label. This is important as we show later in Section 5.3.5. In order to provide a detailed example of the DFS lexicographical ordering, let us compare the DFS codes of CRMs C1 and C2 presented in Figure 4 following the rules presented above. For both the DFS codes, the first edge (v0 , v1 ) is the same. In case of the second edge (v1 , v2 ), both the DFS codes contain the same vertex label vectors. However, the edge label vectors are different and the edge label vector hY, Z, ωi of DFS code 2 is smaller than hY, ω, Y i DFS code 1. Thus, DFS code 2 is lexicographically smaller than DFS code 1. 5.3.3. Minimum DFS Code. A CRM can be represented by different DFS trees resulting in different DFS codes. To define a canonical label for a CRM, we select the minimum DFS code according to the DFS lexicographic order, represented by min code(c). Similar to simple graph isomorphism, given two CRMs c and c0 , c is isomorphic to c0 if and only if min code(c) = min code(c0 ). Thus, by searching frequent minimum DFS codes, we can identify the corresponding frequent CRMs. 5.3.4. Pattern lattice growth. The difference between a simple graph pattern and a CRM is the vertex/edge label representation. One contains a single label and the other contains a label vector (i.e., sequence of labels including an empty label ω). The growth of a simple graph by one edge results in a number of simple graphs based on the number of unique labels of the frequent edges on the rightmost path. However, a CRM extended by an edge can generate large number of CRMs, since these are formed based on the combination of the label vectors of the frequent edges on the rightmost path. In Figure 5, we illustrated one edge growth of a simple graph and a CRM according to rightmost extension. Both the simple graph and the CRM are expanded by adding a frequent edge (v2 , v3 ). In case of the simple graph (Figure 5(a)), the original DFS code consisted sequence of two edges (v0 , v1 ) and (v1 , v2 ) represented as (0, 1, a, X, b) and (1, 2, b, Y, c). After the one edge extension, the new edge (2, 3, c, Z, d) connected the new vertex v3 to the rightmost vertex v2 . When the CRM is considered (Figure 5(c)), the original DFS code consisted the same sequence of edges {(v0 , v1 ), (v1 , v2 )} represented as: (0, 1, ha, a, bi, hX, Y, Xi, hb, c, ci), (1, 2, hb, c, ci, hY, ω, Y i, hc, ω, f i). Based on the combination of the label vectors of vertices v2 and v3 , and edge (v2 , v3 ), we have the ACM Transactions on Knowledge Discovery from Data, Vol. V, No. N, Article A, Publication date: YYYY.
A:12
R. Ahmed and G. Karypis (v0,v1) = (0,1, a, X, b) (b) (v1,v2) = (1,2, b, Y, c)
a v0
New Edge:
(v2,v3) = (2,3, c, Z, d)
X
(v0,v1) = (0,1, , , ) (v1,v2) = (1,2, , , )
v1
(a)
Y
b
v2 c
(d)
Z
New Edges:
(v2,v3) = (2,3, , , ) (v2,v3) = (2,3, , , ) (v2,v3) = (2,3, , , )
v3 d M1
a
M2
v0 X (c) b
M3
a
v1 Y v2 c
c
b v0
v0
Y
X v1
v1
c c
v2
Y v2
Z
v3 d
f
Z g
v3
Fig. 5. Adding an edge according to rightmost extension rules. (a) Extending a simple graph, (b) DFS code of the simple graph, (c) extending a CRM, and (d) DFS code of the CRM.
following options for the (v2 , v3 ) edge: (2, 3, hc, c, f i, hω, Z, Zi, hω, d, gi), (2, 3, hc, ω, f i, hω, ω, Zi, hω, ω, gi), and (2, 3, hc, c, f i, hω, Z, ωi, hω, d, ωi). Note that we allow a CRM to grow by an edge that may not be present or frequent in all motifs of that CRM to ensure complete set of the results. To efficiently determine the frequent candidate edges during the rightmost extension, we apply the sequential pattern mining technique [Pei et al. 2001a]. Even though there can be significantly more number of child CRMs from one edge extension of a CRM than a simple graph, the extended lexicographic ordering is able to order all candidates and enable us to perform pre-order search on the pattern lattice. Since traversal of the pattern lattice of a CRM remains similar to a simple graph, it allows CRMminer to prune the pattern with non-minimum DFS codes and their descendants similar to gSpan without impacting the completeness of the results. 5.3.5. Algorithm Completeness. To eliminate redundancy during the CRM expansion process, we use minimum DFS code as the canonical label and construct the pattern lattice to ensure that every node (i.e., a CRM) is connected to a unique parent and grown via single edge addition. This process ensures that each potential CRM is only explored once. To ensure that all discovered CRMs contain at least one anchor, we show how we can identify an anchor of a valid CRM. Given a valid CRM c and its canonical label (i.e., the minimum DFS code) min code(c) = he1 , e2 , . . . , ek i, where ei is an edge in the lexicographically ordered edge sequence. We claim that the first edge (e1 ) of the canonical label of a CRM (c) is an anchor of that CRM. To prove this claim, assume e1 is not an anchor and ex is an anchor, where 1 < x ≤ k. Given the graph in CRM c, we can construct a DFS code for c that starts with ex as the first edge. Assume, the new DFS code is represented as code(c) = hex , ep1 , . . . , epk−1 i, where hep1 , . . . , epk−1 i is an edge sequence containing a permutation of the edges {e1 , . . . , ek } \ {ex }. Since e1 is not an anchor, it contains some ω labels. Based on the DFS lexicographic ordering and ex being an anchor, ex < e1 . Hence, we can state that hex , ep1 , . . . , epk−1 i < he1 , e2 , . . . , ek i. This is a contradiction, since he1 , e2 , . . . , ek i is the minimum DFS code of c. Thus, e1 is ACM Transactions on Knowledge Discovery from Data, Vol. V, No. N, Article A, Publication date: YYYY.
Algorithms for Mining the Coevolving Relational Motifs in Dynamic Networks
A:13
an anchor of CRM c. Given that the first edge is an anchor, then CRMminer will generate that CRM by starting from the anchor and then following its right-most extension rule to add the rest of the edges one by one. 5.4. Search space pruning
One of the challenges that any graph mining algorithm needs to handle is the exponential growth of the search space during enumeration. Traditionally, user specified constraints are used to prune the search space. To ensure discovery of the complete set of patterns, the pruning constraints need to have the anti-monotonicity property. For CRMminer, we use both support measure and minimum overlap constraints to prune the search space. 5.4.1. Minimum Support (φ). To efficiently search patterns in a single large graph using a minimum support constraint, the support measure needs to guarantee the anti-monotonicity property. Bringmann [Bringmann and Nijssen 2008] presented the minimum image based support measure to prune the search space in a single large graph. Given a pattern p = (Vp , Ep , Lp ) and a single large graph G = (VG , EG , LG ), this measure identifies the vertex in p which is mapped to the least number of unique vertices in G and uses this number as the frequency of p in G. To formally define the support measure, let each subgraph g of G that is isomorphic to p be defined as an occurrence of p in G. For each occurrence g, there is a function ϕ : Vp → VG that maps the nodes of p to the nodes in G such that (i) ∀v ∈ Vp ⇒ Lp (v) = LG (ϕ(v)) and (ii) ∀(u, v) ∈ Ep ⇒ (ϕ(u), ϕ(v)) ∈ EG . The minimum image based support of a pattern p in G is defined as:
σ(p, G) = min | {ϕi (v): ϕi is an occurrence of p in G} |. v∈Vp
(1)
This minimum image based support is anti-monotonic [Bringmann and Nijssen 2008]. We adopted the minimum image based support measure to calculate the minimum support of a CRM in a dynamic network. As defined in Section 2, a dynamic network N can be represented as a single large graph where the nodes N are considered as the vertices of the large graph. Hence, it is possible to calculate the least number of unique vertices of the dynamic network that are mapped to a particular vertex of a CRM. Given a CRM c = {Nc , hM1 , M2 , . . . , Mm i} in a dynamic network N = {VN , hG0 , G1 , . . . , GT i} where m ≤ T , the minimum image based support of c is defined as: σ(c, N ) = min | {ϕi (v): ϕi is an occurrence of c in N } |. v∈Vc
(2)
Similar to the support measure of a pattern in a single large graph, by selecting the support of the vertex in c that has the least number of unique mapping in N , we maintain the anti-monotonicity property. Recall from Section 5.3.4 that the frequent candidate edges are identified using frequent sequence mining. Since we use the minimum image based support measure, the frequent edges detected by the sequence mining tool may not have sufficient support when calculated using such measure. Thus, we compute the minimum image based support for all candidate edges to only consider the edges that ensures the CRM extension to have sufficient minimum image based support. 5.4.2. Minimum Overlap (β). Each motif of a CRM needs to contain at least a minimum percentage of the nodes from all the nodes of the CRM. This minimum node ACM Transactions on Knowledge Discovery from Data, Vol. V, No. N, Article A, Publication date: YYYY.
A:14
R. Ahmed and G. Karypis M0
(1)
(2)
(3)
M1
M2 v0
v0
v0
A
B
A
v1 B
v1
v1
v2
Min. Overlap = 2/3 = 66% B v2
v0
v0
v0
A
B
A
v3
v1 B
v1
v1
C B v2
v2
v0
v0 D
A
B
v1 B
v1
v2
v3
v0 D A v1
v3 C
Min. Overlap = 2/4 = 50%
Min. Overlap = 3/4 = 75%
B v2
Fig. 6. Example of a CRM growth when the minimum overlap constraint is not anti-monotonic. Assume the minimum overlap constraint is 60%.
overlap threshold (defined as β in Section 4) controls the degree of change that is allowed between the sets of nodes in each motif of a CRM. Given a CRM c = {Nc , hM1 , M2 , . . . , Mm i} containing m motifs, the minimum overlap of a CRM is defined as: min {|VMi |} 1≤i≤m , (3) ρ(c) = |Nc | where VMi is the set of nodes in motif Mi . Even though the minimum overlap constraint is a reasonable approach to ensure that the motifs that make the CRM are coherent, it is not anti-monotonic [Zhu et al. 2007]. Thus, to generate a complete set of CRMs that meet user specified thresholds of support and overlap, we cannot prune CRMs that do not satisfy this constraint as CRMs derived from it can satisfy the constraint. For example, let us assume the minimum overlap threshold is 60% in Figure 6. In step (1), motif M1 contains 2 out of 3 nodes of the CRM (i.e., the minimum). Therefore, the minimum overlap at step (1) (2/3 > 60%) is valid. We added vertex v3 by including edge (v2 , V3 ) to the CRM at step (2). This dropped the minimum overlap (2/4) below the threshold. However, in step (3), inclusion of edge (v3 , v0 ) adds vertex v3 to motif M1 . This increases the minimum overlap to be 3/4 and makes the CRM valid again. Hence, we need to enumerate all CRMs that meet the support threshold and then search the output space for CRMs that meet the minimum overlap requirement. To improve the performance, we developed an approximate version of our algorithm, named CRMminerx , that discovers a subset of the valid CRMs (i.e., meet the constraints of Definition 4.1) by pruning the pattern lattice using the minimum overlap threshold. We first check whether a CRM meets the overlap threshold. If it does, we continue the enumeration process. If it does not, then we check whether any of the patterns at the previous level of the pattern lattice from which the current pattern was derived, referred as parent CRMs, meet the overlap threshold. If at least one does, we continue enumeration. If none of the parent CRMs meet the overlap threshold, we prune that CRM. To approximately calculate the minimum overlap of the parent CRMs, we do not generate all possible parent patterns. The parent is defined to contain one less node than the current CRM; thus, we remove a node v ∈ Nc . In such case, the parent pattern will contain (|Nc | − 1) nodes and each motif Mi may contain (|VMi | − 1) nodes if v ∈ VMi or (|VMi |) nodes if v ∈ / VMi . For at least one parent CRM to meet the overlap threshold, ACM Transactions on Knowledge Discovery from Data, Vol. V, No. N, Article A, Publication date: YYYY.
Algorithms for Mining the Coevolving Relational Motifs in Dynamic Networks M0
Step 1
Step 2
M1 v0
v0
X
Y
X
v1
v1
v1
v0
v0
v0
X
Y
X
v1
v1 Y
v0
v0
X
Y
X
v1
v1
v1 Y
Y
v2
v0 Step 3
Step 4
M2
v0
v1
Y
v2
v0
v0
v0
X
Y
X
v1
Y
v1 v2
A:15
v1 Y
Min. Overlap = 2/2 = 100%
Min. Overlap = 2/3 = 66% v2
Min. Overlap = 2/4 = 50% v2 Y v3
v4 Z
Min. Overlap = 2/5 = 40%
v2 Y v3
Fig. 7. Minimum overlap calculation based on (4) is used for search space pruning during the CRM enumeration process. Assuming β = 60%, this CRM enumeration terminates at step 4.
we consider the best case when v ∈ / VMi . Therefore, the minimum overlap threshold of a parent CRM cp of the CRM c = {Nc , hM1 , M2 , . . . , Mm i} is defined as: min {|VMi |}
ρ(cp ) =
1≤i≤m
|Nc | − 1
.
(4)
In Figure 7, we illustrate the minimum overlap calculation during search space pruning. Assume the user specified β = 60%. We start with the anchor at step 1 when the minimum overlap threshold is 100%. Next the edge (v1 , v2 ) is added for motif M0 and M2 and the minimum overlap based on motif M1 is (2/3) = 66%. Since the β threshold is met, we continue the enumeration process. At step 3, an edge (v2 , v3 ) is added to motif M2 . Since motif M1 contains the lowest number of nodes, the minimum overlap is (2/4) = 50%, which does not meet the β threshold. At this point, we check whether any of the parent CRM meets the β threshold and the minimum threshold for it’s parent is (2/(4 − 1)) = 66% > β. Thus, we continue the enumeration by adding an edge (v3 , v4 ) to motif M2 at step 4. The minimum overlap is (2/5) = 40% and it’s parent overlap threshold is (2/(5 − 1)) = 50%. Both thresholds are lower than β, hence we stop enumerating this CRM any further. 6. EXPERIMENTAL DESIGN
All experiments are conducted on a 64-bit Linux desktop with 8-core Intel Core i7-3770 processor at 3.40GHz and 16GB of RAM. 6.1. Datasets
We have used two different types of datasets to evaluate CRMminer. The DBLP co-authorship network is a real world dynamic network that captures yearly coauthorship relations. The bioprocess network (GT) and the sales network (Sales) datasets are based on multivariate time-series data. To characterize the relations among different variables and understand changes over time, we represent the timeACM Transactions on Knowledge Discovery from Data, Vol. V, No. N, Article A, Publication date: YYYY.
A:16
R. Ahmed and G. Karypis Table I. Dynamic Network Datasets. Dataset
#Vertices
#Edeges 66
Span
Avg. #Edeges
Avg. Degree
DBLP GT Sales
1,057,524 3458 2697
4,841,084 83,454 138,044
55 47 66
88,020 1776 2092
0.08 0.51 0.78
#Vertices denotes the total number of vertices in the dynamic network. #Edeges denotes the total number of edges in the dynamic network. Span denotes the total number of snapshots in the dynamic network. Avg. #Edeges denotes the average number of edges per snapshot in the dynamic network. Avg. Degree denotes the avg. number of edges per node in a snapshot.
1,000k
# Edges (log scale)
DBLP
# Vtxs # Edges
100k 10k 1,000 100 10
2012
2009
2006
2003
2000
1997
1994
1991
Years
1988
1985
1982
1979
1976
1973
1970
1967
1964
1961
1958
1
Fig. 8. The edge distribution of the DBLP co-authorship network.
series data as a dynamic network. The CRMs discovered from these networks can be used to characterize the overall network, as shown in Section 7.2.3. 6.1.1. Co-Authorship Network (DBLP). This is a co-authorship network that models the yearly co-authorship relations from 1958 to 2012 based on the DBLP Computer Science Bibliography Data [Ley 2008]. The snapshots of the dynamic network that we created corresponds to the co-authorship network of each year, leading to a dynamic network consisting of 2012 − 1958 = 55 snapshots. The nodes model the authors of the publications from various conferences, journals, books, lecture series, etc. and the undirected edges between the authors model the collaboration between two scientists at a certain year. If an author A co-authors a publication with an author B in a given year, the edge (A, B) is added to that year’s co-authorship graph. Multiple publications by the same authors in a year are counted as a single relation. The edge distribution among the snapshots is skewed. In Figure 8, we show the edge distribution of the DBLP network. To determine co-authorship relations between authors with significant contribution, we removed authors who published less than 5 different years. We also removed all the relations of an author if he/she had coauthored with more than 50 other authors in a single year. To assign edge labels, we used the CLUTO software1 to cluster the publication titles into 50 groups. These title groups can be thought as the research areas or publication topics that the authors focused on their collaboration. 1 http://www.cs.umn.edu/∼cluto
ACM Transactions on Knowledge Discovery from Data, Vol. V, No. N, Article A, Publication date: YYYY.
Algorithms for Mining the Coevolving Relational Motifs in Dynamic Networks
A:17
Table II. Bioprocess Network Dataset Vertex label
Variable(s) Description
ASX BT CO2 DOX FRO O2X PHX ST WLC
Air sparge rate, Air sparge total Base totalized CO2 sparge rate, CO2 sparge total Dissolved oxygen controller output, Dissolved oxygen primary Flowrate overlay O2 sparge rate, O2 sparge total pH Controller output, pH Online Sparge total Weight load cell
The vertex labels of the 14 parameters used to construct the Bioprocess Network Dataset (GT ) dataset. The labels ASX, CO2, DOX, O2X, and PHX represent two parameters each.
6.1.2. Bioprocess Network (GT). This is a cell culture bioprocess data [Le et al. 2012] captured from the production bioreactors at Genentech’s manufacturing facility. This multivariate time-series data tracks the dynamics of various process parameters at every minute over 11 days period for a 247 production runs. In Table II, we show the parameters that are used to construct the GT network. Note that some of the related variables are assigned the same vertex label. To represent this data as a dynamic network, we computed correlation matrices for 14 of the process parameters using a sliding window of 12 hours interval with 50% overlap. This process resulted in 47 correlation matrices per production run. To construct a network snapshot based on a correlation matrix, we use each parameter as a vertex and two parameters/vertices are connected with an edge labeled as positive/negative if their correlation is above +0.9 or below −0.8 threshold. These threshold values are chosen to select equal number of positive and negative labeled edges. This way we construct 47 network snapshots where each snapshot contains a 3458 vertices (14 parameter * 247 runs) and the edges between them. 6.1.3. Store Transaction Network (Sales). This dynamic network is constructed using Dominicks Finer Foods store sales data collected from the James M. Kilts Center, University of Chicago Booth School of Business2 . The data captures weekly store-level sales from 93 stores collected over a period of more than seven years (400 weeks). We considered the sales data as multivariate time-series data for each store where 29 variables are the different categories of the product sold. In Table III, we show the different categories of the product considered in the Sales network. Note that some of the related variables are assigned the same vertex label. To represent this data as a dynamic network, we considered the total number of items sold per category in a week at a store and computed correlation matrices between 29 categories using a sliding window of 12 weeks interval with 50% overlap. This process resulted in 66 correlation matrices per store. To construct a network, we use each category as a vertex and two vertices are connected with an edge labeled as positive or negative if their correlation is above +0.85 or below −0.4 respectively. These threshold values are chosen to select equal number of positive and negative labeled edges. This way we construct 66 network snapshots where each snapshot contains a 2697 vertices (29 parameters * 93 stores) and the edges between them. 6.2. Metrics
In order to asses the scalability and performance of the algorithm, we collect two sets of results for the discovered CRMs. The first set of results is collected by running 2 http://research.chicagobooth.edu/kilts/marketing-databases/dominicks/dataset
ACM Transactions on Knowledge Discovery from Data, Vol. V, No. N, Article A, Publication date: YYYY.
A:18
R. Ahmed and G. Karypis Table III. Sales Dataset Vertex label
Variable(s) Description
ANA BER CEX CHE CIG CRX CSO DID DTX FEC FRX GRO JUX PTW SDR SPX TEX TNA TTI
Analgesics Beer Cereals, Oatmeal Cheeses Cigarettes Cookies, Crackers, Snack Crackers Canned Soup Dish Detergents Laundry Detergents, Fabric Softeners Front-end-candies Frozen Dinners, Entree, Juices Grooming Products Bottled Juices, Refrigerated Juices Paper Towels Soft Drinks Bath Soap, Soaps, Shampoos Toothbrushes, Toothpastes Canned Tuna Bathroom Tissues
The vertex labels of the 29 parameters used to construct the Sales dataset. The labels CRX, FRX, and SPX represent three parameters each. The labels CEX, DTX, JUX, and TEX represent two parameters each.
CRMminer, that does not perform any overlap based pruning during CRM enumeration. This process generates the complete set of CRMs (TCRM ) for the specified support threshold and then applies the overlap threshold to identify the valid CRMs (QCRM ) from the output space. The second set of results are collected by running CRMminerx , that applies the overlap threshold to prune the search space during enumeration. This process uses Equation (4) to perform the overlap threshold check for search space pruning to collect all CRMs (TCRM ) and then performs a final check using Equation (5) to select the valid CRMs (QCRM ). As discussed in Section 5.4.2, overlap based pruning does not guarantee complete set of results. Thus, the set of CRMs in TCRM and QCRM collected using the CRMminerx are subsets of TCRM and QCRM collected by using the CRMminer correspondingly. 7. RESULTS
The evaluation consists of two parts. The first focuses on assessing the performance of the algorithm that we developed for finding CRMs and to assess how the different parameters associated with the definition of CRMs impacts the performance. The second focuses on assessing the information that can be extracted from the discovered CRMs by analyzing some of the patterns of coevolving relational motifs that were identified in the three datasets. 7.1. Performance Results 7.1.1. Minimum Support & Overlap. Table IV and Figure 9 show the performance of the CRM mining algorithms and the size distribution of the discovered CRMs, respectively. These results are presented for different values of the minimum support and overlap thresholds. The following observations can be made from these results. First, the number of discovered CRMs increases as the minimum support decreases and/or the amount of overlap decreases. Both of which were expected. Moreover, as the minimum support and/or overlap decrease, the size of the discovered CRMs increases. Second, the amount of ACM Transactions on Knowledge Discovery from Data, Vol. V, No. N, Article A, Publication date: YYYY.
Algorithms for Mining the Coevolving Relational Motifs in Dynamic Networks
A:19
Table IV. Minimum Support (φ) & Overlap (β) study. Data
DBLP
GT
Sales
φ
β
#A
CRMminer
CRMminerx
#TCRM
#QCRM
Time
#TCRM
#QCRM
Time
100
0.70 0.60 0.50 0.40
9 ” ” ”
261 ” ” ”
84 84 261 261
27.00 ” ” ”
261 261 261 261
84 84 261 261
26.05 26.28 26.49 27.22
90
0.70 0.60 0.50 0.40
14 ” ” ”
548 ” ” ”
126 133 496 548
61.99 ” ” ”
496 496 548 548
126 133 496 548
49.09 47.48 62.06 54.09
80
0.70 0.60 0.50 0.40
16 ” ” ”
1,724 ” ” ”
203 225 1,044 1,492
2,298.84 ” ” ”
1,044 1,044 1,399 1,558
203 225 1,044 1,491
109.78 120.15 239.89 694.31
90
0.70 0.60 0.50 0.40
7 ” ” ”
6,255 ” ” ”
1,370 3,724 5,173 6,255
7.10 ” ” ”
4,553 4,730 6,027 6,255
1,370 3,410 5,173 6,255
5.92 5.92 7.04 7.18
80
0.70 0.60 0.50 0.40
7 ” ” ”
240,828 ” ” ”
145,633 205,674 231,222 240,828
200.44 ” ” ”
216,233 224,188 240,376 240,828
144,243 200,439 231,222 240,828
182.92 184.44 198.87 199.59
70
0.70 0.60 0.50 0.40
9 ” ” ”
973,116 ” ” ”
626,877 796,897 922,324 973,116
730.21 ” ” ”
804,228 871,176 958,742 973,116
611,206 778,893 919,640 973,116
611.04 685.46 712.06 714.63
45
0.70 0.60 0.50 0.40
65 ” ” ”
11,917 ” ” ”
134 134 1,472 10,480
18.70 ” ” ”
1,472 1,472 5,785 11,908
134 134 1,472 10,480
3.52 3.49 9.75 18.84
40
0.70 0.60 0.50 0.40
90 ” ” ”
183,437 ” ” ”
551 1,027 8,582 99,174
207.75 ” ” ”
7,422 7,741 37,109 156,320
551 1,027 8,582 99,174
14.03 14.39 52.46 182.53
35
0.70 0.60 0.50 0.40
109 ” ” ”
24,509,851 47,535 ” 552,297 ” 3,701,651 ” 13,780,709
11,904.75 ” ” ”
263,475 1,205,965 4,950,385 18,563,088
38,429 299.80 351,611 904.21 2,617,409 3,040.26 13,427,964 8,327.78
φ denotes the minimum support. #A denotes the number of discovered anchors. #TCRM denotes the total number of discovered CRMs. #QCRM denotes the number of CRMs that meet the β threshold out of #TCRM . Time denotes the amount of time spent in seconds expanding the anchors to discover QCRM . For all datasets, kmin is 4, kmax is 10, and mmin is 4.
time required by CRMminerx is lower than that required by CRMminer. Depending on the experiment, it is 1−40 times faster than CRMminer with an average speedup of 5.8. The performance gap is higher for large values of overlap and progressively shrinks as the overlap decreases. This is expected, as CRMminerx ’s overlap-based pruning becomes less effective for low overlap values. Third, the number of CRMs missed by the approximate nature of CRMminerx is either none or relatively small. This indicates that CRMminerx is a viable algorithm for CRM discovery as it is both faster and also quite effective in finding most valid CRMs. Finally, comparing how the two algorithms scale with the size of the output space (i.e., the number of valid discovered CRMs), we see that for most datasets, they eiACM Transactions on Knowledge Discovery from Data, Vol. V, No. N, Article A, Publication date: YYYY.
A:20
R. Ahmed and G. Karypis DBLP
100% 80%
φ90/β0.60 φ110/β0.60 φ90/β0.40 φ110/β0.40 φ90/β0.60 φ80/β0.60 φ90/β0.40 φ80/β0.40
GT
100% 80%
φ90/β0.70 φ90/β0.60 φ80/β0.70 φ80/β0.60
80%
60%
60%
60%
40%
40%
40%
20%
20%
20%
0%
0%
4
4 5
6 57 8 Number of Edges
9 6
10
4
5
6 7 8 Number of Edges
9
Sales
100%
0%
10
4
5
φ45/β0.50 φ45/β0.40 φ40/β0.50 φ40/β0.40
6 7 8 Number of Edges
9
10
Fig. 9. CRMs size distribution of different datasets for different minimum support and overlap
thresholds. For all datasets, kmin = 4, kmax = 10, and mmin = 4. Total time per level
10
1
1.00
2
3 4 5 6 7 Levels (Number of edges)
(a)
8
9
φ100 φ90 φ80
10 k
0.10 0.01 0.00
1
Embeddings per CRM 100 k
φ100 φ90 φ80 Count
100
Cost per Candidate
10.00
φ100 φ90 φ80
Runtime (Seconds)
Runtime (Seconds)
1000
1k 100 10 1
1
2
3 4 5 6 7 8 Levels (Number of edges)
(b)
9
1
2
3 4 5 6 7 Levels (Number of edges)
8
9
(c)
Fig. 10. CRM enumeration details at each level of the extension for the DBLP dataset. (a) Shows the total time spent at each level. (b) Shows the average time needed to generate a candidate CRM at each expansion level. The cost is calculated as the sum of the average time to locate a frequent edge, the average time to perform minimum DFS code check, and the average time to locate the embeddings of the candidate CRM. (c) shows the average number of embeddings maintained by each CRM at each level. The results in the Y-axis are in log scale. For all experiments, β = 0.60 and mmin = 4.
ther scale linearly or better than linearly. The only exception is the DBLP run of CRMminer for φ = 80. For this experiment, CRMminer took 37 times more time than the φ = 90 experiment and depending on the specific overlap value, it only discovered 1.6−2.7 times more CRMs. To better understand CRMminer’s behavior for this dataset, Figure 10 shows various statistics about the amount of time required by the different phases of the algorithm and the number of embeddings of the discovered CRMs. From these results we can see that the reason for the dramatic increase in runtime is due to the fact that for φ = 80 DBLP contains a large number of candidate CRMs that contain many edges (Figure 10(a)) and also have a large number of embeddings (Figure 10(c)). As a result, CRMminer spends most of its time processing these large embedding lists, leading to its substantial increase in runtime. However, most of these candidate CRMs fail to meet the overlap constraint and this is the reason that CRMminerx performs better and scales better. Understanding the missing CRMs. The results presented in Table IV show that CRMminerx is able to find almost all the valid CRMs for the DBLP and the Sales datasets in less time than CRMminer. For the GT dataset, even though the runtime decreased significantly, only a subset of the valid CRMs were found by CRMminerx . As we have seen in the size distribution characteristic of the CRMs of the GT dataset presented in Figure 9, the CRMminerx fails to discover all CRMs, since the CRMs that become valid at later stage will get eliminated by the overlap threshold based pruning. The lack of anti-monotonicity property for the overlap threshold based prunACM Transactions on Knowledge Discovery from Data, Vol. V, No. N, Article A, Publication date: YYYY.
Algorithms for Mining the Coevolving Relational Motifs in Dynamic Networks Found Missing
Similarity Distribution: φ70/β60
41%
32%
CRM Distribution
CRM Distribution
Similarity Distribution: φ80/β60 10% 9% 8% 7% 6% 5% 4% 3% 2% 1% 0%
0.29
0.33
0.4
0.43 0.5 0.6 0.67 0.75 Inter-motif node similarity
0.8
A:21
10% 9% 8% 7% 6% 5% 4% 3% 2% 1% 0%
1
21%
15%
Found Missing
35%
0.25 0.29 0.33 0.38 0.4 0.43 0.5 0.57 0.6 0.67 0.75 0.8 Inter-motif node similarity
1
Fig. 11. CRMs distribution based on the minimum inter-motif similarity using the GT dataset.
ing strategy eliminated a large number of potential CRMs at the early stages of the enumeration process. To understand the characteristics of the missing CRMs, we calculated the minimum inter-motif similarity of all CRMs based on the following equation: min
ψ(c) =
1