A Comparative Study of RNN for Outlier Detection in Data Mining Graham Williams, Rohan Baxter, Hongxing He, Simon Hawkins and Lifang Gu
[email protected] http://datamining.csiro.au Enterprise Data Mining CSIRO Mathematical and Information Sciences GPO Box 664, Canberra, ACT 2601 Australia Abstract We have proposed replicator neural networks (RNNs) as an outlier detecting algorithm [15]. Here we compare RNN for outlier detection with three other methods using both publicly available statistical datasets (generally small) and data mining datasets (generally much larger and generally real data). The smaller datasets provide insights into the relative strengths and weaknesses of RNNs against the compared methods. The larger datasets particularly test scalability and practicality of application. This paper also develops a methodology for comparing outlier detectors and provides performance benchmarks against which new outlier detection methods can be assessed. Keywords: replicator neural network, outlier detection, empirical comparison, clustering, mixture modelling.
1
Introduction
The detection of outliers has regained considerable interest in data mining with the realisation that outliers can be the key discovery to be made from very large databases [10, 9, 29]. Indeed, for many applications the discovery of outliers leads to more interesting and useful results than the discovery of inliers. The classic example is fraud detection where outliers are more likely to represent cases of fraud. Outliers can often be individuals or groups of clients exhibiting behaviour outside the range of what is considered ‘normal.’ Also, in customer relationship management (CRM) and many other consumer databases outliers can often be the most profitable group of customers. In addition to the specific data mining activities that benefit from outlier detection the crucial task of data cleaning where aberrant data points need to be identified and dealt with appropriately can also benefit. For example, outliers can be removed (where appropriate) or considered separately in regression 1
modelling to improve accuracy. Detected outliers are candidates for aberrant data that may otherwise adversely affect modelling. Identifying them prior to modelling and analysis is important. Studies from statistics have typically considered outliers to be residuals or deviations from a regression or density model of the data: An outlier is an observation that deviates so much from other observations as to arouse suspicions that it was generated by a different mechanism [13]. We are not aware of previous empirical comparisons of outlier detection methods incorporating both statistical and data mining methods and datasets in the literature. The statistical outlier detection literature, on the other hand, contains many empirical comparisons between alternative methods. Progress is made when publicly available performance benchmarks exist against which new outlier detection methods can be assessed. This has been the case with classifiers in machine learning where benchmark datasets [4] and a standardised comparison methodology [11] allowed the significance of classifier innovation to be properly assessed. In this paper we focus on establishing the context of our recently proposed replicator neural network (RNN) approach for outlier detection [15]. This approach employs multi-layer perceptron neural networks with three hidden layers and the same number of output neurons and input neurons to model the data. The neural network input variables are also the output variables so that the RNN forms an implicit, compressed model of the data during training. A measure of outlyingness of individuals is then developed as the reconstruction error of individual data points. For comparison two parametric (from the statistical literature) methods and one non-parametric outlier detection method (from the data mining literature) are used. The RNN method is a non-parametric method. A priori we expect that parametric and non-parametric methods to perform differently on the test datasets. For example, a datum may not lie far from a very complex model (e.g., a clustering model with many clusters), while it may lie far from a simple model (e.g., a single hyper-ellipsoid cluster model). This leads to the concept of local outliers in the data mining literature [17]. The parametric approach is designed for datasets with a dominating relatively dense convex bulk of data. The empirical comparisons we present here show that RNNs perform adequately in many different situations and particularly well on large datasets. However, we also demonstrate that the parametric approach is still competitive for large datasets. Another important contribution of this paper is the linkage made between data mining outlier detection methods and statistical outlier detection methods. This linkage and understanding will allow appropriate methods from each to be used where they best suit datasets exhibiting particular characteristics. This understanding also avoids the duplication of already existing methods. Knorr et al.’s data mining method for outlier detection [21] borrows the Donoho-Stahel estimator from the statistical literature but otherwise we are unaware of other specific linkages between each field. The linkages arise in three ways: (1) methods (2) datasets and (3) evaluation methodology. Despite claims to the contrary in the data mining literature [17] some existing statistical outlier detection methods scale well for large datasets, as we demonstrate in Section 5. 2
In section 2 we review the RNN outlier detector and then briefly summarise the outlier detectors used for comparison in Section 3. In Section 4 we describe the datasets and experimental design for performing the comparisons. Results from the comparison of RNN to the other three methods are reported in Section 5. Section 6 summarises the results and the contribution of this paper.
2
RNNs for Outlier Detection
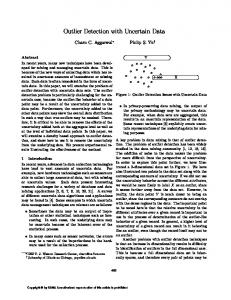
Replicator neural networks have been used in image and speech processing for their data compression capabilities [6, 16]. We propose using RNNs for outlier detection [15]. An RNN is a variation on the usual regression model where, instead of the input vectors being mapped to the desired output vectors, the input vectors are also used as the output vectors. Thus, the RNN attempts to reproduce the input patterns in the output. During training RNN weights are adjusted to minimise the mean square error for all training patterns so that common patterns are more likely to be well reproduced by the trained RNN. Consequently those patterns representing outliers are less well reproduced by the trained RNN and have a higher reconstruction error. The reconstruction error is used as the measure of outlyingness of a datum. The proposed RNN is a feed-forward multi-layer perceptron with three hidden layers sandwiched between the input and output layers which have n units each, corresponding to the n features of the training data. The number of units in the three hidden layers are chosen experimentally to minimise the average reconstruction error across all training patterns. Figure 1(a), presents a schematic view of the fully connected replicator neural network.
Input
Target
V
1
V
V
V
1
V 3
V i
. . .
. . .
. . .
. . .
V
V
n
n
Layer
S3 (θ )
2
2
1
2
3
4
θ
5
(a) A schematic view of a fully connected replicator neural network.
(b) A representation of the activation function for units in the middle hidden layer of the RNN. N is 4 and a3 is 100.
Figure 1: Replicator neural network characteristics [15]. A particular innovation is the activation function used for the middle hidden layer [15]. Instead of the usual sigmoid activation function for this layer (layer 3) a staircase-like function with parameters N (number of steps or activation levels) and a3 (transition rate from one level to the next) are employed. As a3 increases the function approaches a true step function, as in Figure 1(b). 3
This activation function has the effect of dividing continuously distributed data points into a number of discrete valued vectors, providing the data compression that RNNs are known for. For outlier detection the mapping to discrete categories naturally places the data points into a number of clusters. For scalability the RNN is trained with a smaller training set and then applied to all of the data to evaluate their outlyingness. For outlier detection we define the Outlier Factor of the ith data record OFi as the average reconstruction error over all features (variables). This is calculated for all data records using the trained RNN to score each data point.
3
Comparison of Outlier Detectors
Selection of the other outlier detection methods used in this paper for comparison is based on the availability of implementations and our intent to sample from distinctive approaches. The three chosen methods are: the Donoho-Stahel estimator [21]; Hadi94 [12]; and MML clustering [25]. Of course, there are many data mining outlier detection methods not included here [22, 18, 20, 19] and also many omitted statistical outlier methods [26, 1, 23, 3, 7]. Many of these methods (not included here) are related to the three included methods and RNNs, often being adapted from clustering methods in one way or another and a full appraisal of this is worth a separate paper. The Donoho-Stahel outlier detection method uses the outlyingness measure computed by the Donoho-Stahel estimator, which is a robust multivariate estimator of location and scatter [21]. It can be characterised as an ‘outlyingnessweighted’ estimate of mean and covariance, which downweights any point that is many robust standard deviations away from the sample in some univariate projection. Hadi94 [12] is a parametric bulk outlier detection method for multivariate data. The method starts with g0 = k + 1 ‘good’ records, where k is the number of dimensions. The good set is increased one point at a time and the k + 1 ‘good’ records are selected using a robust estimation method. The mean and covariance matrix of the ‘good records’ are calculated. The Mahalanobis distance is computed for all the data and the gn = gn−1 + 1 closest data are selected as the ‘good records’. This is repeated until the ‘good’ records contain more than half the dataset, or the Mahalanobis distance of the remaining records is higher than a predefined cut-off value. For the data mining outlier detector we use the mixture-model clustering algorithm where models are scored using MML inductive inference [25]. The cost of transmitting each datum according to the best mixture model is measured in nits (1.6bits = 1 nit). We rank the data in order of highest message length cost to lowest message length cost. The high cost data are ‘surprising’ according to the model and so are considered as outliers by this method.
4
4
Experimental Design
We now describe and characterise the test datasets used for our comparison. Each outlier detection method has a bias toward its own implicit or explicit model of outlier determination. A variety of datasets are needed to explore the differing bias of the methods and to begin to develop an understanding of the appropriateness of each method for particular characteristics of data sets. The statistical outlier detection literature has considered three qualitative types of outliers. Cluster outliers occur in small low variance clusters. The ‘low variance’ is relative to the variance of the bulk of the data. Radial outliers occur in a plane out from the major axis of the bulk of the data. If the bulk of data occurs in an elongated ellipse then radial outliers will lie on the major axis of that ellipse but separated from and less densely packed than the bulk of data. Scattered outliers occur randomly scattered about the bulk of data. The datasets contain different combinations of outliers from these three outlier categories. We refer to the proportion of outliers in a data set as the contamination level of the data set and look for datasets that exhibit different proportions of outliers. The statistical literature typically considers contamination levels of up to 40% whereas the data mining literature typically considers contamination levels of at least an order of magnitude less (< 4%). The lower contamination levels are typical of the types of outliers we expect to identify in data mining, where, for example, fraudulent behaviour is often very rare (and even as low as 1% or less). Identifying 40% of a very large dataset as outliers is unlikely to provide useful insights into these rare, yet very significant, groups. The datasets from the statistical literature used in this paper are listed in Table 1. A description of the original source of the datasets and the datasets themselves are found in [27]. These datasets are used throughout the statistical outlier detection literature. The data mining datasets used are listed in Table 2. Dimensions k 4
Outliers
%
n k
HBK
Records n 75
14
21
19
Wood
20
6
4
20
3
Milk
85
8
17
20
11
Hertzsprung
47
2
7
15
24
Stackloss
21
4
4
19
5
Dataset
Outlier Description Small cluster with some scattered. Radial (on axis) and in a small cluster. Radial with some scattered off the main axis. Some scattered and some in a cluster. Scattered.
Table 1: Statistical outlier detection test datasets [27]. We can observe that outliers from the statistical datasets arise from measurement errors or data-entry errors, while the outliers in the selected data mining datasets are semantically distinct categories. Thus, for example, the breast cancer data has non-malignant and malignant measurements and the malignant measurements are viewed as outliers. The intrusion dataset identifies successful Internet intrusions. Intrusions are identified as exploiting one of the possible vulnerabilities, such as http and ftp. Successful intrusions are considered outliers in these datasets. It would have been preferable to include more data mining datasets for assessing outlier detection. The KDD intrusion dataset is included because it is publicly available and has been used previously in the data mining literature [31, 5
Records n 683 567497 95156
Dimensions k 9 3 3
Outliers
%
n k
239 2211 30
35 0.4 0.03
76 200K 30K
ftp-data
30464
3
722
2
10K
other
5858
3
98
2
2K
ftp
4091
3
316
8
1K
Dataset Breast Cancer http smtp
Outlier Description Scattered. Small separate cluster. Scattered and outlying but also some between two elongated different sized clusters. Outlying cluster and some scattered. Two clusters, both overlapping with nonintrusion data. Scattered outlying and a cluster.
Table 2: Data mining outlier detection test datasets [2]. The top 5 are intrusion detection from web log data set as described in [31]. 30]. Knorr et al. [21] use NHL player statistics but refer only to a web site publishing these statistics, not the actual dataset used. Most other data mining papers use simulation studies rather than real world datasets. We are currently evaluating ForestCover and SatImage datasets from the KDD repository [2] for later inclusion into our comparisons.1 We provide a visualisation of these datasets in Section 5 using the visualisation tool xgobi [28]. It is important to note that we subjectively select projections for this paper to highlight the outlier records. From our experiences we observe that for some datasets most random projections show the outlier records distinct from the bulk of the data, while for other (typically higher dimensional) datasets, we explore many projections before finding one that highlights the outliers.
5
Experimental Results
We discuss here results from a selection of the test datasets we have employed to evaluate the performance of the RNN approach to outlier detection. We begin with the smaller statistical datasets to illustrate RNN’s apparent abilities and limitations on traditional statistical outlier datasets. We then demonstrate RNN on two data mining datasets, the first being the smaller breast cancer dataset and the second collection being the very much larger network intrusion dataset. On this latter dataset we see RNN performing quite well.
5.1
HBK
The HBK dataset is an artificially constructed dataset [14] with 14 outliers. Regression approaches to outlier detection tend to find only the first 10 as outliers. Data points 1-10 are “bad leverage” points—they lie far away from the centre of the good points and from the regression plane. Data points 11-14 are good leverage points—although they lie far away from the bulk of the data they still lie close to the regression plane. 1 We are also collecting data sets for outlier detection and making them available at http: //datamining.csiro.au/outliers.
6
Figure 2 provides a visualisation of the outliers for the HBK dataset. The outlier records are well-separated from the bulk of the data and so we may expect the outlier detection methods to easily distinguish the outliers. 1 3 6
2 4 5 7
9
8 10
11 14
13 12 Var 5 Var 3
Var 2 Var 4
Var 1
Figure 2: Visualisation of the HBK dataset using xgobi. The 14 outliers are quite distinct (note that in this visualisation data points 4, 5, and 7 overlap). Donoho-Stahel Datum MahalIndex anobis Dist. 14 1734 4 1640 3 1637 5 1637 9 1586 7 1582 10 1550 6 1500 2 1498 8 1489 12 1466 13 1406 1 1403 11 1370 53 14 47 10 68 8 75 7 43 7 70 6
Hadi94 Datum MahalIndex anobis Dist. 14 1407 4 1281 5 1278 3 1276 9 1236 7 1235 12 1202 10 1201 6 1175 2 1166 8 1158 13 1150 11 1122 1 1096 53 8 47 6 68 5 43 5 34 4 60 4
MML Clustering Datum Message Clust. Index Length Memb. (nits) 12 19.6 1 14 19.0 1 13 18.9 1 11 17.7 1 4 17.0 3 53 16.5 2 7 16.4 3 47 16.4 2 68 16.0 2 62 15.8 2 60 15.8 2 34 15.8 2 43 15.7 2 27 15.7 2 49 15.6 2 16 15.6 2 1 15.5 3 38 15.5 2 20 15.5 2 61 15.4 2
Datum Index
RNN Outlier Factor
Clust. Memb.
14 12 13 11 7 6 8 3 1 2 10 5 16 49 4 9 20 51 21 31
0.23432 0.20816 0.18869 0.17998 0.13110 0.12417 0.12076 0.11833 0.11612 0.10500 0.10167 0.09918 0.08828 0.08620 0.08317 0.08293 0.08079 0.07533 0.07484 0.07397
1 1 1 1 1 1 1 1 1 1 1 1 3 3 1 1 3 3 3 3
Table 3: Top 20 outliers for Donoho-Stahel, Hadi94, MML Clustering and RNN on the HBK dataset. ‘True’ outliers are in bold. There are 14 outliers indexed 1..14. The results from the outlier detection methods for the HBK dataset are summarised in Table 3. Donoho-Stahel and Hadi94 rank the 14 outliers in the top 14 places and the distance measures dramatically distinguish the outliers from the remainder of the records. MML clustering does less well. It identifies the scattered outliers but the outlier records occurring in a compact cluster are not ranked as outliers. This is because their compact occurrence leads to a small description length. RNN has the 14 outliers in the top 16 places and has placed all the true outliers in a single cluster.
5.2
Wood Data
The Wood dataset consists of 20 observations [8] with data points 4, 6, 8, and 19 being outliers [27]. The outliers are said not to be easily identifiable by 7
observation [27], although our xgobi exploration identifies them. Figure 3 is a visualisation of the outliers for the Wood dataset. 19
4 6
8
Var 5
Var 6 Var 4
Var 2
Var 3 Var 1
Figure 3: Visualisation of Wood dataset using xgobi. The outlier records are labelled 4, 6, 8 and 19. Donoho-Stahel Datum MahalIndex anobis Dist. 19 1936 6 1466 8 1464 4 1126 11 58 7 50 16 42 5 7 12 7 14 7 10 7 9 6 1 6 3 6 18 6 17 5 20 4 15 4 13 4 2 2
Hadi94 Datum MahalIndex anobis Dist. 7 2.0 11 0.9 16 0.7 9 0.7 12 0.6 10 0.6 19 0.4 17 0.4 18 0.4 3 0.4 20 0.4 1 0.4 13 0.3 8 0.3 5 0.3 6 0.3 14 0.3 4 0.3 15 0.2 2 0.1
MML Clustering Datum Message Clust. Index Length Memb. (nits) 10 47.5 1 12 46.9 1 20 46.7 1 11 46.1 1 7 46.0 1 13 46.0 1 1 45.7 1 9 45.6 1 17 45.5 1 18 45.3 1 3 44.9 1 16 44.9 1 2 44.7 1 14 44.6 1 5 44.5 1 15 44.4 1 4 40.0 2 19 38.7 2 8 38.1 2 6 37.2 2
RNN Clustering Datum Outlier Clust. Index Factor Memb. 13 10 6 9 20 12 19 7 4 18 16 11 1 5 15 17 14 2 8 3
0.30676 0.18307 0.14933 0.14332 0.14274 0.13029 0.12641 0.11887 0.11841 0.11706 0.11491 0.08777 0.07806 0.07366 0.07244 0.06625 0.05840 0.05223 0.05161 0.04257
0 0 1 16 0 0 2 1 1 0 0 0 0 0 0 0 0 0 3 0
Table 4: Top 20 outliers for Donoho-Stahel, Hadi94, MML Clustering and RNN on the Wood dataset. ‘True’ outliers are in bold. The 4 true outliers are 4, 6, 8, 19. The results from the outlier detection methods for the Wood dataset are summarised in Table 4. Donoho-Stahel clearly identifies the four outlier records, while Hadi94, RNN and MML all struggle to identify them. The difference between Donoho-Stahel and Hadi94 is interesting and can be explained by their different estimates of scatter (or covariance). Donoho-Stahel’s estimate of covariance is more compact (leading to a smaller ellipsoid around the estimated data centre). This result empirically suggests Donoho-Stahel’s improved robustness with high dimensional datasets relative to Hadi94. MML clustering has considerable difficulty in identifying the outliers according to description length and it ranks the true outliers last! The cluster membership column allows an interpretation of what has happened. MML clustering puts the outlier records in their own low variance cluster and so the records are described easily at low information cost. Identifying outliers by rank using data description length with MML clustering does not work for low variance cluster outliers. 8
For RNN, the cluster membership column again allows an interpretation of what has happened. Most of the data belong to cluster 0, while the outliers belong to various other clusters. Similarly to MML clustering, the outliers can, however, be identified by interpreting the clusters.
5.3
Wisconsin Breast Cancer Dataset
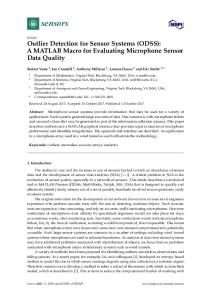
The Wisconsin breast cancer dataset was obtained from the University of Wisconsin Hospitals, Madison from Dr. William H. Wolberg [24]. It contains 683 records of which 239 are being treated as outliers. Our initial exploration of this dataset found that all the methods except Donoho-Stahel have little difficulty identifying the outliers. So we sampled the original dataset to generate datasets with differing contamination levels (number of malignant observations) ranging from 8.07% to 35% to investigate the performance of the methods with differing contamination levels. Figure 4 is a visualisation of the outliers for this dataset.
Var 10 Var Var 6 7
Var 5
Var 8 Var 9 Var 2
Figure 4: Visualisation of Breast Cancer dataset using xgobi. Malignant data are shown as grey crosses. Figure 5 shows the coverage of outliers by the Hadi94 method versus percentage observations for various level of contamination. The performance of Hadi94 degrades as the level of contamination increases, as one would expect. The results for the MML clustering method and the RNN method track the Hadi94 method closely and are not shown here. The Donoho-Stahel method does not do any better than a random ranking of the outlyingness of the data. Investigating further we find that the robust estimate of location and scatter is quite different to that of Hadi94 and obviously less successful.
5.4
Network Intrusion Detection
The network intrusion dataset comes from the 1999 KDD Cup network intrusion detection competition [5]. The dataset records contain information about a 9
100 80 60 40
% of observations covered
0
20
malignant = 35% malignant = 21.1% malignant = 15.08% malignant = 11.71% malignant = 9.55% malignant = 8.07% av. over all
0
20
40
60
80
100
Top % of observations
Figure 5: Hadi94 outlier performance as outlier contamination varies network connection, including bytes transfered and type of connection. Each event in the original dataset of nearly 5 million events is labelled as an intrusion or not an intrusion. We follow the experimental technique employed in [31, 30] to construct suitable datasets for outlier detection and to rank all data points with an outlier measure. We select four of the 41 original attributes (service, duration, src bytes, dst bytes). These attributes are thought to be the most important features [31]. Service is a categorical feature while the other three are continuous features. The original dataset contained 4,898,431 data records, including 3,925,651 attacks (80.1%). This high rate is too large for attacks to be considered outliers. Therefore, following [31], we produced a subset consisting of 703,066 data records including 3,377 attacks (0.48%). The subset consists of those records having a positive value for the logged in variable in the original dataset. The dataset was then divided into five subsets according to the five values of the service variable (other, http, smtp, ftp, and ftp-data). The aim is to then identify intrusions within each of the categories by identifying outliers. The visualisation of the datasets is presented in Figure 6. For the other dataset (Figure 6(a)) half the attacks are occurring in a distinct outlying cluster, while the other half are embedded among normal events. For the http dataset intrusions occur in a small cluster separated from the bulk of the data. For the smtp, ftp, and ftp-data datasets most intrusions also appear quite separated from the bulk of the data, in the views we generated using xgobi. Figure 7 summarises the results for the four methods on the five datasets. For the other dataset RNN finds the first 40 outliers long before any of the other methods. All the methods need to see more than 60% of the observations before including 80 of the total (98) outliers in their rankings. This suggests there is low separation between the bulk of the data and the outliers, as corroborated by Figure 6(a). For the http dataset the performance of Donoho-Stahel, Hadi94 and RNN cannot be distinguished. MML clustering needs to see an extra 10% of the data before including all the intrusions.
10
Var 4
Var 3
Var 4
Var 2
Var 2 Var 3
(a) other
(b) http
Var 2
Var 3 Var 3
Var 4
Var 4
Var 2
(c) smtp
(d) ftp
Var 3
Var 4
Var 2
(e) ftp-data
Figure 6: Visualisation of the KDD cup network intrusion datasets using xgobi.
11
20
0
20
40
Dono-Stahel Hadi94 MML RNN
0
80
20
100
40
60
60
(e) ftp-data
40
Dono-Stahel Hadi94 MML RNN
(d) ftp
20
100
Top % of observations
0
80
% of intrusion observations covered
Top % of observations
60
(b) http
100
(a) other
80
% of intrusion observations covered
Top % of observations
60
% of intrusion observations covered
% of intrusion observations covered
100
80
60
40
20
0
100 80 60 40 20 0
Top % of observations
40
Dono-Stahel Hadi94 MML RNN
% of intrusion observations covered
100 80 60 40 20 0 0
80
20
100
60
(c) smtp
Top % of observations
40
Dono-Stahel Hadi94 MML RNN
80
100
Figure 7: Percentage of intrusions detected plotted against the percentage of data ranked according to the outlier measure for the five KDD intrusion datasets.
0
Dono-Stahel Hadi94 MML RNN
100
80
60
40
20
0
100 80 60 40 20 0
12
For the smtp dataset the performances of Donoho-Stahel, Hadi94 and MML trend very similarly while RNN needs to see nearly all of the data to identify the last 40% of the intrusions. For the ftp dataset the performances of Donoho-Stahel and Hadi94 trend very similarly. RNN needs to see ≈ 20% more of the data to identify most of the intrusions. MML clustering does not do much better than random in ranking the intrusions above normal events. Only some intrusions are scattered, while the remainder lie in clusters of a similar shape to the normal events. Finally, for the ftp-data dataset Donoho-Stahel performs the best. RNN needs to see 20% more of the data. Hadi94 needs to see another 20% more. The MML curve is below the y = x curve (which would arise if a method randomly ranked the outlyingness of the data), indicating that the intrusions have been placed in low variance clusters requiring small description lengths.
6
Discussion and Conclusion
The main contributions of this paper are: • Empirical evaluation of the RNN approach for outlier detection; • Understanding and categorising some publicly available benchmark datasets for testing outlier detection algorithms. • Comparing the performance of three different outlier detection methods from the statistical and data mining literatures with RNN. • Using outlier categories: cluster, radial and scattered and contamination levels to characterise the difficulty of the outlier detection task for large data mining datasets (as well as the usual statistical test datasets). We conclude that the statistical outlier detection method, Hadi94, scales well and performs well on large and complex datasets. The Donoho-Stahel method matches the performance of the Hadi94 method in general except for the breast cancer dataset. Since this dataset is relatively large in size (n = 664) and dimension (k = 9), this suggests that the Donoho-Stahel method does not handle this combination of large n and large k well. We plan to investigate whether the Donoho-Stahel method’s performance can be improved by using different heuristics for the number of sub-samples used by the sub-sampling algorithm (described in Section 2). The MML clustering method works well for scattered outliers. For cluster outliers, the user needs to look for small population clusters and then treat them as outliers, rather than just use the ranked description length method (as was used here). The RNN method performed satisfactorily for both small and large datasets. It was of interest that it performed well on the small datasets at all since neural network methods often have difficulty with such smaller datasets. Its performance appears to degrade with datasets containing radial outliers and so it is not recommended for this type of dataset. RNN performed the best overall on the KDD intrusion dataset. In summary, outlier detection is, like clustering, an unsupervised classification problem where simple performance criteria based on accuracy, precision or 13
recall do not easily apply. In this paper we have presented our new RNN outlier detection method, datasets on which to benchmark it against other methods, and results which can form the basis of ranking each method’s effectiveness in identifying outliers. This paper begins to characterise datasets and the types of outlier detectors that work well on those datasets. We have begun to identify a collection of benchmark datasets for use in comparing outlier detectors. Further effort is required in order to better formalise the objective comparison of the outputs of outlier detectors. In this paper we have given an indication of such an objective measure where an outlier detector is assessed as identifying, for example, 100% of the known outliers in the top 10% of the rankings supplied by the outlier detector. Such objective measures need to be developed and assessed for their usefulness in comparing outlier detectors.
References [1] A. C. Atkinson. Fast very robust methods for the detection of multiple outliers. Journal of the American Statistical Association, 89:1329–1339, 1994. [2] S. D. Bay. The UCI KDD repository, 1999. http://kdd.ics.uci.edu. [3] N. Billor, A. S. Hadi, and P. F. Velleman. BACON: Blocked adaptive computationally-efficient outlier nominators. Computational Statist & Data Analysis, 34:279–298, 2000. [4] C. L. Blake and C. J. Merz. UCI repository of machine learning databases, 1998. [5] 1999 KDD Cup competition. kddcup99/kddcup99.html.
http://kdd.ics.uci.edu/databases/
[6] G. E. Hinton D. H. Ackley and T. J. Sejinowski. A learning algorithm for boltzmann machines. Cognit. Sci., 9:147–169, 1985. [7] P. deBoer and V. Feltkamp. Robust multivariate outlier detection. Technical Report 2, Statistics Netherlands, Dept. of Statistical Methods, 2000. http://neon.vb.cbs.nl/rsm/P_su2000.htm. [8] N. R. Draper and H. Smith. Applied Regression Analysis. John Wiley and Sons, New York, 1966. [9] W. DuMouchel and M. Schonlau. A fast computer intrusion detection algorithm based on hypothesis testing of command transition probabilities. In Proceedings of the 4th International Conference on Knowledge Discovery and Data Mining (KDD98), pages 189–193, 1998. [10] T. Fawcett and F. Provost. Adaptive fraud detection. Data Mining and Knowledge Discovery, 1(3):291–316, 1997. [11] C. Feng, A. Sutherland, R. King, S. Muggleton, and R. Henery. Comparison of machine learning classifiers to statistics and neural networks. In Proceedings of the International Conference on AI & Statistics, 1993.
14
[12] A.S. Hadi. A modification of a method for the detection of outliers in multivariate samples. Journal of the Royal Statistical Society, B, 56(2), 1994. [13] D. M. Hawkins. Identification of outliers. Chapman and Hall, London, 1980. [14] D. M. Hawkins, D. Bradu, and G. V. Kass. Location of several outliers in multiple regression data using elemental sets. Technometrics, 26:197–208, 1984. [15] S. Hawkins, H. X. He, G. J. Williams, and R. A. Baxter. Outlier detection using replicator neural networks. In Proceedings of the Fifth International Conference and Data Warehousing and Knowledge Discovery (DaWaK02), 2002. [16] R. Hecht-Nielsen. Replicator neural networks for universal optimal source coding. Science, 269(1860-1863), 1995. [17] W. Jin, A. Tung, and J. Han. Mining top-n local outliers in large databases. In Proceedings of the 7th International Conference on Knowledge Discovery and Data Mining (KDD01), 2001. [18] E. Knorr and R. Ng. A unified approach for mining outliers. In Proc. KDD, pages 219–222, 1997. [19] E. Knorr and R. Ng. Algorithms for mining distance-based outliers in large datasets. In Proceedings of the 24th International Conference on Very Large Databases (VLDB98), pages 392–403, 1998. [20] E. Knorr, R. Ng, and V. Tucakov. Distance-based outliers: Algorithms and applications. Very Large Data Bases, 8(3–4):237–253, 2000. [21] E. M. Knorr, R. T. Ng, and R. H. Zamar. Robust space transformations for distance-based operations. In Proceedings of the 7th International Conference on Knowledge Discovery and Data Mining (KDD01), pages 126–135, 2001. [22] G. Kollios, D. Gunopoulos, N. Koudas, and S. Berchtold. An efficient approximation scheme for data mining tasks. In Proceedings of the International Conference on Data Engineering (ICDE01), 2001. [23] A. S. Kosinksi. A procedure for the detection of multivariate outliers. Computational Statistics & Data Analysis, 29, 1999. [24] O. L. Mangasarian and W. H. Wolberg. Cancer diagnosis via linear programming. SIAM News, 23(5):1–18, 1990. [25] J. J. Oliver, R. A. Baxter, and C. S. Wallace. Unsupervised Learning using MML. In Proceedings of the Thirteenth International Conference (ICML 96), pages 364–372. Morgan Kaufmann Publishers, San Francisco, CA, 1996. Available from http://www.act.cmis.csiro.au/rohanb/. [26] D. E. Rocke and D. L. Woodruff. Identification of outliers in multivariate data. Journal of the American Statistical Association, 91:1047–1061, 1996. 15
[27] P. J. Rousseeuw and A. M. Leroy. Robust Regression and Outlier Detection. John Wiley & Sons, Inc., New York, 1987. [28] D. F. Swayne, D. Cook, and A. Buja. XGobi: interactive dynamic graphics in the X window system with a link to S. In Proceedings of the ASA Section on Statistical Graphics, pages 1–8, Alexandria, VA, 1991. American Statistical Association. [29] G. J. Williams and Z. Huang. Mining the knowledge mine: The hot spots methodology for mining large real world databases. In Abdul Sattar, editor, Advanced Topics in Artificial Intelligence, volume 1342 of Lecture Notes in Artificial Intelligenvce, pages 340–348. Springer, 1997. [30] K. Yamanishi and J. Takeuchi. Discovering outlier filtering rules from unlabeled data. In Proceedings of the 7th International Conference on Knowledge Discovery and Data Mining (KDD01), pages 389–393, 2001. [31] K. Yamanishi, J. Takeuchi, G. J. Williams, and P. W. Milne. On-line unsupervised outlier detection using finite mixtures with discounting learning algorithm. In Proceedings of the 6th International Conference on Knowledge Discovery and Data Mining (KDD00), pages 320–324, 2000.
16