124
Int. J. Quality Engineering and Technology, Vol. 3, No. 2, 2012
A double neural network approach for the identification and parameter estimation of control chart patterns Ahmed Shaban* Industrial Engineering Department, Faculty of Engineering, Fayoum University, Fayoum 63514, Egypt E-mail:
[email protected] *Corresponding author
Mohamed A. Shalaby Mechanical Design and Production Department, Faculty of Engineering, Cairo University, Giza 12613, Egypt E-mail:
[email protected] Abstract: The exhibited pattern on a control chart is classified as either natural or unnatural pattern. The presence of an unnatural pattern is evidence that a process is out of control. This paper devises neural networks as an intelligent tool to automate the identification of the different control chart patterns, and to accurately estimate their parameters. Two neural networks, named ‘NN-1’ and ‘NN-2’, are integrated together to perform the identification and the parameter estimation. The first stage ‘NN-1’ is developed to identify the existing pattern in the control data, and the second stage ‘NN-2’ is used to estimate the parameters of that pattern. NN-1 is developed to identify the five basic control chart patterns; namely: natural, upward shift, downward shift, upward trend, and downward trend. The probability of success in identifying the correct control charts pattern and its parameters is used to evaluate the performance of both NN-1and NN-2. Performance results of NN-1 and NN-2 are compared with other previous leading research work. Comparisons show that the proposed neural network approach yield better probability of success than the others. Keywords: quality control; control chart patterns; natural pattern; unnatural patterns; upward shift; downward shift; upward trend; downward trend; pattern identification; parameter estimation; probability of success; neural networks. Reference to this paper should be made as follows: Shaban, A. and Shalaby, M.A. (2012) ‘A double neural network approach for the identification and parameter estimation of control chart patterns’, Int. J. Quality Engineering and Technology, Vol. 3, No. 2, pp.124–138.
Copyright © 2012 Inderscience Enterprises Ltd.
A double neural network approach
125
Biographical notes: Ahmed Shaban is an Assistant Lecturer in Industrial Engineering Department, Faculty of Engineering, Fayoum University, Fayoum, Egypt. He obtained his BSc in Industrial Engineering in 2006 with honour degree, Fayoum University, and MSc in 2010 in Mechanical Design and Production from Cairo University, Cairo, Egypt. Currently, he is conducting his PhD research in Supply Chain Management at the University of Rome ‘La Sapienza’, Rome, Italy. His research interests are in the applications of AI in quality and operations management, logistics and supply chain management, and modelling and optimisation. Mohamed A. Shalaby is a Professor of IE at the Faculty of Engineering, Cairo University, Egypt. He received his BSc in 1970 in Production Engineering, Cairo University, MS and PhD in 1978 in Engineering Management and Operations Research from Southern Methodist University, Dallas, USA. He assumed his academic career at Arkansas Tech University, The American University in Cairo, and Cairo University. He is also a Professional Consultant in most facets of IE, and has research interests in modelling and simulation of manufacturing systems.
1
Introduction
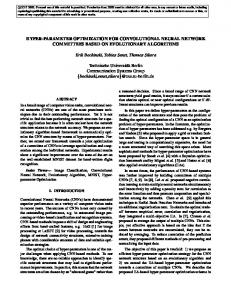
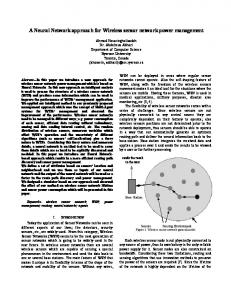
A control chart is a statistical process control technique widely is used to control industrial process (Montgomery, 1996). The behaviour of the process data on a control chart indicates whether the manufacturing process is in control or out of control. The presence of an unnatural pattern such as shifts in process mean, or trends as shown in Figure 1 means that a process is out of control. The accurate identification of these unnatural patterns will help the quality practitioners to determine the assignable causes for process variation. Moreover, the information about control chart unnatural patterns parameters such as shift magnitude and trend slope is very important for quality practitioners. The sizable shift magnitude or trend slope means that a catastrophic problem may be happened in the process and needs a quick intervention and further technical investigation. Traditional control charts cannot provide any pattern related information. Many supplementary rules such as zone tests or run rules have been suggested to assist quality practitioners in detecting the unnatural patterns (Nelson, 1984; Western Electric; 1956). Other researchers introduced new types of control charts that detect certain types of patterns such as shift (Page, 1954) and cyclic variation (Johnson and Counts, 1979; Beneke et al., 1988). Also, many researchers tried to automate the analysis of control chart patterns by developing Expert Systems to limit the human intervention in the analysis of the control chart (Cheng and Hubele, 1992; Swift and Mize, 1995). More recently; artificial neural network (ANN) approach has been investigated. Dislike expert systems approaches; ANN does not require explicit rules to identify patterns. It acquires initial knowledge of how to identify patterns by learning. Moreover ANN models are expected to overcome the problem of high false alarm rate; because it does not depend on any statistical tests that are usually required for the traditional methods. Also, no human intervention will be required when applying ANN, and thus pattern identification can be readily integrated with automated inspection, rapid manufacturing technologies, and computer integrated manufacturing.
126
A. Shaban and M.A. Shalaby
Figure 1
Basic patterns of a control chart (see online version for colours)
5
5
Upw ard Shift
4
Dow nw ard Shift
4
3
3
2
2
1
1
0
0
-1
-1
-2
-2
-3
-3
-4
-4
-5
-5
1
3
5
7
9
5
11 13 15 17 19 21 23 25 27 29 31 33 35 37 39
3
5
7
9
11 13 15 17 19 21 23 25 27 29 31 33 35 37 39
5
Upw ard Trend
4
1
Dow nw ard Trend
4
3
3
2
2
1
1
0
0
-1
-1
-2
-2
-3
-3
-4
-4
-5
-5
1
3
5
7
9
11 13 15 17 19 21 23 25 27 29 31 33 35 37 39
1
3
5
7
9
11 13 15 17 19 21 23 25 27 29 31 33 35 37 39
5 4
Natural
3 2 1 0 -1 -2 -3 -4 -5 1
2
3
5
7
9
11 13 15 17 19
21 23 25 27 29 31 33 35 37 39
Literature review
With the widespread usage of computers in manufacturing and inspection systems, there is a need to automate the online recording and analysis of process data (Guh et al., 1999) by devising a computerised detection technique. ANNs was investigated as an alternative tool for the traditional statistical process control tools. ANNs has the capability to recall learned patterns from mixed data, making ANN a suitable tool for control chart pattern identification. Earlier, some researchers developed ANN models to only detect a change in process mean or variance without the emphasis on the type of an underlying pattern (Chang and Ho, 1999; Dedeakayogullari and Burnak, 1999). Other researchers utilised several samples (data points) to detect patterns in control charts without identifying the pattern type (Cheng, 1995). Many researchers attempted to apply ANN to identify the underlying control chart patterns such as shift, trend, cyclic, etc., Guh et al. (1999) proposed a neural model which employs a pattern discrimination algorithm to identify unnatural patterns. Gauri and Chakraborty (2006) developed two feature-based approaches using heuristics and ANN to identify eight control chart patterns. They compared results of the two approaches based on the identification accuracy, and concluded that the neural network results are better. Similary, Gauri and Chakraborty (2008) selected a set of seven shape features to represent the data patterns and these features were used to train a neural network. It can be concluded that ANN is a successful tool to identify control chart patterns. The information about the pattern parameter value (such as magnitude of shift or slope of trend) is very important for quality practitioners. Less work has been devoted for
A double neural network approach
127
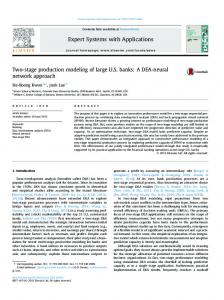
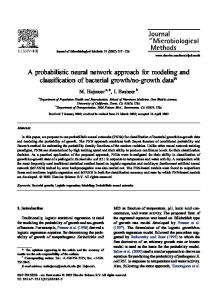
parameter estimation of the identified pattern. Guh and Hsieh (1999) proposed a neural model to identify control chart patterns and estimate key parameters of the identified unnatural pattern. Guh (2005) extended the previous work of Guh and Hsieh (1999) and developed a hybrid learning-based model, which integrates ANN and decision tree learning techniques, to detect and discriminate typical unnatural patterns, while identifying the major parameter and the starting point of the detected pattern. Fatemi Ghomia et al. (2011) proposed a similar approach to Guh (2005) to both detect single and concurrent control chart patterns and estimate their parameters. The main objective of this research is to maximise the probability of success in identifying the patterns and in estimating their parameters. This paper proposes a neural network approach to both identify the five basic control chart patterns (natural, upward shift, downward shift, upward trend, downward trend), and to estimate the parameters of the unnatural patterns. Figure 2 Proposed approach flowchart
128
3
A. Shaban and M.A. Shalaby
Proposed approach
The proposed ANN approach is applied to identify the basic control chat patterns and to estimate the unnatural patterns parameters. Two neural networks are integrated together to do this work. The first neural network ‘NN-1’ is designed and trained to identify the five basic control chart patterns; natural, upward shift, downward shift, upward trend, and downward trend. The second neural network ‘NN-2’ is trained to estimate the key parameters of the unnatural patterns. The flowchart in Figure 2 represents the flow of the process data through the two neural networks. First, the process data (x1, x2, …) is entered to the network ‘NN-1’ to identify the present pattern in the data. If the network ‘NN-1’ signals natural pattern this means that the process is in-control and no further investigation is needed. If the network ‘NN-1’ signals an unnatural pattern this means that the process is out-of control and the analyst should be alarmed. In the later case, the process data are to be entered again to NN-2 whose output value is the estimate of the identified pattern.
4
Pattern identification network ‘NN-1’
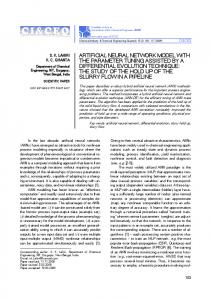
4.1 Design of NN-1 ANNs are generally made of a number of simple and highly interconnected processing elements (neurons) organised in layers (Sagiroglu et al., 2000). The design of a network consists of the determination of the number of hidden layers, the number of neurons in each layer and the type of the transfer function in each layer. Although the design of a network affects tremendously its performance, no standard or systematic method for selecting the best neural network structure (Masood and Hassan, 2010; Zorriassatine and Tannock, 1998). Figure 3 Proposed structure for NN-1
A double neural network approach
129
The proposed design of NN-1 is based on Shaban and Shalaby (2010) who reported good performance in identifying the five basic patterns of a control chart (natural, upward shift, downward shift, upward trend, downward trend). The network ‘NN-1’ is designed to consist of five layers; an input layer, three hidden layers, and output layer as shown in Figure 3. The input layer consists of 40 neurons and the three hidden layers consists of 30, 25, 25 neurons respectively. The output layer of NN-1 consists of five neurons where each neuron is assigned to one of the five target patterns (natural, upward shift, downward shift, upward trend, downward trend).
4.2 Training of ‘NN-1’ Training is performed by introducing training patterns with known (target) output to the network; the relevant actual output neuron value is compared with the target output. Differences between the target and the actual output are calculated and represented by their mean square error (MSE). A training algorithm is applied to adjust network weights (connections between neurons) such that MSE is minimised.
4.2.1 Training data generation Simulation is adopted to randomly generate the required training data set that posses some desired pattern characteristics. The following equations are used to generate data sets for five patterns: Natural pattern
x(t ) = μ + n(t )σ
(1)
Upward shift pattern x(t ) = μ + n(t )σ + d
(2)
Downward shift pattern x(t ) = μ + n(t )σ − d
(3)
x(t ) = μ + n(t )σ + s t
(4)
Upward trend pattern
Downward trend pattern x(t ) = μ + n(t )σ − s t
(5)
where x(t) is a random variable following the normal distribution and represents the sample average value at a certain time t, μ is the in-control process mean, σ is the process standard deviation, and n(t) is the natural variability element in the process and it follows the standard normal distribution N(0, 1). The term d in the shift pattern equations represents the shift magnitude from the natural process mean, and is expressed in terms of units of process standard deviation. The term s in the trend pattern equations represents the trend pattern slope per unit time. The training data was generated from a standard normal distribution with μ = 0 and σ = 1 to ensure the generality of the network to accommodate process data with positive or negative variabilities.
4.2.2 NN-1 training process A control chart pattern may appear at any parameter so that the network should be trained to detect these patterns at wide range of parameters. The required training data set which generated to train NN-1is based on Shaban and Shalaby (2010) where they used less number of patterns parameters to train a network to identify five patterns. The details of the training data set are summarised in Table 1. It is assumed that a process starts in
130
A. Shaban and M.A. Shalaby
control (exhibits a natural pattern) and then may undergo only one unnatural pattern (or an out-of-control pattern) at a time. Therefore, each training example is generated to consist of 40 points; the first 25 points are natural pattern, and the last 15 points are one of the unnatural patterns. Table 1
Training data set for NN-1 No. of Desired output vector generated 2 3 4 5 examples 1
Pattern
Training parameters
Pattern start time
Natural
μ = 0, σ = 1
1
200
1
0
0
0
0
Upward shift
d =1 σ
26
200
0
1
0
0
0
Upward trend
s = 0.05 σ, 0.1 σ
26
200 × 2
0
0
1
0
0
Downward shift
d = –1 σ
26
200
0
0
0
1
0
Downward trend
s = –0.05 σ, –0.1 σ
26
200 × 2
0
0
0
0
1
After preparing the training data set and its target, the network must be initialised for training. MATLAB neural toolbox and its environment were used to develop, train, and test the network. The network training convergence condition was set to MSE = 10–30 and the maximum number of learning cycles (epoch) allowed to reach was set to be 100 epoch. While network training by these parameters the network converged within 76 epoch to MSE = 5.7598 × 10⁻³¹.
4.3 Testing of NN-1 Probability of success expresses the capability of the algorithm to detect and classify a given pattern to its target class (Gauri and Chakraborty, 2008). Probability of success is assessed through inputting a large number of examples of known true patterns to the NN-1 model, and estimating the percentage that the identified patterns are correct. The size and diversity of the testing data sets are summarised in Table 2 where a set of new 200 testing examples are generated for each pattern parameter. Table 2
Testing data set of NN-1
Pattern
Testing parameters
Testing data set size
Natural
μ = 0, σ = 1
200
Upward shift Downward shift Upward trend Downward trend
1 σ, 2 σ, 3 σ
200 × 3
–1 σ, –2 σ, –3 σ
200 × 3
0.05 σ, 0.1 σ, 0.3 σ, 0.5 σ
200 × 4
–0.05 σ, –0.1 σ, –0.3 σ, –0.5 σ
200 × 4
Table 3 exhibits the results for testing five target patterns. Each target pattern may have five possible identifications patterns plus the unidentified class. The percentage of identifying a given target pattern by either one of the five possible patterns as shown as the table entries. Table entries represent the average percentages of identification resulted from testing ten different randomly generated data sets for each single given parameter. Thus, the probability of success in identifying a given pattern is given by the table entry
A double neural network approach
131
of this target pattern and its corresponding possible patterns. The eighth column in Table 3 represents the percentage that the network was unable to make an identification decision. Table 3 Target pattern
Average probability of success results based on ten runs Testing parameter Natural
Natural Upward shift
Downward shift
Upward trend
Downward trend
1σ
Possible identification patterns Upward shift
Downward shift
Upward trend
Downward Unidentified trend
100
0
0
0
0
0
0
100
0
0
0
0
2σ
0
100
0
0
0
0
3σ
0
100
0
0
0
0
Average
0
100
0
0
0
0
–1 σ
0
0
100
0
0
0
–2 σ
0
0
100
0
0
0
–3 σ
0
0
100
0
0
0
Average
0
0
100
0
0
0
0.05 σ
0.25
0
0
99.75
0
0
0.1 σ
0
0
0
100
0
0
0.3 σ
0
0
0
100
0
0
0.5 σ
0
0
0
100
0
0
Average
0.063
0
0
99.94
0
0
–0.05 σ
0
0
0
0
100
0
–0.1 σ
0
0
0
0
100
0
–0.3 σ
0
0
0
0
100
0
–0.5 σ
0
0
0
0
100
0
Average
0
0
0
0
100
0
Results of Table 3 show that the network can perform well in identifying the five basic patterns of control chart for a wide range of parameters. A probability of success of at least 99.75% was achieved for all testing examples. It is also noticed that the approach never failed to identify a test example, i.e., no ‘unidentified’ cases.
4.4 Comparison of NN-1 results The probability of success of NN-1 was compared with the most recent reported results in the literature; Gauri and Chakraborty (2006, 2008), Guh (2005) and Al-Assaf (2004). The comparison is summarised in Tables 4, 5, and 6. The testing parameters of each author are different. Thus, a comparison was constructed for each individual author. The comparisons indicate that the proposed approach (NN-1) is comparable if not superior to published results in the literature. It has a good consistent identification performance with the five basic control chart patterns.
132
A. Shaban and M.A. Shalaby
Table 4
Results comparison with Gauri and Chakraborty (2006, 2008)
Pattern (testing parameters)
Proposed NN-1 approach (%)
Gauri and Chakraborty (2006) (%)
Gauri and Chakraborty (2008) (%)
100
94.87
94.78
100
93.40
94.56
Natural Shift
Trend
Table 5
Upward (1.5 σ to 2.5 σ) Downward (–2.5 σ to –1.5 σ)
100
91.07
94.00
Average
100
92.23
94.28
Upward (0.05 σ to 0.1 σ)
99.88
96.53
94.89
Downward (–0.1 σ to –0.05 σ)
100
96.60
94.33
Average
99.94
96.56
94.61
Results comparison with Guh (2005)
Pattern (testing parameters)
Proposed NN-1 approach (%) 100
90.59
Upward (1.0 σ to 3.0 σ)
100
93.33
Downward (–3.0 σ to –1.0 σ)
100
90
Average
100
91.67
Upward (0.05 σ to 0.1 σ)
99.88
95.43
Downward (–0.1 σ to –0.05 σ)
100
94.57
Average
99.94
95
Proposed NN-1 approach (%)
Al-Assaf (2004) (%)
100
86.60
100
93.20
99.94
94.60
Natural Shift
Trend
Table 6
Results comparison with Al-Assaf (2004)
Pattern (testing parameters) Natural Shift
Guh (2005) (%)
Upward (1.0 σ to 3.0 σ) Downward (–3.0 σ to –1.0 σ)
Trend
Upward (0.05 σ to 0.1 σ) Downward (–0.1 σ to –0.05 σ)
5
Parameter estimation network ‘NN-2’
5.1 Design of NN-2 The design of NN-2 is the same as NN-1 except that the output layer consists only of one neuron where the value of this neuron represents the parameter estimated value of the identified pattern.
A double neural network approach
133
5.2 Training of NN-2 Four variants networks of NN-2 are used to estimate the parameters of the different unnatural patterns. The training data set for each network consists of a set of training examples generated with different parameters for each unnatural pattern, as shown in Table 7. Practically, when generating examples at a fixed parameter value the actual parameter of generated examples will have different magnitudes within a tolerance range of that fixed value. Table 7
Training data sets contents for NN-2 (four variants)
Network variant
Network function
Pattern parameters used within the training data set
NN-2 (A)
Upward shift magnitude estimation
(d = 1 σ to 3 σ, step 0.5 σ)
NN-2 (B)
Downward shift magnitude estimation
(d = –1 σ to –3 σ, step –0.5 σ)
NN-2 (C)
Upward trend slope estimation
(s = 0.04 σ to 0.5 σ, step 0.02 σ)
NN-2 (D)
Downward trend slope estimation
(s = –0.04 σ to –0.5 σ, step –0.02 σ)
In supervised training, as in this research, training requires the selection of a target output neuron value. Some authors, Guh (2005), set the target value to be the same as the fixed parameter value. For example, if 200 training examples of upward shift were generated of a shift magnitude (1 σ); the target for each example will be the same (1 σ). Another proposed approach is to use the actual parameter value of the generated examples to be the target of the output neuron. For example, if it is intended to generate a shift training example to have a major parameter (1 σ), but the pattern was generated to have actually (0.95 σ) this value will be used as a target for the generated training example. In addition, it was noticed during investigations that increasing the size of the training data set will help to improve the network estimation performance. Based on a set of preliminary experiments, the second approach (proposed) realised a better estimation performance. Therefore, a set of 600 training examples are generated for each parameter in Table 7. The training settings of the network ‘NN-1’ were used here to train the four networks, only the number of allowed epochs to reach was set to be 1,500 epochs.
5.3 Testing of NN-2 There are no particular measures in the literature to evaluate this type of work. The following measures are adopted and recommended to measure the networks estimation capability: 1
Absolute error: The average absolute difference between the true value of the pattern actual parameter and its corresponding estimated value by the network. The average is taken over all the examples in a particular testing data set.
2
Average percentage error: It is the ratio of absolute error to the true pattern parameter value for each example in the testing data set. The average, standard deviation, max, and min values of the percentage errors will be calculated for the particular testing data set.
3
Probability of success: It expresses the capability of the network to estimate a parameter value to be located within the corresponding actual parameter range.
134
A. Shaban and M.A. Shalaby
For the shift pattern (upward and downward), testing data was generated to cover the range (–3 σ, 3 σ). The generated examples in this range were divided to a set of classes with a width of 0.5 σ; for each class a set of 500 examples were generated to cover it (see, Table 8). The testing results of upward and downward shift parameters using NN-2(A) and NN-2(B) respectively are summarised in Table 8. The results show that the networks succeeded to estimate the shift magnitudes between –3 σ and 3 σ accurately and with small errors. The maximum absolute error is below 0.02 and the average percent error is very small and below 1.59% for all the classes. Probability of success is a reflection for the network estimation capability as shown the probability of success is very high and stable for all the classes. The high probability of success explains the very small error rate, where nearly all the estimated values are within the ranges of the classes and with small error than the true value. Table 8
Testing results of the shift parameter estimation Measures of NN-2 capability
Downward shift
Upward shift
Pattern
Actual parameter range
Actual average parameter
Error percentage Estimated Absolute Probability error average Avg St dev Max Min of success rate parameter err. % err. % err. % err. %
0.75
1.25
1.128
1.118
0.02
1.59
4.17
53.49
0.01
98.6
1.25
1.75
1.518
1.518
0.01
0.66
0.76
8.24
0.00
96.2
1.75
2.25
2.016
2.016
0.01
0.49
0.51
5.40
0.00
98.8
2.25
2.75
2.521
2.519
0.01
0.48
0.47
3.35
0.00
97.8
2.75
3.25
2.884
2.885
0.01
0.44
0.42
3.20
0.00
98
–1.25 –0.75
–1.130
–1.127
0.01
1.26
1.90
33.57
0.00
97.2
–1.75 –1.25
–1.508
–1.510
0.01
0.84
1.09
11.51
0.00
96.8
–2.25 –1.75
–2.011
–2.012
0.01
0.55
0.83
12.80
0.00
98.2
–2.75 –2.25
–2.511
–2.511
0.01
0.36
0.37
3.68
0.00
97.6
–3.25 –2.75
–2.891
–2.893
0.01
0.39
0.35
2.85
0.00
97.6
For the trend, the covered trend slopes are (0.04 σ to 0.5 σ) and (–0.04 σ to –0.5 σ); the testing data was generated at discrete values with increments of 0.02 σ and –0.02 σ respectively. For each slope, a set of 200 testing examples were generated to measure the network estimation capability. The two networks ‘NN-2 C’ and ‘NN-2 D’ have achieved a similar performance in terms of absolute error, error percentage and probability of success so the testing results of only one of them will be presented (see Table 9). The probability of success was calculated as the probability that the estimated parameter value lies within ± 0.01 of its actual value. Results indicate that the probability of success overall the tested parameter range is at least 98.5% for upward trend and 99.5% for downward trend, the average percent absolute error is below 1.26% for upward trend and 1.75% for downward trend, and average absolute error per data set is less than 0.0012 for both upward and downward trends. The high and consistent probability of success results at the different trend slopes indicates the robustness of the proposed network.
A double neural network approach Table 9
135
Testing results of the upward trend slope estimation network Measures of NN-2 capability
Upward trend
Pattern
Actual slope
Actual average parameter
0.04 0.06
Estimated average parameter
Absolute error rate
0.040
0.040
0.060
0.060
0.08
0.080
0.1
0.100
0.12 0.14
Error percentage
Probability of success
Avg % err.
St dev % err.
Max % err.
Min % err.
0.001
1.26
1.05
4.96
0.00
100
0.000
0.70
0.71
3.60
0.00
100
0.080
0.001
0.69
2.30
31.74
0.00
99.5
0.100
0.001
0.62
1.32
14.73
0.00
99
0.120
0.120
0.001
0.42
0.34
1.64
0.01
100
0.140
0.140
0.001
0.35
0.34
1.93
0.01
100
0.16
0.160
0.160
0.001
0.36
0.39
3.30
0.00
100
0.18
0.180
0.180
0.001
0.30
0.29
1.85
0.00
100
0.2
0.200
0.200
0.001
0.29
0.30
2.57
0.00
100
0.22
0.220
0.220
0.001
0.28
0.26
1.65
0.00
100
0.24
0.240
0.240
0.001
0.27
0.23
1.19
0.00
100
0.26
0.260
0.260
0.001
0.28
0.24
1.55
0.00
100
0.28
0.280
0.280
0.001
0.24
0.18
1.06
0.00
100
0.30
0.300
0.300
0.001
0.25
0.21
1.29
0.00
100
0.32
0.320
0.320
0.001
0.26
0.22
1.31
0.00
100
0.34
0.340
0.340
0.001
0.20
0.20
1.67
0.00
100
0.36
0.360
0.360
0.001
0.18
0.17
1.19
0.00
99.5
0.38
0.380
0.380
0.001
0.18
0.16
0.90
0.00
100
0.4
0.400
0.400
0.001
0.18
0.17
1.40
0.00
100
0.42
0.420
0.420
0.001
0.17
0.16
1.26
0.00
99.5
0.44
0.440
0.440
0.001
0.19
0.16
0.98
0.00
100
0.46
0.460
0.460
0.001
0.18
0.17
1.53
0.00
100
0.48
0.480
0.480
0.001
0.21
0.16
0.97
0.00
100
0.50
0.500
0.500
0.001
0.22
0.24
2.41
0.00
98.5
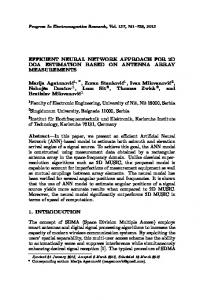
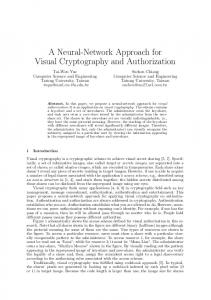
5.4 Comparison of NN-2 results The parameter estimation results are compared with the results of Guh (2005). He developed a neural model to identify the control chart patterns and complemented this model with a special set of neural networks to estimate the parameters of the identified unnatural patterns. Each neural network was assigned for a certain unnatural pattern. The error in Guh (2005) is defined as the difference between the average estimated parameter value for a certain pattern and the target parameter value. Figure 4 presents a comparison between the results of the network NN-2 and the results of Guh (2005). The figure consists of two columns, and four rows represent the four unnatural patterns. Each row has two plots; the left hand side plot presents a comparison between the estimated values of the pattern parameters by NN-2 and Guh; and the right hand side presents a
136
A. Shaban and M.A. Shalaby
comparison between the estimation error of NN-2 and Guh. It is noticed that the estimated values by NN-2 (A-D) are near from the actual (target) values than the estimated values by Guh, and the relation between the actual values of the testing parameters and the estimated values appears as a straight line (see, Figure 4). Also, the estimation error of NN-2 at the different patterns is always below the estimation error of Guh where the max estimation error of NN-2 is below 0.015 and the max estimation error of Guh is greater than 0.09. The four networks (variants) succeeded to estimate accurately the different pattern parameters. Moreover, the four networks were trained to cover a wide range of the trend slopes than Guh, where he only covered the range (0.1, 0.26) for the upward trend and range (–0.1, –0.26) for the downward trend. Thus NN-2 variants are capable to estimate wider parameter ranges, with confidence. Figure 4 Results comparison with Guh (2005) (see online version for colours) Estimated Values of Upward Shift Parameters NN‐2 (A) Guh (2005) Estimation Error (σ)
Estimated Value (σ)
3.50 3.25 3.00 2.75 2.50 2.25 2.00 1.75 1.50 1.25 1.00 0.75 0.50 1.00
1.25
1.50
1.75 2.00 2.25 Testing Parmater (σ)
2.50
2.75
3.00
0.12 0.11 0.10 0.09 0.08 0.07 0.06 0.05 0.04 0.03 0.02 0.01 0.00 1.00
Estimation Erorr at Different Upward Shift Parameters
Estimation Error (σ)
Estimated Value (σ)
Guh (2005)
-1.50
-1.75
-2.00
-2.25
-2.50
-2.75
-3.00
Testing Parmater (σ)
1.50
0.12 0.11 0.10 0.09 0.08 0.07 0.06 0.05 0.04 0.03 0.02 0.01 0.00 -1.00
0.010
-1.25
-1.50
0.009
NN‐2 (C)
Guh (2005)
0.008
Guh (2005)
0.14 0.12 0.10 0.08 0.10
0.12
0.14
0.16
0.18
0.20
Testing Parmater (σ)
0.22
0.24
0.26
2.75
3.00
-1.75
-2.00
-2.25
-2.50
-2.75
-3.00
Estimation Erorr at Different Upward Trend Parameters
NN‐2 (C)
0.16
2.50
Guh (2005)
0.24
0.18
2.25
NN‐2 (B)
0.26
0.20
2.00
Testing Parmater (σ)
Estimated Values of Upward Trend Parameters
0.22
1.75
Estimation Erorr at Different Downward Shift Parameters
Estimation Error (σ)
Estimated Value (σ)
0.28
1.25
Testing Parmater (σ)
NN‐2 (B)
-1.25
Guh (2005)
Estimated Values of Downward Shift Parameters -3.50 -3.25 -3.00 -2.75 -2.50 -2.25 -2.00 -1.75 -1.50 -1.25 -1.00 -0.75 -0.50 -1.00
NN‐2 (A)
0.007 0.006 0.005 0.004 0.003 0.002 0.001 0.000 0.10
0.12
0.14
0.16
0.18
0.20
Testing Parmater (σ)
0.22
0.24
0.26
A double neural network approach Figure 4
137
Results comparison with Guh (2005) (continued) (see online version for colours)
Estimated Values of Downward Trend Parameters -0.28
0.010
-0.26
NN‐2 (D)
0.009
NN‐2 (D)
-0.24
Guh (2005)
0.008
Guh (2005)
Estimation Error (σ)
Estimated Value (σ)
-0.22 -0.20 -0.18 -0.16 -0.14 -0.12 -0.10 -0.08 -0.10
-0.12
-0.14
-0.16
-0.18
-0.20
Testing Parmater (σ)
6
Estimation Erorr at Different Downward Trend Parameters
-0.22
-0.24
0.007 0.006 0.005 0.004 0.003 0.002 0.001 0.000 -0.10
-0.26
-0.12
-0.14
-0.16
-0.18
-0.20
Testing Parmater (σ)
-0.22
-0.24
-0.26
Conclusions
Control chart is an important tool to discover the industrial processes problems. The pattern that appears on a control chart provides much information about the process. The patterns may be natural or unnatural; the presence of an unnatural pattern is an indication for a problem in the process. In addition to the identification of control chart patterns, the information about the pattern parameter such as shift magnitude or trend slope is very important. The proposed approach utilises neural networks to both identify control chart patterns and to estimate the patterns parameters. A single neural network was trained to identify the five basic control chart patterns: natural, upward shift, downward shift, upward trend, downward trend. Four neural networks were used to estimate the patterns parameters; each network is specialised for a certain unnatural pattern. It is noticed that using the actual parameters of unnatural patterns to be the target of the output neurons is recommended for the training of a network to estimate the unnatural patterns parameters. The testing results and the comparisons indicate the capability of the proposed approach to both patterns identification and parameters estimation. Although the presented approach is devised to support real time and automated applications, several researches are yet to be investigated. The NN approach (and other AI techniques) needs to be tested for other unnatural patterns such as cyclic, systematic, and mixture of patterns (simultaneous shift and trend). Real time applications, such as automated inspection machines, require faster identification methods to match possible high rates of production. Also another important practical criterion is yet to be evaluated, ‘the Average Run Length ARL’, which expresses the required number of realised process readings prior to the identification of an accurate unnatural pattern. The presented work of animating actual processes by generating training and testing data, the two-stage NN identification process, and the evaluation criteria can also be used as a framework to conduct further research in the area.
138
A. Shaban and M.A. Shalaby
References Al-Assaf, Y. (2004) ‘Recognition of control chart patterns using multi-resolution wavelets analysis and neural networks’, Computers and Industrial Engineering, Vol. 47, No. 1, pp.17–29. Beneke, M., Leemis, L., Schlegel, R. and Foote, B. (1988) ‘Spectral analysis in quality control: a control chart based on the periodogram’, Technometrics, Vol. 30, No. 1, pp.63–70. Chang, S.I. and Ho, E.S. (1999) ‘An integrated neural network approach for simultaneous monitoring of process mean and variance shifts a comparative study’, International Journal of Production Research, Vol. 37, No. 8, pp.1881–1901. Cheng, C.S. (1995) ‘A multi-layer neural network model for detecting changes in the process mean’, Computers and Industrial Engineering, Vol. 28, No. 1, pp.51–61. Cheng, C.S. and Hubele, N.F. (1992) ‘Design of a knowledge-based expert system for statistical process control’, Computers and Industrial Engineering, Vol. 22, No. 4, pp.501–517. Dedeakayogullari, I. and Burnak, N. (1999) ‘Determination of mean and/or variance shifts with artificial neural networks’, International Journal of Production Research, Vol. 37, No. 10, pp.2191–2200. Fatemi Ghomia, S.M.T., Lesanyb, S.A. and Koochakzadehc, A. (2011) ‘Recognition of unnatural patterns in process control charts through combining two types of neural networks’, Applied Soft Computing, Vol. 11, No. 8, pp.5444–5456. Gauri, S.K. and Chakraborty, S. (2006) ‘Feature-based recognition of control chart patterns’, Computers and Industrial Engineering, Vol. 51, No. 4, pp.726–742. Gauri, S.K. and Chakraborty, S. (2008) ‘Improved recognition of control chart patterns using artificial neural networks’, International Journal of Advanced Manufacturing Technology, Vol. 36, Nos. 11/12, pp.1191–1201. Guh, R.S. and Hsieh, Y.C. (1999) ‘A neural network based model for abnormal pattern recognition of control charts’, Computers and Industrial Engineering, Vol. 36, No. 1, pp.97–108. Guh, R-S. (2005) ‘A hybrid learning-based model for on-line detection and analysis of control chart patterns’, Computers and Industrial Engineering, Vol. 49, No. 1, pp.35–62. Guh, R-S., Zorriassatine, F., Tannock, J.D.T. and O’Brien, C. (1999) ‘On-line control chart pattern detection and discrimination – a neural network approach’, Artificial Intelligence in Engineering, Vol. 13, No. 13, pp.413–425. Johnson, E.E. and Counts, R.W. (1979) ‘Cyclic data control charts’, Journal of Quality Technology, Vol. 11, No. 1, pp.28–35. Masood, I. and Hassan, A. (2010) ‘Issues in development of artificial neural network based control chart pattern recognition schemes’, European Journal of Scientific Research, Vol. 39, No. 3, pp.336–355. Montgomery, D.C. (1996) Introduction to Statistical Quality Control, 3rd ed., Wiley, New York. Nelson, L.S. (1984) ‘The shewhart control chart – tests for special causes’, Journal of Quality Technology, Vol. 16, No. 4, pp.237–239. Page, E.S. (1954) ‘Continuous inspection schemes’, Biometrika, Vol. 41, Nos. 1/2, pp.100–115. Sagiroglu, S., Besdok, E. and Erler, M. (2000) ‘Control chart pattern recognition using artificial neural networks’, Turk J Elec Engin, Vol. 8, No. 2, pp.137–147. Shaban, A. and Shalaby, M.A. (2010) ‘A double neural network approach for the automated detection of quality control chart patterns’, Int. J. Rapid Manufacturing, Vol. 1, No. 3, pp.278–291. Swift, J.A., and Mize, J.H. (1995) ‘Out-of-control pattern recognition and analysis for quality control charts using lisp-based systems’, Computers and Industrial Engineering, Vol. 28, No. 1, pp.81–91. Western Electric (1956) Statistical Quality Control Handbook, AT&T, Princeton, New Jersey. Zorriassatine, F. and Tannock, J.D.T. (1998) ‘A review of neural networks for statistical process control’, Journal of Intelligent Manufacturing, Vol. 9, No. 3, pp.209–224.