(PSD) of the noise and the PSD of the speech, LOCO makes use of the spatial ... Furthermore, the source code required to generate the results presented in this ...
18th European Signal Processing Conference (EUSIPCO-2010)
Aalborg, Denmark, August 23-27, 2010
A KALMAN FILTER BASED NOISE SUPPRESSION ALGORITHM USING SPEECH AND NOISE MODELS DERIVED FROM SPATIAL INFORMATION Ramun Schmid, Guido M. Schuster University of Applied Sciences of Eastern Switzerland in Rapperswil, Switzerland
ABSTRACT In this paper, a novel Kalman filter based noise suppression algorithm for hearing aids, using spatial information for estimating the required noise and speech models, is proposed. The main assumption of the scheme is that the target (usually the speech signal) is directly in front of the hearing aid user while the interference (usually the noise signal) comes from the back hemisphere. While in an earlier paper [1], a related approach based on instantaneous Wiener filters using a Weighted Overlap Add (WOLA) decomposition has been presented, this paper focuses on a time domain approach employing a time varying Kalman filter. Clearly, with the proper noise and speech models, one would expect a better performance of a time varying Kalman filter than of a WOLA Wiener filter. Hearing tests as well as objective performance measures show the excellent performance of the Kalman filter based noise suppression algorithm.
damental importance. Note that this paper presents the most important results of a larger thesis (in German), which can be found in [7]. Furthermore, the source code required to generate the results presented in this paper can also be found in [7]. The paper is organized as follows. In section 2, the notation and the performance measures used throughout this paper are introduced. In section 3, the main ideas behind the proposed scheme and the underlying speech/noise models are discussed and one selected implementation based on LPC analysis is presented in detail. Finally, the experimental results are shown in section 5, where the results of the proposed scheme are compared to the well-known Elko-beamformer [8] and the WOLA-LOCO [1] scheme. 2. NOTATION AND PERFORMANCE MEASURES
1. INTRODUCTION The proposed algorithm is based on the LOCO (LOw COmplexity) idea, which was originally published in [1]. Based on an adaptive Elko-beamformer, LOCO describes a new way to estimate the statistical properties of the signal and noise in the beamformed signal. While in traditional approaches, the single beamformed signal is used to drive the statistical estimators which attempt to estimate the power spectral density (PSD) of the noise and the PSD of the speech, LOCO makes use of the spatial information. Based on our main assumption that the target is directly in front of the hearing aid user while the noise comes from the back hemisphere, LOCO uses the front- and back-cardioids of the Elko-beamformer for the estimation of the speech and the noise properties respectively (Fig. 3). This idea can be implemented in different ways. In [1], it was used to estimate the PSDs as the squared magnitude of a frame based Fast Fourier Transform (FFT). Based on these PSDs, a corresponding instantaneous Wiener filter was calculated and applied to the beamformed signal, which resulted in excellent acoustic properties. Implemented in a WOLA framework (WOLA-LOCO), this scheme results in a data expansion. To avoid this, alternative schemes based on wavelets (Wavelet LOCO) have been proposed [1]. These Wavelet LOCO algorithms showed similar acoustic properties to the WOLA-LOCO, but as they don’t result in a data expansion, they are computationally more efficient. While applying a Wiener filter, the WOLA-LOCO as well as the Wavelet LOCO algorithm treat the beamformed signal as if it were stationary. Since this assumption is incorrect for a natural speech signal, the applied Wiener filter has to be changed from frame to frame. Since a Kalman filter is the nonstationary equivalent of a causal Wiener filter, the step away from the instantaneous Wiener filter towards a time varying Kalman filter should result in a smaller mean squared error and hence in improved performance. Clearly, while for the Wiener filter the estimation of the speech and noise PSDs is the critical part, for a Kalman filter, the estimation of the speech and noise model parameters is of fun-
© EURASIP, 2010 ISSN 2076-1465
Itakura Distortion Measure / MSE s x = s+n
ŝ
Algorithm
n sSNRin
sSNRout
Figure 1: Notation To measure the final speech signal quality, different quality measures were used. For good comparability with [1] the same two representative objective speech quality measures will be used here: the segmental Signal to Noise Ratio (sSNR) and the Itakura Distortion Measure (ID). And finally, since the Kalman filter is built to optimize the Mean Squared Error (MSE), we will use this measure as well. 2.1 Mean Squared Error It is well known that the MSE is not an adequate measure for speech quality. It is nevertheless important for this paper, since the Kalman filter minimizes the MSE: MSE =
N 1 X (s(n) − sˆ(n))2 N n=1
(1)
where N is the length of the speech signal in samples. 2.2 Segmental SNR The segmental SNR is a simple and effective speech quality measure which allows for good comparability:
sSNRdB = 10 ·
M −1 X
N ·m+N P −1
n=N ·m 1 · log N ·m+N P −1 M m=0 n=N ·m
1524
s2 [n] n2 [n]
(2)
where N denotes the segment width in samples. During the project, various segment sizes suggested in the literature were evaluated and 20 ms = 410 Samples (at a sampling rate of 20480 Samples/s) resulted in the best performance. To calculate the instantaneous signal and noise output powers, the algorithm is fed with the x = s and x = n signals separately. However, all internal parameters are adapted as in the x = s+n case. In other words, this allows the calculation of the output sSNR because the response of the system to the noise only as well as to the signal only can be measured.
the desired speech signal to come from the front and define everything from the back as noise, we can use the front and back cardioid signals (which are already available from the Elko-beamformer) as estimators of the speech and noise signals (Fig. 3). 0°
90°
2.3 Itakura Distance Measure The well known Itakura Distance Measure, which is also called the Log Likelihood Ratio, is selected as the second representative objective speech quality measure. The Itakura Distance Measure is defined as follows: � T � � � b RSS b ˆ dID Sm (k), Sm (k) = ln (3) aT RSS a where k = n ∈ [N · m , N · m + N − 1], RSS is the correlation matrix of the clean signal and a and b are the LPC coefficient vectors of the approximated (output) signal and the clean signal, respectively. Again, segments of 20 ms and LPC order of 14 showed good results. In the end, all segmental values are arithmetically averaged. Even though objective quality measures are important, the final judgment of the speech quality is reserved for human listeners. For this purpose, the original and processed sound files can be found in [7].
-90°
a(n)
A
a[n]
α z-1
0°
90°
-90°
±180°
-
Equalizer +
β
LMS
b(n)
Back Mic
α z-1
cb(n)
x
Equalizer
+
+
-90°
±180°
B
90°
±180°
Front Mic
Equalizer
-
y(n)
s(n)
Kalman-filter
cf(n)
Beamformer
Figure 3: LOCO Algorithm The front and back cardioid signals as well as the beamformed signal show highpass characteristics (1 − z −2 for signals from the front with α = 1). The beamformed signal can be equalized very efficiently with an IIR filter which has the inverse transfer function
2.4 Scenarios During this project, carefully recorded sound files using a KEMAR were used to test the algorithm. The KEMAR manikin was equipped with two behind the ear (BTE) hearing aids. Each hearing aid contained two microphones in end-fire configuration that were connected to a digital audio recording system. For the results reported in this paper, the recording was done in an anechoic chamber. Furthermore, several acoustic scenarios were used, the four most common ones being shown here as examples. The desired speech signal always comes from the front (0◦ ), but the direction of the interfering signal differs. This different direction of the interfering signal exhibits itself in a time delay between the front microphone signal and the back microphone signal.
0°
H(z) =
1 1 − β · (1 − α) − α · z −2
(4)
where β is the adaptive parameter which determines the directivity of the Elko-beamformer. The cardioid signals used for the speech/noise model parameter estimates can be equalized with the following filter: H(z) =
1 1 − α z−2
(5)
Choosing α < 1 ensures the stability of these equalizers. 3. SPEECH MODEL AND KALMAN FILTER v(n) ζ(n)
AR(p)
s(n)
+ η(n)
Interfering signal
In the above figures, the interference is a female speech signal, while the desired signal (the signal at 0◦ ) is a male speech signal and the listener stands in the middle of the circle. The three leftmost scenarios show the interference at 90◦ , 135◦ and 180◦ , while the rightmost scenario shows the so called cocktail-party situation, where there are multiple interferences (male and female) from all around the listener at 45◦ , 90◦ , 135◦ , 180◦ , 225◦ , 270◦ and 315◦ .
Kalmanfilter
s(n)
i(n)
Using a Kalman filter for speech enhancement asks for a state space model. An appropriate one that is often used (e.g. in [3]), assumes that the speech signal s(n) as well as the interference signal i(n) can be adequately modeled by Autoregressive (AR) processes of order p and q respectively: s(n) = −
p X
ak (n) s(n − k) + ζ(n)
(6)
bk (n) i(n − k) + η(n)
(7)
k=1 q
i(n) = −
X k=1
2.5 LOCO The proposed algorithm, which has been named LOCO, is based on an Elko-beamformer (see Fig. 3). Since we expect
y(n)
Figure 4: The speech / interference model
Desired signal
Figure 2: Acoustic scenarios
AR(q)
+
The excitation signals ζ(n) and η(n) are assumed to be independent zero mean white Gaussian noise with variance
1525
σζ2 (n) and ση2 (n) respectively. A corresponding state space model with the state vector T x(n) = [s(n − p + 1) · · · s(n) i(n − q + 1) · · · i(n)] can be given as x(n) = A(n − 1) x(n − 1) + B u(n) y(n) = C x(n) + ν(n)
(8) (9)
where ν(n) is the white, Gaussian measurement error with T variance σν2 and the input u(n) = [ζ(n) η(n)] . The transition matrix A(n), the input matrix B and the output matrix C are defined as follows: p z }| { 0 1 . .. 0 p,q 1 −ap · · · · · · −a1 A(n) = 0 1 .. . 0 q,p 1 −bq · · · · · · −b1 | {z }
the Kalman gain vector and I the identity matrix of order p + q. The estimated speech signal sˆ(n) can be found at the pth position of the estimated state vector x ˆ(n|n). Note that because of the special structure of the vector x(n), one will estimate not only s(n) but also s(n − 1) · · · s(n − p + 1). Since these estimates are all based on measurements y(k) with k up to n, they correspond to fixed-lag estimates sˆ(n − 1|n) · · · sˆ(n − p + 1|n) [6]. As shown in [4], fixed-lag smoothers can give better results because they lead to better suppression in spectral valleys. While working with artificial speech signals, with a growing fixed-lag, the improvement was evident [7]. However, with real-world speech signals fixed-lag smoothing did not result in the expected better performance. 4. DIFFERENT SCHEMES The way the proposed speech and noise models and the corresponding Kalman filter are employed for the purpose of noise suppression is not unique. One can think of several different approaches, to estimate the parameters and to run the Kalman filter. Most meaningful combinations have been implemented in [7]. In our tests, the three schemes shown in Fig. 5 resulted in the best performances.
q
Kalman LOCO
(10) z B = 0 0 " z C= 0
q
p
}| ··· 0 ··· 0
{ 1 0
z 0 0
}| ··· 0 ··· 0
{ 1
z 0
}| ··· 0
p
}| ··· 0
T { 0 1
Framebased parameter estimation (LPC)
(11)
Streambased parameter estimation (RLS)
#
q
{ 1
(12)
Note that for simplicity A(n) in (10) is shown as time invariant, while in fact, the parameters ak and bk may change at every time step n (as shown in (6) and (7)). This ability of the Kalman filter to deal with a time variant signal and speech model is essential for the use of the Kalman filter instead of a Wiener filter. Since in real world applications the input u(n) is unknown, one will consider it to be zero. Based on this simplification one will have an uncertainty in the state vector x(n). The covariance matrix Qw (n) of the corresponding state error can be calculated as follows: � 2 � n o σ (n) 0 Qw (n) = B E u(n) uT (n) B T = B ζ BT 0 ση2 (n) (13) Based on this state space model, a Kalman filter can be used to estimate the state vector x(n) based on the noisy measurements y(k) (k up to n). This estimate x ˆ(n) is given as follows [2]. x ˆ(n|n − 1) = A(n − 1)ˆ x(n − 1|n − 1) ˆ P (n|n − 1) = A(n − 1)Pˆ (n − 1|n − 1)AT (n − 1) + Qw (n) Pˆ (n|n − 1)C T (14) C Pˆ (n|n − 1)C T + Qv (n) x ˆ(n|n) = x ˆ(n|n − 1) + K(n)[y(n) − C(n)ˆ x(n|n − 1)] Pˆ (n|n) = [I − K(n)C(n)] Pˆ (n|n − 1) K(n) =
Where Pˆ (n|n − 1) and Pˆ (n|n) are the a priori and the a posteriori error covariance matrices respectively. K(n) is
Framebased Kalman-filter
Streambased Kalman-filter
Streambased Kalman-filter
Kalman LOCOFF
Kalman LOCOFS
Kalman LOCOSS
Figure 5: Different Kalman LOCO Schemes Because of the brevity of this paper, we will focus on the Kalman LOCOFS scheme. From all the tested schemes, this has shown to be the most successful one. For more information on the other schemes, refer to [7]. Figure 6 gives an overview of the proposed Kalman LOCOFS scheme. 4.1 Parameter estimation The estimation of the target (speech) and interference (noise) parameters ak , bk , σζ2 and ση2 proved to be one of the key points in the proposed scheme. Based on the LOCO idea, several algorithms have been implemented and tested on real-world speech signals. Estimating the parameters by Linear Predictive Coding (LPC) analysis showed the best overall performance. The frames of length 128 samples used for the LPC analysis are windowed (with a Hann window) and overlapped by 75%. To ensure stability of the estimated systems, we use the autocorrelation method for the LPC analysis [5]. With T the autocorrelation vector rx = [rx (1) · · · rx (p)] of the windowed frame, the corresponding LPC parameters T a = [a1 · · · ak ] can be calculated with the following formula: Rx a = −rx
(15)
where Rx is the p × p Toeplitz autocorrelation matrix. The power σ 2 of the corresponding excitation signal can be cal-
1526
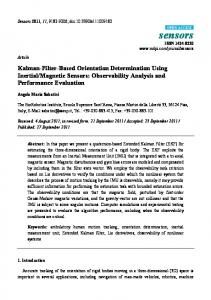
with higher orders, the speech and interference signal can be modeled more precisely and therefore the results become better. This behavior can be seen in Figs. 8 to 10.
Kalman LOCOFS cf(n)
Stream to Frames
Hann
LPC(p)
σζ2 (f )
ak(f)
0.32 Kalman LOCO
Frames to Stream
0.3
σζ2 (n) ak(n) KalmanFilter
Ta r g e t
0.28 s(n)
MSE
y(n)
FS
WOLA−LOCO
0.26 0.24
ση2 (n) bk(n)
0.22
Frames to Stream
0.2
ση2 (f ) bk(f) cb(n)
Stream to Frames
Hann
Sp e e ch
0
5
10 p, q
15
20
LPC(q)
Figure 8: The MSE vs. the model order
Figure 6: Kalman LOCOFS
2.5 2
culated as follows:
σ =
ak rx (k)
k=1
Kalman LOCO
1.5
FS
WOLA−LOCO
(16)
N
1
where N = 128 is the number of samples per frame. To suppress possible artifacts, the estimated parameters need to be smoothed. To avoid the risk of producing unstable systems, the parameters are not smoothed directly. Instead, the autocorrelation vector rx used in the LPC analysis is smoothed with a simple first order IIR lowpass filter with a time constant of τ = (−32/20480)/ ln(0.95) ≈ 30 ms. For the estimation of the variance σν2 of the measurement error, we assume that it is a property of the measurement equipment and stays constant over time. Based on this assumption, it is straight forward to measure this variance offline during a speech pause. It is then implemented as a constant in the algorithm.
Sp e e ch
0.5
0
5
10 p, q