Hindawi Publishing Corporation Discrete Dynamics in Nature and Society Volume 2014, Article ID 840725, 11 pages http://dx.doi.org/10.1155/2014/840725
Research Article A Stochastic Dynamic Programming Approach Based on Bounded Rationality and Application to Dynamic Portfolio Choice Wenjie Bi, Liuqing Tian, Haiying Liu, and Xiaohong Chen Business School, Central South University, Changsha, Hunan 410083, China Correspondence should be addressed to Wenjie Bi;
[email protected] Received 14 March 2014; Accepted 5 May 2014; Published 22 May 2014 Academic Editor: Fenghua Wen Copyright © 2014 Wenjie Bi et al. This is an open access article distributed under the Creative Commons Attribution License, which permits unrestricted use, distribution, and reproduction in any medium, provided the original work is properly cited. Dynamic portfolio choice is an important problem in finance, but the optimal strategy analysis is difficult when considering multiple stochastic volatility variables such as the stock price, interest rate, and income. Besides, recent research in experimental economics indicates that the agent shows limited attention, considering only the variables with high fluctuations but ignoring those with small ones. By extending the sparse max method, we propose an approach to solve dynamic programming problem with small stochastic volatility and the agent’s bounded rationality. This approach considers the agent’s behavioral factors and avoids effectively the “Curse of Dimensionality” in a dynamic programming problem with more than a few state variables. We then apply it to Merton dynamic portfolio choice model with stochastic volatility and get a tractable solution. Finally, the numerical analysis shows that the bounded rational agent may pay no attention to the varying equity premium and interest rate with small variance.
1. Introduction In reality, how to choose an asset’s portfolio of consumption and investment is one of the most important decisions for many people. In modern portfolio choice field, Merton [1, 2] provides a general framework for understanding the portfolio demand of long-term investors when investment opportunities change over time. In a classical Merton model [1, 2], however, the riskless interest rate, the risky mean rate of return, and the volatility coefficient are usually assumed to be constant. These assumptions are lack of realism, particularly over long time intervals. A large volume of empirical researches in financial market which indicates the assumption that these variables are stochastic volatile and follow a certain stochastic process (e.g., Ornstein-Uhlenbeck process) is more realistic [3, 4]. But when introducing these stochastic variables into the Merton-style portfolio choice model, the problem becomes increasingly complicated and formidable to solve. Also, this will lead to the “Curse of Dimensionality.” Quite a lot of approaches have been developed to deal with this kind of problems, such as martingale methods [5–8] and various approximate numerical algorithms [9–12]. However, these methods have more restrictive assumptions and are too
complex to get a tractable solution of strong explanations. Based on the control of small noise, Judd and Guu [13] proposed a method to solve dynamic programming problems with stochastic disturbance. He makes the simplifying assumption that uncertainty is small and obtains the first- and high-order solutions of complicated dynamic programming model. This method provides a quite suitable solution for dynamic portfolio choice model with stochastic volatility. On the other hand, a growing body of empirical studies indicate that the agent considers only the variables with high fluctuations but ignores those with small ones [14–16]. Bordalo et al. [17] showed that the agent rationally chooses to be inattentive to news. K˝oszegi and Szeidl [18] analyzed the monetary policy and found out that when price is changed, the decision makers are usually unaware of it. There are also many literatures showing that the agent pays attention to salient factors. Sims [19] uses two empirical strategies to analyze how individuals optimize fully with respect to the incentives created by tax policies and shows that tax salience affects agents’ behavioral response. Peng and Xiong [20] study the allocation of investors’ attention among different information. They find out that investors with limited attention will focus on macroeconomic and industry information rather
2
Discrete Dynamics in Nature and Society
than that of a specific firm. Seasholes and Wu [21] demonstrate that attention-grabbing events will attract investors’ attention. In their model, they regard them as the proxy variables and their results empirically indicate that these events have a significant impact on the allocation of investor’s attention. Ma´ckowiak and Wiederholt [22] show that decision makers’ attention is usually drawn to salient payoffs. In recent years, Gabaix [23] provides a sparse max operator to model dynamic programming with bounded rationality. In the sparse max, the agent pays less or no attention to some features the fluctuations of which are smaller than some thresholds, and he tries to strike a good balance between the utility loss of inattention and the cognitive cost which can be regarded as the loss for taking time to think about the decisions rather than to enjoy oneself. The sparse max seems more realistic than traditional economic models since it has a very robust psychological foundation. Also, it can deal with problems of maximization with constraints easily and get a tractable solution in a parsimonious way. However, Gabaix [23] only studies the dynamic programming in a stationary environment without the stochastic volatility terms. But the financial market is strewn with numerous stochastic dynamic programming problems, and these problems are hard to solve due to multitudinous state variables. To address this issue, we extend the sparse max operator and develop a stochastic version of Gabaix’s method. The distinctive feature of this method is that it considers the agent’s behavioral factors (limited attention) and can effectively preclude the “Curse of Dimensionality” for multiple variables. To verify the validity and practicability of our model, we consider the Merton dynamic portfolio choice problem with stochastic volatility variables (e.g., [24, 25]) and get a tractable solution. The remainder of this paper is organized as follows. Section 2 presents the sparse dynamic programming method proposed by Gabaix [23]. Section 3 extends this model and gives a general principle for solving continuoustime dynamic programming with stochastic variables. In Section 4, we apply our method to Merton dynamic portfolio choice. Finally, we discuss some implications of our findings and suggest topics for future research in Section 5.
𝑢 (𝑎, y)
subject to 𝑏 (𝑎, y) ≥ 0,
(2) where V(m) := 𝑢(𝑎(y𝑠 (m)), y) is the utility for a sparse agent, y𝑠 (m) = (𝑦1𝑠 , 𝑦2𝑠 , . . . , 𝑦𝑛𝑠 ), l := (1, 1, . . . , 1)𝑇 , and V(l) is the utility when the agent is fully attentive. 𝑜(‖y‖2 ) denotes the second-order infinitesimal of y. Λ 𝑖𝑗 = −𝜎𝑖𝑗 𝑎𝑦2𝑖 𝑢𝑎𝑎 , where 𝜎𝑖𝑗 = cov(𝑦𝑖 , 𝑦𝑗 ), 𝐸(𝑦𝑖 ) = 0, 𝜎𝑖 is the standard deviation of 𝑦𝑖 , and 𝑎𝑦𝑖 = −𝑢𝑎𝑎 /𝑢𝑎𝑦𝑖 which indicates by how much a change 𝑦𝑖 should change the action for traditional agent. 𝑢𝑎𝑎 is the second derivative of 𝑢 with respect to 𝑎. All derivatives above are evaluated at y = 0 and the default action 𝑎𝑑 = argmax𝑎 𝑢(𝑎, 0). Gabaix [23] assumes the cognitive cost is 𝑐(𝑚𝑖 ) = 𝜅|𝑚𝑖 |𝛽 , where 𝛽 ≥ 0 and parameter 𝜅 ≥ 0 is a penalty for lack of sparsity. If 𝜅 = 0, the agent will be a traditional, rational agent. Based on above analysis, Gabaix [23] defines the sparse max operator as follows. Definition 1 (see [23] Sparse max operator without constraints). The sparse max defined by the following procedure. Step 1. Choose the attention vector m∗ m∗ = arg min m
𝑛 1 𝑛 𝛽 ∑ (1 − 𝑚𝑖 ) Λ 𝑖𝑗 (1 − 𝑚𝑗 ) + 𝜅 ∑ 𝑚𝑖 . (3) 2 𝑖⋅𝑗=1 𝑖=1
Define 𝑦𝑖𝑠 = 𝑚𝑖∗ 𝑦𝑖 as the sparse representation of 𝑦𝑖 . Step 2. Choose the action 𝑎
We mainly introduce the sparse max operator proposed by Gabaix [23] in this section. In the traditional version, the agent faces a maximization problem: 𝑎
1 2 𝐸 [V (m) − V (l)] = − ∑ (𝑚𝑖 − 1) Λ 𝑖𝑗 (𝑚𝑗 − 1) + 𝑜 (y ) , 2 𝑖,𝑗
𝑎𝑠 = arg max 𝑢 (𝑎, y𝑠 ) ,
2. The Sparse Max Operator without Constraints
max
Hence, the agent might sensibly pick a “sparse” representation of the variables; namely, choose the attention vector m = (𝑚1 , 𝑚2 , . . . , 𝑚𝑛 ) to replace variable 𝑦𝑖 with 𝑦𝑖𝑠 = 𝑚𝑖 𝑦𝑖 𝑖 ∈ (1, 2, . . . , 𝑛), where the superscript 𝑠 of 𝑦𝑖𝑠 represents sparse. The optimal attention vector is obtained by weighing the utility losses for imperfect inattention against the cost savings without thinking too much. The utility losses from imperfect inattention can be expressed as follows [23]:
(1)
where y = (𝑦1 , 𝑦2 , . . . , 𝑦𝑛 ), 𝑢 is a utility function and 𝑏 is a constraint. Variable 𝑎 and function 𝑏 have arbitrary dimensions. For any optimal decision, in principle, thousands of considerations are relevant to the agent. Since it would be too burdensome to take all of these variables into account, the agent is used to discarding most of them. At the same time, his attention is allocated purposefully to important variables.
(4)
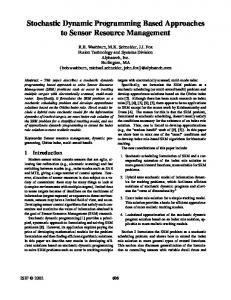
and set the resulting utility to be 𝑢𝑠 = 𝑢(𝑎𝑠 , y). Suppose y is one-dimensional vector; formula (3) can be transformed into 𝑚∗ = min𝑚 (1/2)(𝑚 − 1)2 𝜎2 + 𝜅|𝑚|. Gabaix [23] defines a function 𝐴 to represent the optimal attention vector, namely, 𝑚∗ = 𝐴 𝛽 (𝜎2 /𝜅) = inf[arg min𝑚 (1/2)(𝑚 − 1)2 (𝜎2 /𝜅) + |𝑚|𝛽 ] and points out when 𝛽 = 1, the function 𝐴 𝛽 (𝜎2 /𝜅) satisfies the sparsity and continuity. When 𝛽 = 1 and 𝜅 = 1, we have 𝐴 1 (𝜎2 ) = max(1 − 1/𝜎2 , 0) as shown in Figure 1 [23]. From Figure 1 we know that the agent will not consider the variable when 0 ≤ 𝜎2 ≤ 𝜅 (𝜅 = 1). When the vector y includes more than one variable and these variables perceived by the agent are uncorrelated, we have 𝑚𝑖∗ = 𝐴 1 (𝜎𝑖2 𝑎𝑦2𝑖 |𝑢𝑎𝑎 |/𝜅) through formula (3). To
Discrete Dynamics in Nature and Society
3
A 1 (𝜎2 )
𝜏(s, p)
3
1.2 2
1 0.8
1
0.6 0.4 −3
0.2 0
0
1
2
3
4
5
6
−2
0
−1
0
1
2
3 p
−1
𝜎2
−2
Figure 1: The attention function 𝐴 1 .
−3
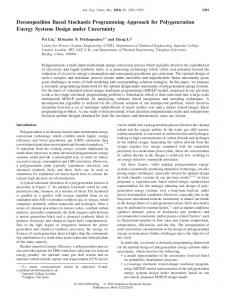
Figure 2: The truncation function 𝜏(𝑠, 𝑝) with 𝑝 = 1.
analyze the agent’s inattention expediently, Gabaix [23] defines the truncation function 𝜏(𝑠, 𝑝) = 𝑠 max(1 − 𝑝2 /𝑠2 , 0), so we have 𝑚𝑖∗ = 𝜏(1, 𝜅𝜎𝑎 /𝑎𝑦𝑖 𝜎𝑖 ). Truncation function has more intuitive economic implications: a one-standarddeviation change of the variable 𝑦𝑖 makes the agent change his action by 𝑎𝑦𝑖 (𝜎𝑖 /𝜎𝑎 ). When 𝑎𝑦𝑖 (𝜎𝑖 /𝜎𝑎 ) is small and satisfies |𝑎𝑦𝑖 (𝜎𝑖 /𝜎𝑎 )| ≤ 𝜅, the agent will not consider this factor. Figure 2 shows the truncation function 𝜏(𝑠, 𝑝) = 𝑠 max(1 − 𝑝2 /𝑠2 , 0) [23]. From Figure 2, we know that the agent who seeks “sparsity” should sensibly drop relatively unimportant features. In addition, if the features are larger than that cutoff, they are still dampened: in Figure 2, 𝜏(𝑠, 𝑝) is below the 45 degree line (for positive 𝑠, in general, |𝜏(𝑠, 𝑝)| < |𝑠|). Based on the analysis above, we can use the truncation function to represent the sparse agent’s optimal action.
where 𝜌 denotes the discount factor, 𝑢 is the utility function, 𝑎 is the decision variable which has an arbitrary dimension, the vector x represents important factors which are always considered by the agent, and the vector y defined in Section 2 represents factors that that may not be considered by the sparse agent. 𝑔(x, y, 𝑎), ℎ(x, y) are the state transition function of x and y, respectively. And 𝜎(x, 𝑎), 𝜎(y) represent the stochastic volatility of x and y, respectively. 𝑑𝑍x , 𝑑𝐵y are independent standard Brownian motions; namely 𝑑𝑍x 𝑑𝐵y = 0. ∞ We define the value function as 𝑉(x, y) = ∫0 𝑒−𝜌𝑡 𝑢(𝑎, x, y)𝑑𝑡.
Remark 2 (see [23]). If rational optimal action is 2 𝑎𝑟 (y) = 𝑎𝑑 + ∑ 𝑎𝑦𝑖 𝑦𝑖 + 𝑜(y)
Assumption 4. All state variables are stochastic and they are independent of each other; stochastic volatility of x is a function of x and 𝑎 while stochastic volatility of y is uncorrelated with 𝑎.
𝑖
(5)
(𝑟 represents the rationality) , which is obtained by the Taylor expansion around the default action 𝑎𝑑 , then the sparse agent’s optimal action is 𝜅𝜎 2 𝑎𝑠 (y) = 𝑎𝑑 + ∑ 𝜏 (𝑎𝑦𝑖 , 𝑎 ) 𝑦𝑖 + 𝑜 (y ) , (6) 𝜎 𝑖 𝑖 where 𝜎𝑎 is the standard deviation of 𝑎.
3. A Stochastic Dynamic Programming Approach Based on Sparse Max Operator In order to effectively deal with stochastic dynamic programming in finance in this section, we extend Gabaix [23] sparse max operator and propose a bounded rational stochastic dynamic programming model in continuous time. The general model of stochastic dynamic programming in continuous time is ∞
−𝜌𝑡
max ∫ 𝑒 0
𝑢 (𝑎, x, y) 𝑑𝑡
𝑑x = 𝑔 (x (𝑡) , y (𝑡) , 𝑎 (𝑡)) 𝑑𝑡 + 𝜎 (x (𝑡) , 𝑎 (𝑡)) 𝑑𝑍x (𝑡) , (7) 𝑑y = ℎ (x (𝑡) , y (𝑡)) 𝑑𝑡 + 𝜎 (y (𝑡)) 𝑑𝐵y (𝑡) ,
Assumption 3. The utility function 𝑢 and value function 𝑉 are 𝑛-order continuously differentiable (𝐶𝑛 , 𝑛 ≥ 3).
Assumption 5. x is one dimensional; that is, only one variable would be always considered by the agent and other variables may not be considered by the agent. Assumption 6. According to Judd and Guu [13], we assume the variance of each component of vector y is small and independent of one another. To facilitate analysis, we use 𝑥 to replace x, denote the stochastic differential equation of 𝑦𝑖 by 𝑑𝑦𝑖 = ℎ𝑖 (𝑥(𝑡), 𝑦𝑖 (𝑡))𝑑𝑡 + 𝜎𝑖 (𝑦𝑖 (𝑡))𝑑𝐵𝑦𝑖 (𝑡), 𝑖 ∈ (1, 2, . . . , 𝑛), and use the notation 𝐷𝑥 [𝑓] = 𝜕𝑥 [𝑓] + 𝑎𝑥 𝜕𝑎 [𝑓] as the total derivative with respect to 𝑥 (i.e., the full impact of a change in 𝑥, including the impact it has on a change in the action 𝑎). Based on Remark 2 in Section 2, we have the following proposition. Proposition 7. The optimal action in bounded rationality model (7) is 𝑎𝑠 (𝑥, y) = 𝑎𝑑 (𝑥) + ∑ 𝜏 (𝑎𝑦𝑖 , 𝑖
𝜅𝜎𝑎 2 ) 𝑦𝑖 + 𝑜 (y ) , 𝜎𝑖
where 𝜎𝑎 is the standard deviation of 𝑎.
(8)
4
Discrete Dynamics in Nature and Society
Proof. See the appendix.
Proof. See the appendix.
From Proposition 7, we know that, in order to derive the optimal action 𝑎𝑠 , we should get the default action 𝑎𝑑 which is related to 𝑥 and 𝑎𝑦𝑖 . The detail process of solving them is described as the following steps, which contain the main results of our method.
Now we can get the optimal action based on the two steps above. By the analysis of Proposition 7, we can see that 𝜏(𝑎𝑦𝑖 , 𝜅𝜎𝑎 /𝜎𝑖 ) represents the impact of variable 𝑦𝑖 on the action 𝑎𝑠 . When 𝑎𝑦𝑖 is smaller than 𝜅𝜎𝑎 /𝜎𝑖 , 𝜏(𝑎𝑦𝑖 , 𝜅𝜎𝑎 /𝜎𝑖 ) = 0 which means the agent will discard this factor.
Step 1. Solve default action 𝑎𝑑 . By substituting y = 0 into the basic model (7), we get the default model:
4. Application: Dynamic Portfolio Choice
∞
max ∫ 𝑒−𝜌𝑡 𝑢 (𝑎, 𝑥, 0) 𝑑𝑡 0
(9)
𝑑𝑥 = 𝑔 (𝑥 (𝑡) , 0, 𝑎 (𝑡)) 𝑑𝑡 + 𝜎 (𝑥 (𝑡) , 𝑎 (𝑡)) 𝑑𝑍𝑥 (𝑡) . This is a general dynamic programming model in continuous time and the state variable is one dimension, so we can get the optimal default action 𝑎𝑑 and the value function 𝑉(𝑥, 0) = ∞ ∫0 𝑒−𝜌𝑡 𝑢(𝑎, 𝑥, 0)𝑑𝑡 easily [26]. Step 2. Solve 𝑎𝑦 𝑖 . The following Proposition 8 and its proof in the appendix show the result and the process of obtaining 𝑎𝑦 𝑖 . Proposition 8. The impact of a change in 𝑦𝑖 on the value function is 𝑉𝑥𝑦𝑖 = (𝐷𝑥 [𝑢𝑎𝑦𝑖 + 𝑔𝑦𝑖 (𝑥, y, 𝑎) 𝑉𝑥 ] 𝑛 1 𝑖 + ∑ ℎ𝑥𝑦 (𝑥, 𝑦𝑖 , 𝑎) 𝑉𝑦𝑖 + 𝜎𝑥2 (𝑥, 𝑎) 𝑓 (𝑥) 𝑉𝑦 𝑖 𝑖 2 𝑖=1
(10)
1 + 𝜎2 (𝑥, 𝑎) 𝑓𝑥 (𝑥) 𝑉𝑦𝑖 ) 2 × (𝜌 −
𝑛
∑ ℎ𝑦𝑖 𝑖 𝑖=1
−1
1 (𝑥, 𝑦𝑖 , 𝑎) − 𝜎2 (𝑥, 𝑎) 𝑓 (𝑥)) , 2
where 𝑉𝑦𝑖 = (𝑢𝑎𝑦𝑖 + 𝑔𝑦𝑖 (𝑥, y, 𝑎) 𝑉𝑥 ) 𝑛
× (𝜌 −
∑ ℎ𝑦𝑖 𝑖 𝑖=1
𝑓 (𝑥) =
𝑉𝑥𝑥 . 𝑉
(11)
0
(13)
s.t. 𝑑𝑤 (𝑡) = 𝑤 (𝑡) (𝑟 + (𝑏 − 𝑟) 𝜃 (𝑡)) 𝑑𝑡 + 𝜃 (𝑡) 𝜎𝑤 (𝑡) 𝑑𝑊 (𝑡) − 𝑐 (𝑡) 𝑑𝑡,
where 𝜌 is the discount factor, 𝑢 is the utility function, 𝑤(𝑡) is the wealth at time 𝑡, 𝜎 is the standard deviation of 𝑤(𝑡), and 𝑐(𝑡) is the consumption at time 𝑡. The investment control 𝜃(𝑡) at time 𝑡 is the fraction of the wealth invested in the risky asset, so (1 − 𝜃(𝑡)) is the fraction of the wealth invested on the riskless asset. 𝑟 is the riskless interest rate and 𝑏 is the risky mean rate of return; 𝑑𝑊 follows standard Brownian motion. We assume the utility function 𝑢(𝑐) = 𝑐(𝑡)1−𝛾 /(1 − 𝛾), where 𝛾 (0 < 𝛾 < 1) is the parameter of risk preference. The goal is to choose consumption 𝑐(𝑡) and investment 𝜃(𝑡) control processes to maximize long-term utility. In model (13), the riskless interest rate 𝑟 and the risky mean rate of return 𝑏 are assumed to be constant [1]. However, this assumption is unrealistic, particularly over long time intervals [27, 28]. Instead, now we assume that these two variables are stochastic and satisfying 𝑟(𝑡) = 𝑟 + 𝑟̂(𝑡), 𝑏(𝑡) = 𝑏 + ̂𝑏(𝑡), where 𝑟, 𝑏 represent the long mean of the riskless interest rate and the risky rate of return, respectively, and 𝑟̂(𝑡), ̂𝑏(𝑡) are their volatile part. 𝑟(𝑡) and 𝑏(𝑡) depend on some “economic factor” 𝜂(𝑡) [24]; namely, (14)
𝑏 (𝑡) = 𝑀 (𝜂 (𝑡)) . 𝑑𝜂 = 𝑔 (𝜂 (𝑡)) 𝑑𝑡 + 𝜎̃ [𝜆𝑑𝑊 (𝑡) + (1 − 𝜆2 )
1 2 𝜙𝑎 = 𝑢𝑎𝑎 + 𝑔𝑎𝑎 (𝑥, y, 𝑎) 𝑉𝑥 + 𝜎𝑎𝑎 (𝑥, 𝑎) 𝐷𝑥 [𝑉𝑥 ] , 2 1 + 𝜎𝑎2 (𝑥, 𝑎) 𝐷𝑥 [𝑉𝑥𝑦𝑖 ] . 2
𝐸 ∫ 𝑒−𝜌𝑡 𝑢 (𝑐 (𝑡)) 𝑑𝑡,
And 𝜂(𝑡) satisfies the stochastic differential formula [24]:
By implicit function theorem, the impact of a change in 𝑦𝑖 on the optimal action is 𝑎𝑦𝑖 = −𝜙𝑦𝑖 /𝜙𝑎 , where
𝜙𝑦𝑖 = 𝑢𝑎𝑦𝑖 + 𝑔𝑎𝑦𝑖 (𝑥, y, 𝑎) 𝑉𝑥 + 𝑔𝑎 (𝑥, y, 𝑎) 𝑉𝑥𝑦𝑖
∞
max
𝑟 (𝑡) = 𝑅 (𝜂 (𝑡)) ,
−1
1 (𝑥, 𝑦𝑖 , 𝑎) − 𝜎2 (𝑥, 𝑎) 𝑓 (𝑥)) , 2
4.1. Merton Portfolio Problem with Stochastic Volatility. In this section, we consider a Merton dynamic portfolio choice problem with stochastic volatility in continuous time [24]. In the traditional version of Merton model [1], the agent’s optimal problem is
(12)
1/2
̃ (𝑡)] , (15) 𝑑𝑊
̃ and 𝑊(𝑡) are independent standard Brownian where 𝑊(𝑡) motions. The parameter 𝜆 with |𝜆| < 1 allows a correlation between the Brownian motion 𝑊(𝑡) driving the short rate and its volatility. 𝜎̃ is the standard deviation of 𝜂. The budget equation of model (13) now becomes 𝑑𝑤 = 𝑤 (𝑡) (𝑟 (𝑡) + (𝑏 (𝑡) − 𝑟 (𝑡)) 𝜃 (𝑡)) 𝑑𝑡 + 𝜃 (𝑡) 𝜎𝑤 (𝑡) 𝑑𝑊 (𝑡) − 𝑐 (𝑡) 𝑑𝑡.
(16)
Discrete Dynamics in Nature and Society
5
We further assume that the stochastic differential equation of 𝑟(𝑡) = 𝜂(𝑡) follows an Ornstein-Uhlenbeck process [25, 29]: 𝑑𝑟 = − 𝜁𝑟 (𝑟 − 𝑟 (𝑡)) 𝑑𝑡 + 𝜎𝑟 [𝜆 𝑟 𝑑𝑊 (𝑡) + (1 − 𝜆2𝑟 )
1/2
𝑑𝑅 (𝑡)] ,
(17)
where 𝜁𝑟 is the degree of mean reversion in expected excess returns, 𝜎𝑟 is the standard deviation of 𝑟(𝑡), 𝑅(𝑡) is a Brownian motion and independent of 𝑊(𝑡), and 𝜆 𝑟 is the coefficient of 𝑤 and 𝑟. To simplify our model, we assume 𝜆 𝑟 = 0 [30]. By substituting 𝑟(𝑡) = 𝑟 + 𝑟̂(𝑡) into (17), we obtain 𝑑(𝑟 + 𝑟̂(𝑡)) = −𝜁𝑟 𝑟̂(𝑡)𝑑𝑡 + 𝜎𝑟 𝑑𝑅(𝑡). Since 𝑑𝑟 = 0, it follows that 𝑑̂𝑟 = −𝜁𝑟 𝑟̂(𝑡)𝑑𝑡 + 𝜎𝑟 𝑑𝑅(𝑡). We assume that 𝑏(𝑡) follows an Ornstein-Uhlenbeck process too, so we obtain 𝑑̂𝑏 = −𝜁𝑏̂𝑏(𝑡)𝑑𝑡 + 𝜎𝑏 𝑑𝐵(𝑡) where 𝜁𝑏 has the same meaning with 𝜁𝑟 . 𝜎𝑏 is the standard deviation of 𝑏(𝑡), and we assume 𝜎𝑟 and 𝜎𝑏 are small [13]. 𝐵(𝑡) is a Brownian motion and independent of 𝑅(𝑡) and 𝑊(𝑡). Then we get the following model: 1−𝛾 −𝜌𝑡 𝑐(𝑡)
∞
s.t.
𝐸∫ 𝑒
𝑑𝑡 1−𝛾 𝑑𝑤 = 𝑤 (𝑡) ((𝑟 (𝑡) + 𝜃 (𝑡) (𝑏 (𝑡) − 𝑟 (𝑡)))) 𝑑𝑡 + 𝜃 (𝑡) 𝜎𝑤 (𝑡) 𝑑𝑊 (𝑡) − 𝑐 (𝑡) 𝑑𝑡, max
0
This is the same Merton model as the model in (13); many scholars have solved this problem [1, 2]. We define the value ∞ function to be 𝑉(𝑤) = ∫0 𝑒−𝜌𝑡 (𝑐(𝑡)1−𝛾 /(1 − 𝛾))𝑑𝑡; then we have [2] 𝑏−𝑟 −1/𝛾 𝑐𝑑 = 𝑤(R (1 − 𝛾)) , 𝜃𝑑 = , 𝛾𝜎2 (22) 𝑤1−𝛾 𝑉 (𝑤) = R , 1−𝛾 where R = [(𝜌 − 𝑟(1 − 𝛾) − (𝑏 − 𝑟)2 (1 − 𝛾)/2𝜎2 𝛾)/𝛾]−𝛾 /(1 − 𝛾). Step 2. Solve 𝑐𝑟̂, 𝑐̂𝑏 , 𝜃𝑟̂, and 𝜃̂𝑏 . Next we will give the results of 𝑐𝑟̂, 𝑐̂𝑏 , 𝜃𝑟̂, and 𝜃̂𝑏 . Proposition 9 shows their expressions, and the proof is the solution process. Proposition 9. Based on the results of (22) and implicit function theorem, we have 𝑐𝑟̂ = −
(18) 𝑐̂𝑏 = −
𝑟 (𝑡) = 𝑟 + 𝑟̂ (𝑡) , 𝑏 (𝑡) = 𝑏 + ̂𝑏 (𝑡) ,
Step 1. Solve the default decision 𝑐𝑑 and 𝜃𝑑 . By substituting 𝑟̂(𝑡) = 0, ̂𝑏(𝑡) = 0 into the basic model (18), we get the default model: max 𝐸 ∫ 𝑒 0
1−𝛾
1−𝛾
𝑑𝑡
𝑑𝑤 = 𝑤 (𝑡) (𝑟 + 𝜃 (𝑡) (𝑏 − 𝑟)) 𝑑𝑡 + 𝜃 (𝑡) 𝜎𝑤 (𝑡) 𝑑𝑊 (𝑡) − 𝑐 (𝑡) 𝑑𝑡.
where
𝑁=
where 𝑐𝑑 and 𝜃𝑑 are the default actions when 𝑟̂(𝑡) = 0, ̂𝑏(𝑡) = 0. 𝜎𝑐 , 𝜎𝜃 are the standard deviation of 𝑐 and 𝜃, respectively. 𝑐𝑟̂, 𝑐̂𝑏 , 𝜃𝑟̂, and 𝜃̂𝑏 are the impact of 𝑟̂ and ̂𝑏 on 𝑐 and 𝜃, respectively. Next we will give the process of solving them using the approach described in Section 3.
−𝜌𝑡 𝑐(𝑡)
𝜃̂𝑏 =
(23)
,
1 . 𝛾𝜎2
(21)
1 − 𝜃𝑑 𝜅𝜎𝑐 1 𝜅𝜎 ) 𝑟̂ + 𝜏 (− , 𝑐 ) ̂𝑏, , 𝑀 𝜎𝑟 𝑁 𝜎𝑏
(24)
𝑑
(1 − 𝛾) 𝑐𝑑 2
,
2
,
(𝜌 + 𝜁𝑟 + (1/2) 𝛾 (1 − 𝛾) 𝜃𝑑 𝜎2 ) 𝛾
(20)
𝑑
∞
1 , 𝛾𝜎2
2 𝛾) 𝜃𝑑 𝜎2 ) 𝛾
1 𝜅𝜎 1 𝜅𝜎 𝜃 = 𝜃 + 𝜏 (− 2 , 𝜃 ) 𝑟̂ + 𝜏 ( 2 , 𝜃 ) ̂𝑏, 𝛾𝜎 𝜎𝑟 𝛾𝜎 𝜎𝑏 𝑠
𝑀=
𝑑
𝜅𝜎 𝜅𝜎 𝜃 = 𝜃 + 𝜏 (𝜃𝑟̂, 𝜃 ) 𝑟̂ + 𝜏 (𝜃̂𝑏 , 𝜃 ) ̂𝑏, 𝜎𝑟 𝜎𝑏
(𝜌 + 𝜁𝑏 + (1/2) 𝛾 (1 −
𝑐𝑠 = 𝑐𝑑 + 𝜏 (−
From Section 3, we know that, for the bounded rational agent, the optimal consumption 𝑐𝑠 and the optimal fraction of wealth allocated to risky market 𝜃𝑠 in model (18) can be expressed as
𝑠
(1 − 𝛾) 𝑐𝑑
,
And the final results of model (18) are
𝑑̂𝑏 = −𝜁𝑏̂𝑏 (𝑡) 𝑑𝑡 + 𝜎𝑏 𝑑𝐵 (𝑡) .
𝜅𝜎 𝜅𝜎 𝑐 = 𝑐 + 𝜏 (𝑐𝑟̂, 𝑐 ) 𝑟̂ + 𝜏 (𝑐̂𝑏 , 𝑐 ) ̂𝑏, 𝜎𝑟 𝜎𝑏
2
(𝜌 + 𝜁𝑟 + (1/2) 𝛾 (1 − 𝛾) 𝜃𝑑 𝜎2 ) 𝛾
𝜃𝑟̂ = −
(19)
𝑑̂𝑟 = −𝜁𝑟 𝑟̂ (𝑡) 𝑑𝑡 + 𝜎𝑟 𝑑𝑅 (𝑡) ,
𝑠
(1 − 𝛾) (1 − 𝜃𝑑 ) 𝑐𝑑
(1 − 𝛾) 𝑐𝑑 (𝜌 + 𝜁𝑢 + (1/2) 𝛾 (1 − 𝛾) 𝜃𝑑 𝜎2 ) 𝛾 −1/𝛾
𝑐𝑑 = 𝑤(R (1 − 𝛾))
(25)
, −𝛾
R= 𝜃𝑑 =
[(𝜌 − 𝑟 (1 − 𝛾) − (𝑏 − 𝑟)2 (1 − 𝛾)/2𝜎2 𝛾) /𝛾] (1 − 𝛾)
,
𝑏−𝑟 . 𝛾𝜎2
Proof. See the appendix. Proposition 9 makes predictions about the sparse agent’s choice. When 𝜅 = 0, the agent is the traditional, perfectly rational agent. And when 𝜅 > 0, it is a policy of a sparse agent. Larger 𝜅 indicates that the agent is less sensitive to fluctuations of both the riskless interest rate and the risky mean rate of return.
6
Discrete Dynamics in Nature and Society
−1.8 −1.85 −1.9 −1.95 −2 −2.05 −2.1 −2.15 −2.2
crs
cbs
−4.76 −4.78 −4.8 −4.82 −4.84 −4.86 −4.88
0
0.1
0.2
0.3
0.4
0.5
0.6
0.7
0.8
0.9
1 𝜅
−4.9
0
0.1
0.2
0.3
0.4
(a)
0.5
0.6
0.7
0.8
0.9
1 𝜅
(b)
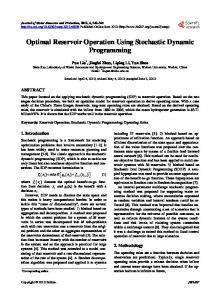
Figure 3: (a) Impact of a change in 𝑟̂ on 𝑐𝑠 with 𝜎𝑟 = 1.5, 𝜎𝑏 = 1.7. (b) Impact of a change in ̂𝑏 on 𝑐𝑠 with 𝜎𝑟 = 1.5, 𝜎𝑏 = 1.7. 𝜃sr
0
𝜃sb
0.4 0.35
−0.05 −0.1
0.3
−0.15
0.25
−0.2
0.2
−0.25
0.15
−0.3
0.1
−0.35
0.05
0
0.1
0.2
0.3
0.4
0.5
0.6
0.7
0.8
0.9
1 𝜅
(a)
0
0.1
0.2
0.3
0.4
0.5
0.6
0.7
0.8
0.9
1 𝜅
(b)
Figure 4: (a) Impact of a change in 𝑟̂ on 𝜃𝑠 with 𝜎𝑟 = 1.5, 𝜎𝑏 = 1.7. (b) Impact of a change in ̂𝑏 on 𝜃𝑠 with 𝜎𝑟 = 1.5, 𝜎𝑏 = 1.7.
4.2. Numerical Example. The purpose of this numerical analysis is to intuitively understand how the boundedly rational agent changes its decisions with the changing of the variances of factors. Firstly, we set 𝑐𝑟̂𝑠 = 𝜏(−(1 − 𝜃𝑑 )/𝑀, 𝜅𝜎𝑐 /𝜎𝑟 ), 𝑐̂𝑏𝑠 = 𝜏(−1/𝑁, 𝜅𝜎𝑐 /𝜎𝑏 ), 𝜃𝑟̂𝑠 = 𝜏(−1/𝛾𝜎2 , 𝜅𝜎𝜃 /𝜎𝑟 ), and 𝜃̂𝑏𝑠 = 𝜏(1/𝛾𝜎2 , 𝜅𝜎𝜃 /𝜎𝑏 ). Let 𝛾 = 0.6, 𝜎 = 2.2, 𝜎𝑟 = 1.5, 𝜎𝑏 = 1.7, 𝜎𝜃 = 0.5, 𝜎𝑐 = 1.3, 𝑏 = 3.2, 𝑟 = 18, 𝜌 = 0.95, 𝜁𝑟 = 0.2, 𝜁𝑏 = 0.4, and 𝑤 = 5; then we have 𝑐𝑟̂𝑠 , 𝑐̂𝑏𝑠 as shown in Figures 3 and 4. In these figures, the horizontal axis 𝜅 is an index of bounded rationality and 𝜅 ∈ [0, 1] which is also applied to Figures 5 and 6. From Figure 3, we know that whatever 𝜅 is, |𝑐𝑟̂𝑠 | > 0 and |𝑐̂𝑏𝑠 | > 0, which means when the variances of 𝑟̂ and ̂𝑏 are big, the agent will consider them in the process of making a decision. Figure 3(a) shows that if 𝜅 = 0, then the agent reacts like the rational agent: when 𝑟̂ goes up by 1%, 𝑐𝑟̂𝑠 will fall by −2.19% (the agent saves more). For 𝜅 = 1, if 𝑟̂ goes up by 1%, 𝑐𝑟̂𝑠 falls by −1.85%. This result indicates that the greater the cognitive cost about the factor is, the less attention will be paid to this factor by the boundedly rational agent. From Figure 3(b), we can reach a similar conclusion. Figure 4 also shows the agent will always consider 𝑟̂ and ̂𝑏, that is, |𝜃𝑠 | > 0 and |𝜃𝑠 | > 0, whatever 𝜅 is. It addition, ̂𝑏 𝑟̂ we can obtain that if 𝜅 = 0, 𝜃𝑟̂𝑠 = −0.34% and 𝜃̂𝑏𝑠 = 0.34%, which means the rational agent has the same sensitivity about the 𝑟̂ and ̂𝑏 when deciding 𝜃𝑠 . With the increasing of 𝜅, the absolute values of 𝜃𝑟̂𝑠 and 𝜃̂𝑏𝑠 both will decrease, which means
that the agent will pay less attention to them. In other words, the impact of 𝑟̂ and ̂𝑏 on 𝜃𝑠 will decrease for the increasing cognitive cost. Next, we assume that the standard deviation of riskless interest rate and the risky mean rate of return is smaller, 𝜎𝑟 = 0.15, 𝜎𝑏 = 0.25. By keeping other parameters fixed, we get results shown in Figures 5 and 6. Figure 5(a) shows that when 𝜅 ≥ 0.26, 𝑐𝑟̂𝑠 = 0 which means that if the fluctuation is small the agent may discard 𝑟̂ when he decides the optimal consumption. We can get a similar conclusion from Figure 5(b): when 𝜅 ≥ 0.95, 𝑐𝑟̂𝑠 = 0 with 𝜎𝑏 = 0.25. From Figure 5(a), we know that if 𝜅 = 0, 𝑐𝑟̂𝑠 = −2.19% while Figure 3(a) also shows if 𝜅 = 0, 𝑐𝑟̂𝑠 = −2.19% which means, for the rational agent, the sensitivity of 𝑐𝑠 to 𝑟̂ has nothing to do with 𝑟̂’s variance. However, the boundedly rational agents have different reactions to 𝑟̂ as 𝜅 increases, such as when 𝜅 = 0.26, 𝑐𝑟̂𝑠 = 0 with 𝜎𝑟 = 0.15 in Figure 5(a) while 𝑐𝑟̂𝑠 = −2.1% with 𝜎𝑟 = 1.5 in Figure 3(a). This disparity indicates that when the cognitive costs are the same and 𝜅 > 0, that is, the agents have the same boundedly rational degree, more volatile factors will be considered while the factor with smaller variance may be neglected. Additionally, we can know that when 0.26 ≤ 𝜅 < 0.95, the agent does not react to 𝑟̂, namely, 𝑐𝑟̂𝑠 = 0 (in Figure 5(a)), but will react to a change in ̂𝑏 (in Figure 5(b)), which is more important: the sensitivity of 𝑐𝑠 to ̂𝑏 remains high even for a high cognitive friction 𝜅. Note that this “feature by feature”
Discrete Dynamics in Nature and Society
7
crs
0 −0.5 −1 −1.5 −2 −2.5
0
0.1
0.2
0.3
0.4
0.5
0.6
0.7
0.8
0.9
1 𝜅
0 −0.5 −1 −1.5 −2 −2.5 −3 −3.5 −4 −4.5 −5
cbs
0
0.1
0.2
0.3
0.4
(a)
0.5
0.6
0.7
0.8
0.9
1 𝜅
(b)
Figure 5: (a) Impact of a change in 𝑟̂ on 𝑐𝑠 with 𝜎𝑟 = 0.15, 𝜎𝑏 = 0.25. (b) Impact of a change in ̂𝑏 on 𝑐𝑠 with 𝜎𝑟 = 0.15, 𝜎𝑏 = 0.25. 𝜃sr
0 −0.05
0.3
−0.1
0.25
−0.15
0.2
−0.2
0.15
−0.25
0.1
−0.3
0.05
−0.35
0
𝜃sb
0.35
0.1
0.2
0.3
0.4
0.5
0.6
0.7
0.8
0.9
1
𝜅
0
0
0.1
0.2
0.3
0.4
0.5
(a)
0.6
0.7
0.8
0.9
1
𝜅
(b)
Figure 6: (a) Impact of a change in 𝑟̂ on 𝜃𝑠 with 𝜎𝑟 = 0.15, 𝜎𝑏 = 0.25. (b) Impact of a change in ̂𝑏 on 𝜃𝑠 with 𝜎𝑟 = 0.15, 𝜎𝑏 = 0.25.
selective attention could not be rationalized by just a fixed cost to consumption, which is not feature dependent. But when 𝜅 ≥ 0.95, 𝑐𝑟̂𝑠 = 𝑐̂𝑏𝑠 = 0, which indicates that the agent will pay no attention to both 𝑟̂ and ̂𝑏 once their thinking costs are beyond some thresholds. Considering Figure 6(a), we can see that when 𝜅 ≥ 0.11, 𝜃𝑟̂𝑠 = 0, while Figure 4(a) shows whatever 𝜅 is, 𝜃𝑟̂𝑠 > 0 with 𝜎𝑟 = 1.5 which means the smaller the variance of a factor is, the more likely the agent will ignore it. From Figure 6(b), we can also obtain the same conclusion.
5. Conclusion Dynamic portfolio choice is an important but complex problem in modern financial field, but extant methods always generate complicated numerical calculations due to numerous state variables. Hence, to address this problem, this paper extends the sparse max operator proposed by Gabaix [23] and proposes a new approach to deal with dynamic programming under stochastic terms under the assumption of the agent’s limited attention. We apply this method to Merton dynamic portfolio choice problem and find that it effectively simplifies the model’s solution process and avoids the “Curse of Dimensionality.” Finally, numerical example shows that this method has significant economic implications and clearly interprets the agent’s economic behavior when he makes a portfolio choice. Our study can be extended in several directions. Future research should consider the condition when the stochastic
factors are correlated with each other for it is more realistic. Besides, information faced by the agent is always imprecise and incomplete, and the fuzzy set theory is an important approach to deal with this kind of problem [31–33]. Hence, using fuzzy set theory to handle imprecise values in dynamic programming may be another direction for further research.
Appendix Proof of Proposition 7. Based on model (7), we define value function 𝑈∗ (𝑎, 𝑥, y) = 𝑢 (𝑎, 𝑥, y) + 𝑔 (𝑥, y, 𝑎) 𝑉𝑥 𝑛 1 + ∑ ℎ𝑖 (𝑥, 𝑦𝑖 ) 𝑉𝑦𝑖 + 𝜎2 (𝑥, 𝑎) 𝑉𝑥𝑥 2 𝑖=1 𝑛 2 1 + ∑ (𝜎𝑖 (𝑦𝑖 (𝑡))) 𝑉𝑦𝑖 𝑦𝑖 2 𝑖=1 𝑛
+ ∑ 𝜎 (𝑥, 𝑎) 𝜎𝑖 (𝑦𝑖 (𝑡)) 𝜌𝑥𝑦𝑖 𝑉𝑥𝑦𝑖 𝑖=1
+
𝑛
∑ 𝜎𝑖 (𝑦𝑖 (𝑡)) 𝜎𝑗 (𝑦𝑗 (𝑡)) 𝜌𝑖𝑗 𝑉𝑦𝑖 𝑦𝑗 . 𝑖,𝑗=1(𝑖 ≠ 𝑗) (A.1)
For 𝑑𝑍𝑥 𝑑𝐵y = 0, we have 𝜌𝑥𝑦𝑖 = 0, 𝜌𝑦𝑖 𝑦𝑗 = 0 where 𝜌𝑥𝑦𝑖 , 𝜌𝑦𝑖 𝑦𝑗 represent coefficient between 𝑥 and 𝑦𝑖 , 𝑦𝑖 , and 𝑦𝑗 , respectively.
8
Discrete Dynamics in Nature and Society
Besides, the volatility of a variable that may not be considered by the agent is assumed to be small in Assumption 6; that is, 𝜎𝑖 (𝑦𝑖 (𝑡)) = 0; so we have ∗
𝑈 (𝑎, 𝑥, y) = 𝑢 (𝑎, 𝑥, y) + 𝑔 (𝑥, y, 𝑎) 𝑉𝑥 𝑛
1 + ∑ ℎ (𝑥, 𝑦𝑖 ) 𝑉𝑦𝑖 + 𝜎2 (𝑥, 𝑎) 𝑉𝑥𝑥 . 2 𝑖=1 𝑖
(A.2)
1 + 𝜎𝑎2 (𝑥, 𝑎) 𝐷𝑥 [𝑉𝑥𝑦𝑖 ] , 2
1 𝑠 . 𝑈𝑎∗∗ = 𝑢𝑎 + 𝑔𝑎 (𝑥, y, 𝑎) 𝑉𝑥𝑠 + 𝜎𝑎2 (𝑥, 𝑎) 𝑉𝑥𝑥 2
𝑛 1 𝑠 + ∑ ℎ𝑖 (𝑥, 𝑦𝑖 ) 𝑉𝑦𝑠𝑖 + 𝜎2 (𝑥, 𝑎) 𝑉𝑥𝑥 2 𝑖=1 2 1 + ∑ (𝜎𝑖 (𝑦𝑖 (𝑡))) 𝑉𝑦𝑠𝑖 𝑦𝑖 2 𝑖=1
∗∗ 𝑠 = 𝑢𝑎𝑦𝑖 + 𝑔𝑎𝑦𝑖 (𝑥, y, 𝑎) 𝑉𝑠𝑥 + 𝑔𝑎 (𝑥, y, 𝑎) 𝑉𝑥𝑦 𝑈𝑎𝑦 𝑖 𝑖
𝑛
1 𝑠 + 𝜎𝑎2 (𝑥, 𝑎) 𝐷𝑥 [𝑉𝑥𝑦 ], 𝑖 2
𝑠 + ∑ 𝜎 (𝑥, 𝑎) 𝜎𝑖 (𝑦𝑖 (𝑡)) 𝜌𝑥𝑦𝑖 𝑉𝑥𝑦 𝑖 𝑖=1
𝑛
∑ 𝜎𝑖 (𝑦𝑖 (𝑡)) 𝜎𝑗 (𝑦𝑗 (𝑡)) 𝜌𝑖𝑗 𝑉𝑦𝑠𝑖 𝑦𝑗 . 𝑖,𝑗=1(𝑖 ≠ 𝑗) (A.3)
From the analysis above, we have 𝑈∗∗ (𝑎, 𝑥, y) = 𝑢 (𝑎, 𝑥, y) + 𝑔 (𝑥, y, 𝑎) 𝑉𝑥𝑠 (A.4)
∗ ∗∗ ∗ ∗∗ Hence, we have 𝑈𝑎𝑦 = 𝑈𝑎𝑦 at 𝑦𝑖 = 0 and 𝑈𝑎𝑎 = 𝑈𝑎𝑎 at 𝑖 𝑖 𝑦𝑖 = 0. So ∗∗ 𝑈𝑎𝑦 𝜕𝑎∗∗ (𝑥, y) 𝑖 𝑦𝑖 =0 =− ∗∗ 𝜕𝑦𝑖 𝑈𝑎𝑎 𝑦𝑖 =0
=−
𝑎∗ (𝑥, y) = arg max 𝑈∗ (𝑎, 𝑥, y) , (A.5)
𝑎
∗
0.
First, we will prove 𝜕𝑎 (𝑥, y)/𝜕𝑦𝑖 = 𝜕𝑎∗∗ (𝑥, y)/𝜕𝑦𝑖 at y =
From the proof of lemma 1 in Gabaix [23], we know that 𝑉𝑠 (𝑥, y) = 𝑉(𝑥, y) + 𝑥𝜋(𝑥, y)𝑥 where 𝜋(𝑥, y) is continuous in (𝑥, y) and twice differentiable at y = 0, with 𝜋(𝑥, 0) negative semidefinite. In other word, the 𝑉𝑠 (𝑥, y) and 𝑉𝑠 (𝑥, y) = 𝑥𝜋(𝑥, y)𝑥 differ only by second-order terms in 𝑥. This basically generalizes the envelope theorem. It implies that at y = 0, we have 𝑉𝑥 (𝑥, 0) = 𝑉𝑥𝑠 (𝑥, 0) , 𝑉𝑦𝑖 (𝑥, y)𝑦 =0 = 𝑉𝑦𝑠𝑖 (𝑥, y) , 𝑦𝑖 =0 𝑖 𝑠 (𝑥, y) . 𝑉𝑥𝑦𝑖 (𝑥, y)𝑦 =0 = 𝑉𝑥𝑦 𝑖 𝑦𝑖 =0 𝑖 1 = 𝑢𝑎 + 𝑔𝑎 (𝑥, y, 𝑎) 𝑉𝑥 + 𝜎𝑎2 (𝑥, 𝑎) 𝑉𝑥𝑥 . 2
∗ 𝑈𝑎𝑎
𝜕𝑎 (𝑥, y) . = 𝜕𝑦𝑖 𝑦𝑖 =0
(A.11)
∗
Given 𝑎𝑟 (𝑥, y) = 𝑎𝑑 (𝑥) + ∑𝑖 𝑎𝑦𝑖 𝑦𝑖 + 𝑜(‖y‖2 ), we have 𝜕𝑎𝑟 (𝑥, y)/𝜕𝑦𝑖 = 𝑎𝑦𝑖 . According to (A.11), we obtain 𝜕𝑎∗∗ (𝑥, y)/𝜕𝑦𝑖 = 𝑎𝑦𝑖 , so 𝑎∗∗ (𝑥, y) = 𝑎𝑑 (𝑥) + ∑𝑖 𝑎𝑦𝑖 𝑦𝑖 + 𝑜(‖y‖2 ). Finally 𝑇
𝑎𝑠 (𝑥, y) = 𝑎 (𝑥, m∗ y) = 𝑎𝑑 (𝑥) 2 + ∑ 𝑎𝑦𝑖 𝑚𝑖∗ 𝑦𝑖 + 𝑜 (y ) 𝑖
= 𝑎𝑑 (𝑥) + ∑ 𝑎𝑦𝑖 𝐴 1 ( 𝑖
𝑖
(A.6)
Λ 𝑖𝑖 2 ) 𝑦𝑖 + 𝑜 (y ) 𝜅
(A.12)
𝜅𝜎𝑎 2 ) 𝑦𝑖 + 𝑜 (y ) , 𝜎𝑖
where 𝜎𝑎 is the standard deviation of 𝑎. Proof of Proposition 8. The laws of motion of model (7) are
Differentiating formula (A.2) with respect to 𝑎 gives 𝑈𝑎∗
∗ 𝑈𝑎𝑦 𝑖 𝑦𝑖 =0
= 𝑎𝑑 (𝑥) + ∑ 𝜏 (𝑎𝑦𝑖 ,
𝑠 𝑉𝑥𝑥 (𝑥, 0) = 𝑉𝑥𝑥 (𝑥, 0) ,
(A.10)
1 2 ∗ 𝑠 𝑈𝑎𝑎 = 𝑢𝑎𝑎 + 𝑔𝑎𝑎 (𝑥, y, 𝑎) 𝑉𝑥𝑠 + 𝜎𝑎𝑎 . (𝑥, 𝑎) 𝑉𝑥𝑥 2
Then the associated optimal actions can expressed as
𝑎∗∗ (𝑥, y) = arg max 𝑈∗∗ (𝑎, 𝑥, y) .
(A.9)
Differentiating formula (A.9) with respect to 𝑦𝑖 and 𝑎, respectively, gives
𝑛
𝑎
(A.8)
Similarly, differentiating formula (A.4) with respect to 𝑎 gives
𝑈∗∗ (𝑎, 𝑥, y) = 𝑢 (𝑎, 𝑥, y) + 𝑔 (𝑥, y, 𝑎) 𝑉𝑥𝑠
𝑛 1 𝑠 + ∑ ℎ𝑖 (𝑥, 𝑦𝑖 ) 𝑉𝑦𝑠𝑖 + 𝜎2 (𝑥, 𝑎) 𝑉𝑥𝑥 . 2 𝑖=1
∗ = 𝑢𝑎𝑦𝑖 + 𝑔𝑎𝑦𝑖 (𝑥, y, 𝑎) 𝑉𝑥 + 𝑔𝑎 (𝑥, y, 𝑎) 𝑉𝑥𝑦𝑖 𝑈𝑎𝑦 𝑖
1 2 ∗ 𝑈𝑎𝑎 = 𝑢𝑎𝑎 + 𝑔𝑎𝑎 (𝑥, y, 𝑎) 𝑉𝑥 + 𝜎𝑎𝑎 (𝑥, 𝑎) 𝑉𝑥𝑥 . 2
Similarly, we define
+
Differentiating formula (A.7) with respect to 𝑦𝑖 and 𝑎, respectively, we get
(A.7)
𝑑𝑥 = 𝑔 (𝑥 (𝑡) , y (𝑡) , 𝑎 (𝑡)) 𝑑𝑡 + 𝜎 (𝑥 (𝑡) , 𝑎 (𝑡)) 𝑑𝑍𝑥 (𝑡) 𝑑𝑦𝑖 = ℎ𝑖 (𝑥 (𝑡) , 𝑦𝑖 (𝑡)) 𝑑𝑡 + 𝜎𝑖 (𝑦𝑖 (𝑡)) 𝑑𝐵𝑦𝑖 (𝑡) , (A.13)
Discrete Dynamics in Nature and Society
9
where y = (𝑦1 , 𝑦2 , . . . , 𝑦𝑛 ). Using Ito formula, Bellman’s equation of model (7) can be expressed as follows: 𝜌𝑉 = max 𝑢 (𝑎, 𝑥, y) + 𝑔 (𝑥, y, 𝑎) 𝑉𝑥
And from (A.18) we obtain 𝑉𝑥𝑦𝑖 = (𝐷𝑥 [𝑢𝑎𝑦𝑖 + 𝑔𝑦𝑖 (𝑥, y, 𝑎) 𝑉𝑥 ]
𝑎
𝑛
𝑛 1 𝑖 + ∑ ℎ𝑥𝑦 (𝑥, 𝑦𝑖 , 𝑎) 𝑉𝑦𝑖 + 𝜎𝑥2 (𝑥, 𝑎) 𝑓 (𝑥) 𝑉𝑦𝑖 𝑖 2 𝑖=1
1 + ∑ ℎ (𝑥, 𝑦𝑖 ) 𝑉𝑦𝑖 + 𝜎2 (𝑥, 𝑎) 𝑉𝑥𝑥 2 𝑖=1 𝑖
1 + 𝜎2 (𝑥, 𝑎) 𝑓𝑥 (𝑥) 𝑉𝑦𝑖 ) 2
𝑛
2 1 + ∑ (𝜎𝑖 (𝑦𝑖 (𝑡))) 𝑉𝑦𝑖 𝑦𝑖 2 𝑖=1
(A.14)
−1
𝑛 1 × (𝜌 − ∑ ℎ𝑦𝑖 𝑖 (𝑥, 𝑦𝑖 , 𝑎) − 𝜎2 (𝑥, 𝑎) 𝑓 (𝑥)) . 2 𝑖=1 (A.19)
𝑛
+ ∑ 𝜎 (𝑥, 𝑎) 𝜎𝑖 (𝑦𝑖 (𝑡)) 𝜌𝑥𝑦𝑖 𝑉𝑥𝑦𝑖 𝑖=1
+
𝑛
∑ 𝜎𝑖 (𝑦𝑖 (𝑡)) 𝜎𝑗 (𝑦𝑗 (𝑡)) 𝜌𝑦𝑖 𝑦𝑗 𝑉𝑦𝑖 𝑦𝑗 . 𝑖,𝑗=1(𝑖 ≠ 𝑗)
From the proof of Proposition 7 above, we have 𝜌𝑥𝑦𝑖 = 0, 𝜌𝑦𝑖 𝑦𝑗 = 0, and 𝜎𝑖 (𝑦𝑖 (𝑡)) = 0. So we obtain 𝜌𝑉 = max 𝑢 (𝑎, 𝑥, y) + 𝑔 (𝑥, y, 𝑎) 𝑉𝑥
According to formula (A.16), we know that the impact of 𝑦𝑖 on the optimal action can be expressed as 𝑎𝑦𝑖 = −𝜙𝑦𝑖 /𝜙𝑎 , where 1 2 𝜙𝑎 = 𝑢𝑎𝑎 + 𝑔𝑎𝑎 (𝑥, y, 𝑎) 𝑉𝑥 + 𝜎𝑎𝑎 (𝑥, 𝑎) 𝐷𝑥 [𝑉𝑥 ] , 2 𝜙𝑦𝑖 = 𝑢𝑎𝑦𝑖 + 𝑔𝑎𝑦𝑖 (𝑥, y, 𝑎) 𝑉𝑥 + 𝑔𝑎 (𝑥, y, 𝑎) 𝑉𝑥𝑦𝑖 1 + 𝜎𝑎2 (𝑥, 𝑎) 𝐷𝑥 [𝑉𝑥𝑦𝑖 ] . 2
𝑎
𝑛 1 + ∑ ℎ𝑖 (𝑥, 𝑦𝑖 ) 𝑉𝑦𝑖 + 𝜎2 (𝑥, 𝑎) 𝑉𝑥𝑥 . 2 𝑖=1
(A.15)
We define function 𝜙(𝑥, y, 𝑎) as the derivative of the right side in formula (A.15) with respect to 𝑎, so 𝑎 satisfies 𝜙 = 0 with 1 𝜙 (𝑥, y, 𝑎) = 𝑢𝑎 + 𝑔𝑎 (𝑥, y, 𝑎) 𝑉𝑥 + 𝜎𝑎2 (𝑥, 𝑎) 𝑉𝑥𝑥 , 2
(A.16)
and we define 𝑓(𝑥) = 𝑉𝑥𝑥 /𝑉, where 𝑓(𝑥) can be derived from ∞ the expression of 𝑉(𝑥, 0) = ∫0 𝑒−𝜌𝑡 𝑢(𝑎, 𝑥, 0)𝑑𝑡 in Step 1 of Section 3. Hence, differentiating formula (A.15) with respect to 𝑦𝑖 gives 𝜌𝑉𝑦𝑖 = 𝑢𝑎𝑦𝑖 + 𝑔𝑦𝑖 (𝑥, y, 𝑎) 𝑉𝑥 𝑛
1 + ∑ ℎ𝑦𝑖 𝑖 (𝑥, 𝑦𝑖 , 𝑎) 𝑉𝑦𝑖 + 𝜎2 (𝑥, 𝑎) 𝑓 (𝑥) 𝑉𝑦𝑖 . 2 𝑖=1
(A.17)
Now we differentiate at y = 0 and evaluate at (𝑎, 𝑥, y) = (𝑎𝑑 , 𝑥, 0):
+
𝑖 ∑ ℎ𝑥𝑦 𝑖 𝑖=1
(𝑥, 𝑦𝑖 , 𝑎) 𝑉𝑦𝑖 +
𝑛
∑ ℎ𝑦𝑖 𝑖 𝑖=1
Proof of Proposition 9. Using Ito formula, Bellman’s formula of model (18) is 𝑢 (𝑐) 𝜌𝑉 = max 𝑐 + [𝑤 (1 − 𝜃) (𝑟 + 𝑟̂) + 𝑤𝜃 (𝑏 + ̂𝑏) − 𝑐] 𝑉𝑤 + (−𝜁𝑟 𝑟̂) 𝑉𝑟̂ + (−𝜁𝑏̂𝑏) 𝑉̂𝑏
(A.21)
1 1 1 + (𝜃𝜎𝑤)2 𝑉𝑤𝑤 + 𝜎𝑟2 𝑉𝑟̂𝑟̂ + 𝜎𝑏2 𝑉̂𝑏̂𝑏 2 2 2 + 𝜎𝜎𝑟 𝜌𝑤𝑟 𝑉𝑤𝑟 + 𝜎𝜎𝑏 𝜌𝑤𝑏 𝑉𝑤𝑏 + 𝜎𝑟 𝜎𝑏 𝜌𝑟𝑏 𝑉𝑟𝑏 , where 𝜌𝑤𝑟 , 𝜌𝑤𝑏 , and 𝜌𝑏𝑟 represent the coefficient between 𝑤 and 𝑟, 𝑤 and 𝑏, and 𝑏 and 𝑟, respectively. For 𝑑𝑊𝑑𝑅 = 0, 𝑑𝑊𝑑𝐵 = 0, and 𝑑𝑅𝑑𝐵 = 0, we have 𝜌𝑤𝑟 = 0, 𝜌𝑤𝑏 = 0, and 𝜌𝑏𝑟 = 0. According to Assumption 6, the variances of 𝑟 and 𝑏 are so small that we let 𝜎𝑟 = 𝜎𝑏 = 0. Then formula (A.21) becomes as follows: 𝜌𝑉 = max 𝑢 (𝑐) + [𝑤 (1 − 𝜃) (𝑟 + 𝑟̂) + 𝑤𝜃 (𝑏 + ̂𝑏) − 𝑐] 𝑉𝑤 𝑐
𝜌𝑉𝑥𝑦𝑖 = 𝐷𝑥 [𝑢𝑎𝑦𝑖 + 𝑔𝑦𝑖 (𝑥, y, 𝑎) 𝑉𝑥 ] 𝑛
(A.20)
1 + (−𝜁𝑟 𝑟̂) 𝑉𝑟̂ + (−𝜁𝑏̂𝑏) 𝑉̂𝑏 + (𝜃𝜎𝑤)2 𝑉𝑤𝑤 . 2
(𝑥, 𝑦𝑖 , 𝑎) 𝑉𝑥𝑦𝑖
1 + 𝜎𝑥2 (𝑥, 𝑎) 𝑓 (𝑥) 𝑉𝑦 𝑖 2
(A.18)
1 + 𝜎2 (𝑥, 𝑎) (𝑓𝑥 (𝑥) 𝑉𝑦𝑖 + 𝑓 (𝑥) 𝑉𝑥𝑦𝑖 ) . 2 From (A.17) we get 𝑉𝑦𝑖 = (𝑢𝑎𝑦𝑖 + 𝑔𝑦𝑖 (𝑥, y, 𝑎)𝑉𝑥 )/(𝜌 − ∑𝑛𝑖=1 ℎ𝑦𝑖 𝑖 (𝑥, 𝑦𝑖 , 𝑎) − (1/2)𝜎2 (𝑥, 𝑎)𝑓(𝑥)).
(A.22)
Differentiating formula (A.22) with respect to 𝑟̂ and evaluating at (̂𝑟, ̂𝑏) = (0, 0), we obtain 𝜌𝑉𝑟̂ = 𝑤(1 − 𝜃)𝑉𝑤 + (−𝜁𝑟 )𝑉𝑟̂ + (1/2)(𝜃𝜎𝑤)2 (𝜕𝑉𝑤𝑤 /𝜕̂𝑟) where 𝑉𝑤𝑤 = ((1 − 𝛾)(−𝛾)/𝑤2 )𝑉 which can be obtained from (22); then 𝜌𝑉𝑟̂ = 𝑤 (1 − 𝜃) 𝑉𝑤 + (−𝜁𝑟 ) 𝑉𝑟̂ +
1 (1 − 𝛾) (−𝛾) 𝜃2 𝜎2 𝑉𝑟̂. 2 (A.23)
10
Discrete Dynamics in Nature and Society
Now differentiating (using the total derivative) formula (A.23) with respect to 𝑤 and evaluating at (̂𝑟, ̂𝑏) = (0, 0), we obtain
where 𝑀=
𝜌𝑉𝑤̂𝑟 = (1 − 𝜃) 𝑉𝑤 + 𝑤 (1 − 𝜃) 𝑉𝑤𝑤 1 + (−𝜁𝑟 ) 𝑉𝑤̂𝑟 + (1 − 𝛾) (−𝛾) 𝜃2 𝜎2 𝑉𝑤̂𝑟. 2
(A.24)
𝑤 (1 − 𝜃) 𝑉𝑤 . 𝜌 + 𝜁𝑟 + (1/2) 𝛾 (1 − 𝛾) 𝜃2 𝜎2
(1 − 𝛾) (1 − 𝜃) 𝑉𝑤 . 𝜌 + 𝜁𝑟 + (1/2) 𝛾 (1 − 𝛾) 𝜃2 𝜎2
(A.25)
𝜙𝑟̂ , 𝜙𝑐
(A.27)
𝜙𝑐 = 𝑢𝑐𝑐 , (A.28)
𝜕𝑐 − 𝑉𝑤̂𝑟. 𝜕̂𝑟
Since all derivatives are evaluated at (̂𝑟, ̂𝑏) = (0, 0), we have 𝑐 = 𝑐𝑑 , 𝜃 = 𝜃𝑑 . By substituting (A.28) into (A.27) and using the results of (22), (A.25), (A.26), now we can get 𝑐𝑟̂ = −
(1 − 𝛾) (1 − 𝜃𝑑 ) 𝑐𝑑 2
.
(A.29)
2
,
(A.30)
(𝜌 + 𝜁𝑟 + (1/2) 𝛾 (1 − 𝛾) 𝜃𝑑 𝜎2 ) 𝛾
Similarly, we have 𝑐̂𝑏 = −
(1 − 𝛾) 𝑐𝑑 (𝜌 + 𝜁𝑏 + (1/2) 𝛾 (1 − 𝛾) 𝜃𝑑 𝜎2 ) 𝛾
where the concrete expressions of 𝑐𝑑 , 𝜃𝑑 are referred to formula (22). 𝜃𝑟̂, 𝜃̂𝑏 can be solved in an analogous way as 𝜃𝑟̂ = −1/𝛾𝜎2 , 𝜃̂𝑏 = 1/𝛾𝜎2 . According to Proposition 7, 𝑐𝑠 and 𝜃𝑠 can expressed as 𝑐𝑠 = 𝑐𝑑 + 𝜏 (−
1 − 𝜃𝑑 𝜅𝜎𝑐 1 𝜅𝜎 ) 𝑟̂ + 𝜏 (− , 𝑐 ) ̂𝑏, , 𝑀 𝜎𝑟 𝑁 𝜎𝑏
1 𝜅𝜎 1 𝜅𝜎 𝜃 = 𝜃 + 𝜏 (− 2 , 𝜃 ) 𝑟̂ + 𝜏 ( 2 , 𝜃 ) ̂𝑏, 𝛾𝜎 𝜎𝑟 𝛾𝜎 𝜎𝑏 𝑠
𝑑
2
(𝜌 + 𝜁𝑢 + (1/2) 𝛾 (1 − 𝛾) 𝜃𝑑 𝜎2 ) 𝛾
2
R= 𝜃𝑑 =
−𝛾
[(𝜌 − 𝑟 (1 − 𝛾) − (𝑏 − 𝑟) (1 − 𝛾) /2𝜎2 𝛾) /𝛾] (1 − 𝛾)
,
𝑏−𝑟 . 𝛾𝜎2 (A.32)
Conflict of Interests The authors declare that there is no conflict of interests regarding the publication of this paper.
Acknowledgments This research is supported by National Natural Science Foundation of China (Grant nos. 71371191, 71210003, and 712221061).
where
𝜙𝑟̂ = 𝑢𝑐𝑐
(1 − 𝛾) 𝑐𝑑
(A.26)
Let 𝜙(𝑐, 𝜃, 𝑤, 𝑟̂, ̂𝑏) denote the result of derivation of the right side in formula (A.22) with respect to 𝑐; then 𝑐 satisfies 𝜙 = 0 with 𝜙(𝑐, 𝜃, 𝑤, 𝑟̂, ̂𝑏) = 𝑢𝑐 − 𝑉𝑤 . Hence, the impact of 𝑟̂ on 𝑐 is 𝑐𝑟̂ = −
,
−1/𝛾
According to formula (A.24) and the term 𝑉𝑤𝑤 = (−𝛾/𝑤)𝑉𝑤 which can be obtained from (22) we have 𝑉𝑤̂𝑟 =
2
(𝜌 + 𝜁𝑟 + (1/2) 𝛾 (1 − 𝛾) 𝜃𝑑 𝜎2 ) 𝛾
𝑐𝑑 = 𝑤(R (1 − 𝛾))
From formula (A.23) we have 𝑉𝑟̂ =
𝑁=
(1 − 𝛾) 𝑐𝑑
(A.31)
References [1] R. C. Merton, “Lifetime portfolio selection under uncertainty: the continuous-time case,” Review of Economics and Statistics, vol. 51, no. 3, pp. 247–257, 1969. [2] R. C. Merton, “Optimum consumption and portfolio rules in a continuous-time model,” Journal of Economic Theory, vol. 3, no. 4, pp. 373–413, 1971. [3] F. Wen and X. Yang, “Skewness of return distribution and coefficient of risk premium,” Journal of Systems Science & Complexity, vol. 22, no. 3, pp. 360–371, 2009. [4] F. Wen, “Measuring and forecasting volatility in Chinese stock market using HAR-CJ-M model,” Abstract and Applied Analysis, vol. 2013, Article ID 143194, 13 pages, 2013. [5] J. C. Cox and C.-F. Huang, “Optimal consumption and portfolio policies when asset prices follow a diffusion process,” Journal of Economic Theory, vol. 49, no. 1, pp. 33–83, 1989. [6] I. Karatzas, J. P. Lehoczky, S. P. Sethi, and S. E. Shreve, “Explicit solution of a general consumption/investment problem,” Mathematics of Operations Research, vol. 11, no. 2, pp. 261–294, 1986. [7] I. Karatzas, J. P. Lehoczky, and S. E. Shreve, “Optimal portfolio and consumption decisions for a “small investor” on a finite horizon,” SIAM Journal on Control and Optimization, vol. 25, no. 6, pp. 1557–1586, 1987. [8] I. Karatzas, J. P. Lehoczky, and S. E. Shreve, “Existence and uniqueness of multi-agent equilibrium in a stochastic, dynamic consumption/investment model,” Mathematics of Operations Research, vol. 15, no. 1, pp. 80–128, 1990.
Discrete Dynamics in Nature and Society [9] R. E. Hall, “The dynamic effects of fiscal policy in an economy with foresight,” The Review of Economic Studies, vol. 38, no. 114, pp. 229–244, 1971. [10] M. J. Magill, “A local analysis of 𝑁-sector capital accumulation under uncertainty,” Journal of Economic Theory, vol. 15, no. 1, pp. 211–219, 1977. [11] F. E. Kydland and E. C. Prescott, “Time to build and aggregate fluctuations,” Econometrica, vol. 50, no. 6, pp. 1345–1370, 1982. [12] L. J. Christiano, “Linear-quadratic approximation and valuefunction iteration: a comparison,” Journal of Business & Economic Statistics, vol. 8, no. 1, pp. 99–113, 1990. [13] K. L. Judd and S.-M. Guu, “Asymptotic methods for asset market equilibrium analysis,” Economic Theory, vol. 18, no. 1, pp. 127– 157, 2001. [14] G. A. Miller, “The magical number seven, plus or minus two: some limits on our capacity for processing information,” Psychological Review, vol. 63, no. 2, pp. 81–97, 1956. [15] D. Kahneman, Thinking, Fast and Slow, Macmillan, New York, NY, USA, 2011. [16] W. Bi, Y. Sun, H. Liu, and X. Chen, “Dynamic nonlinear pricing model based on adaptive and sophisticated learning,” Mathematical Problems in Engineering, vol. 2014, Article ID 791656, 11 pages, 2014. [17] P. Bordalo, N. Gennaioli, and A. Shleifer, “Salience theory of choice under risk,” The Quarterly Journal of Economics, vol. 127, no. 3, pp. 1243–1285, 2012. [18] B. K˝oszegi and A. Szeidl, “A model of focusing in economic choice,” The Quarterly Journal of Economics, vol. 128, no. 1, pp. 53–104, 2013. [19] C. A. Sims, “Implications of rational inattention,” Journal of Monetary Economics, vol. 50, no. 3, pp. 665–690, 2003. [20] L. Peng and W. Xiong, “Investor attention, overconfidence and category learning,” Journal of Financial Economics, vol. 80, no. 3, pp. 563–602, 2006. [21] M. S. Seasholes and G. Wu, “Predictable behavior, profits, and attention,” Journal of Empirical Finance, vol. 14, no. 5, pp. 590– 610, 2007. [22] B. Ma´ckowiak and M. Wiederholt, “Optimal sticky prices under rational inattention,” American Economic Review, vol. 99, no. 3, pp. 769–803, 2009. [23] X. Gabaix, “A sparsity-based model of bounded rationality, applied to basic consumer and equilibrium theory,” Working Paper, National Bureau of Economic Research, YUN, New York, NY, USA, 2013. [24] W. H. Fleming and H. M. Soner, Controlled Markov Processes and Viscosity Solutions, vol. 25, Cambridge University Press, Cambridge, UK, 2006. [25] J.-P. Fouque, G. Papanicolaou, and K. R. Sircar, Derivatives in Financial Markets with Stochastic Volatility, Cambridge University Press, Cambridge, UK, 2000. [26] M. I. Kamien and N. L. Schwartz, Dynamic Optimization: The Calculus of Variations and Optimal Control in Economics and Management, Courier Dover Publications, Mineola, NY, USA, 1991. [27] F. Wen, Z. He, and X. Chen, “Investors’ risk preference characteristics and conditional skewness,” Mathematical Problems in Engineering, vol. 2014, Article ID 814965, 14 pages, 2014. [28] F. Wen, X. Gong, Y. Chao, and X. Chen, “The effects of prior outcomes on risky choice: evidence from the stock market,” Mathematical Problems in Engineering, vol. 2014, Article ID 272518, 8 pages, 2014.
11 [29] W. H. Fleming and T. Pang, “An application of stochastic control theory to financial economics,” SIAM Journal on Control and Optimization, vol. 43, no. 2, pp. 502–531, 2004. [30] W. H. Fleming and D. Hern´andez-Hern´andez, “An optimal consumption model with stochastic volatility,” Finance and Stochastics, vol. 7, no. 2, pp. 245–262, 2003. [31] L. Wang, C. X. Dun, W. J. Bi, and Y. R. Zeng, “An effective and efficient differential evolution algorithm for the integrated stochastic joint replenishment and delivery model,” KnowledgeBased Systems, vol. 36, pp. 104–114, 2012. [32] L. Wang, C. X. Dun, C. G. Lee, Q. L. Fu, and Y. R. Zeng, “Model and algorithm for fuzzy joint replenishment and delivery scheduling without explicit membership function,” The International Journal of Advanced Manufacturing Technology, vol. 66, no. 9–12, pp. 1907–1920, 2013. [33] L. Wang, H. Qu, Y. Li, and J. He, “Modeling and optimization of stochastic joint replenishment and delivery scheduling problem with uncertain costs,” Discrete Dynamics in Nature and Society, vol. 2013, Article ID 657465, 12 pages, 2013.
Advances in
Operations Research Hindawi Publishing Corporation http://www.hindawi.com
Volume 2014
Advances in
Decision Sciences Hindawi Publishing Corporation http://www.hindawi.com
Volume 2014
Journal of
Applied Mathematics
Algebra
Hindawi Publishing Corporation http://www.hindawi.com
Hindawi Publishing Corporation http://www.hindawi.com
Volume 2014
Journal of
Probability and Statistics Volume 2014
The Scientific World Journal Hindawi Publishing Corporation http://www.hindawi.com
Hindawi Publishing Corporation http://www.hindawi.com
Volume 2014
International Journal of
Differential Equations Hindawi Publishing Corporation http://www.hindawi.com
Volume 2014
Volume 2014
Submit your manuscripts at http://www.hindawi.com International Journal of
Advances in
Combinatorics Hindawi Publishing Corporation http://www.hindawi.com
Mathematical Physics Hindawi Publishing Corporation http://www.hindawi.com
Volume 2014
Journal of
Complex Analysis Hindawi Publishing Corporation http://www.hindawi.com
Volume 2014
International Journal of Mathematics and Mathematical Sciences
Mathematical Problems in Engineering
Journal of
Mathematics Hindawi Publishing Corporation http://www.hindawi.com
Volume 2014
Hindawi Publishing Corporation http://www.hindawi.com
Volume 2014
Volume 2014
Hindawi Publishing Corporation http://www.hindawi.com
Volume 2014
Discrete Mathematics
Journal of
Volume 2014
Hindawi Publishing Corporation http://www.hindawi.com
Discrete Dynamics in Nature and Society
Journal of
Function Spaces Hindawi Publishing Corporation http://www.hindawi.com
Abstract and Applied Analysis
Volume 2014
Hindawi Publishing Corporation http://www.hindawi.com
Volume 2014
Hindawi Publishing Corporation http://www.hindawi.com
Volume 2014
International Journal of
Journal of
Stochastic Analysis
Optimization
Hindawi Publishing Corporation http://www.hindawi.com
Hindawi Publishing Corporation http://www.hindawi.com
Volume 2014
Volume 2014