We show by means of experimental evaluations on webpages that our approach ..... and the webpage sizes of Table 1, if the free hoard-cache size for a given ...
An Enhanced Hoarding Approach Based on Graph Analysis Susanne B¨urklen, Pedro Jos´e Marr´on, Kurt Rothermel University of Stuttgart Institute of Parallel and Distributed Systems Universit¨atsstr. 38 70569 Stuttgart, Germany {buerklen, marron, rothermel}@informatik.uni-stuttgart.de Abstract The proliferation of mobile devices has led to the creation of hoarding algorithms that attempt to mitigate the problems related with disconnected operation or with the operation in areas where bandwidth is either scarce or very expensive. Traditional hoarding approaches use probability access tables to determine what information needs to be sent to the mobile device, but fail to take the structured nature of data into account. In this paper, we present an enhanced hoarding approach for semistructured information that relies on the analysis of graphs to determine the information that needs to be hoarded. We show by means of experimental evaluations on webpages that our approach outperforms other hoarding algorithms that treat information as the combination of unrelated items.
1
Introduction
The evolution of wireless network technology as well as the growing capacity of mobile devices have led to an increase in the number of users that access information onthe-road. However, due to the possible unreliable nature of connectivity in areas the user might travel along, disconnected operation and operation in the presence of scarce or very expensive bandwidth has to be efficiently supported by the mechanisms used to access this information. In such a scenario represents hoarding a valuable approach. Hoarding is a technique used to download large amounts of information while in an area with good connectivity, in the hope that it might be needed at some later point in time. Therefore, as opposed to caching, the goal of hoarding is to improve the efficiency of first-time access to information by predicting the information items that will be needed in the near future. Existing hoarding algorithms, like the one used by Kubach and Rothermel [8, 9], consider information to be
composed of unrelated items and rely simply on the popularity of a given piece of information to determine whether or not it should be hoarded. Furthermore, this mechanism is based on the assumption that the type of information accessed by a user is location-dependent, which helps achieve better hit ratios. Even though these algorithms achieve hit rates of over 60%, the fact that most information is either structured or semistructured indicates, at least intuitively, that algorithms that take the structure of information into account should achieve better performance. In this paper, we present the characteristics of a hoarding algorithm for semistructured data that takes the relationship of individual information items into account. We show that our approach performs as well as the non-structured approaches for big hoard-caches, and outperforms them by a factor of two if the size of the available hoard-cache at the client is less than 10 MBytes. For the purposes of our experiments, we concentrate on the most popular type of semistructured information items, namely webpages, but our results can be easily extended to other types of semistructured or even structured data. The rest of this paper is structured as follows: In Section 2 we introduce our system model. Section 3 gives a short overview of our hoarding approach, whereas the relations between web pages and the resulting information graph is defined in Section 4. The algorithms used to update and traverse the information graph to determine what items to hoard, are presented in Section 5, leaving for Section 6 the presentation of our experimental evaluation. Related work is discussed in Section 7, while a short summary and our plans for future work are discussed in Section 8.
2
System Model
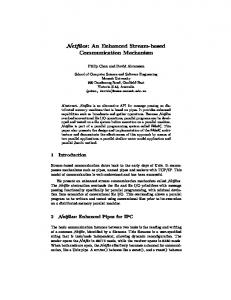
Our system model is primarily composed of mobile devices used to access semistructured information (webpages) on-the-road, and infostations that are responsible for a specific hoarding area, as shown in Fig. 1.
Proceedings of the 2004 IEEE International Conference on Mobile Data 1Management (MDM’04) 0-7695-2070-7/04 $20.00 © 2004 IEEE
Mobiledevice Mobile
device
Infostation Infostation
Transmission Area Path of a User Path
of a User
Communication Communication
Hoarding Area
Figure 1. System Model We assume that the user carries a mobile device, like a cellular phone, a personal digital assistant (PDA) or a notebook running the hoarding application and a web browser. These devices are equipped with sensors that determine the actual position of a user, so that it can be easily determined at which location the user requested a given information item, and a hoard-cache of limited size that stores the information items downloaded from the infostation. The purpose of an infostation is to manage information items that might be relevant to its geographical area and to make the hoarding decision as to which information items are to be downloaded (hoarded) onto the mobile device. Each infostation is equipped with an access point for a WLAN and, additionally, is connected to a wired network. Within the transmission area the WLAN access point provides mobile users with the appropriate connection to the infostation, while the connection to the wired network is used for the exchange of information between infostations and the access to the information space. Each infostation has an associated hoarding area, that is, a geographical area greater than the transmission area, for which it stores relevant information items. Infostations communicate with each other to inform other neighboring infostations of information requests performed by users at a geographical area they might be responsible for.
3
Overview of our Approach
Our hoarding mechanism is based upon the idea of hoarding location-dependent information items (webpages) requested in a geographic area by mobile users. In order to model the relations between information items, we use a generic graph representation as the underlying data storage structure that represents their overall popularity. The resulting information graph consists of a set of vertices that represent webpages, and a set of edges that model their access pattern, as described in the next section. Each infostation manages such an information graph for its hoarding area.
Initially, the graph consists of only one vertex, the graph start vertex that, as we will see in the next sections, connects to the set of information items most users start from. As shown in Fig. 2, the actual hoarding procedure is a cycle that consists of the following phases: 1. The disconnected operation phase begins either when a mobile user leaves the transmission area of an infostation or when the user begins requesting information items for the first time by starting the hoarding application. From this point on, a user log file is created in which the time and location of all requests are recorded. 2. The upload phase begins when a mobile user enters the transmission area of an infostation. At this point, additional derived information extracted from the log file, such as the timespan spent by the user on a given webpage, is calculated at the mobile device. Then, the user log file and the derived log information is sent to the infostation for analysis. Since the hoarding areas of different infostations overlap and the user moves potentially over several hoarding areas, there could be entries in the log file that should be forwarded to the infostations responsible for those data items. Therefore, it is possible that the upload phase involves several infostations. 3. During the analysis phase, the infostation analyzes the user log file and updates its own information graph based on the specific entries in the log file and some extra derived information. 4. Finally, in the download phase, the information graph is traversed to determine what information items should be downloaded to the mobile device. Then, taking into account the size of the hoard-cache, the appropriate amount of information is sent to the device.
Proceedings of the 2004 IEEE International Conference on Mobile Data 2Management (MDM’04) 0-7695-2070-7/04 $20.00 © 2004 IEEE
3 2 1
1
4
Path of a User n
Transmission Area
No. of Hoarding Cycle
Figure 2. Hoarding Cycle
4
Data Model
In this section we describe the data elements used by the mobile device and the infostation.
derived information such as the timespan spent by the user on a given webpage used by the infostation to perform its algorithms, is also shown in the sample user log file. The other derived information items are described below.
4.1
4.2
Mobile Device Data
The main data element used at a mobile device is the user log file. In it, the hoarding application stores information about the web pages a user requested in the disconnected operation phase. More formally, a user log file L is defined to be a totally ordered set of log entries l sorted by the time the request was made. A log entry l is a five-tuple l = (ID, (x, y), timestamp, size, hit), where: • ID is the globally unique identifier of the requested webpage, e.g., its URL; • (x, y) is the geographical location where the request was made. This information is needed to determine whether or not this log entry has to be analyzed at the current infostation, or has to be forwarded to the appropriate one; • timestamp is the date and time of the request; • size is the size of the requested webpage in bytes; and • hit is a boolean that indicates whether or not the requested webpage was in the hoard-cache. We assume that a user does not request more than one webpage at a time, so that there will be no pair of log entries with the same timestamp and, therefore, a total order of the entries in the log file can be guaranteed. The sample user log file shown in Table 1 consists of seven log entries, as defined above. In the table, we see that webpage s3 was not in the hoard-cache, and that page v5 was requested at 12:09pm on June 20th. Furthermore,
Infostation Data
As noted in the overview of our approach, the main data element inside an infostation is the information graph, which is updated and maintained during the hoarding cycle. Formally, an information graph G is a five-tuple G = (V, E, S, g, weight), where: • V is the set of webpages known to the infostation; • E is the set of edges in the graph. Two webpages u, v ∈ V are related by an edge e = (u, v) ∈ E if they have been requested in sequence; • S is the set of session start webpages, as described below; • g is the explicit graph start vertex; and • weight : E → Q+ is a function that associates a number with each edge in the graph. For an edge (u, v) ∈ E, this number indicates the probability of users requesting webpage v immediately after webpage u. In order to determine with more accuracy whether or not two webpages u and v should be linked with an edge (u, v) in E, we introduce the notion of sessions as part of the analysis at the infostation. Intuitively, a session defines the set of webpages visited by the user in a sitting. With the concept of sessions, we can determine that the last webpage visited by a user, say on Monday night, is not related to the first page visited on Tuesday morning, even though they appear as consecutive entries in the log file. Formally, we define a session as follows:
Proceedings of the 2004 IEEE International Conference on Mobile Data 3Management (MDM’04) 0-7695-2070-7/04 $20.00 © 2004 IEEE
Hoarding Approach
The set of algorithms defined in our hoarding approach corresponds to the hoarding cycle specified in section 3.
0.79
0.1
1
s2 0.
26
09
0.4
Session Start Vertices
s3 0.
0.46
s1
Graph Start Vertex
15
5
g 0.8
0.
Given a set of log entries L, a session R is a subset R ⊆ L of consecutive log entries such that for each pair of consecutive entries r1 ∈ R and r2 ∈ R, the time span defined by the difference in their respective timestamps lies between the minimum and the maximum inter-session time: is tis min ≤ timestampr2 − timestampr1 ≤ tmax . The specific values for the minimum and maximum inter-session time are calculated for a given log file L by analyzing the time spans defined for each pair of consecutive entries in L, and taking the αmin -quantile and αmax quantile respectively. Therefore, webpages visited less than tis min seconds are assumed to be uninteresting to the user, and hence not considered for the update of the information graph, because she did not spend enough time reading them. Similarly, webpages visited for a time period longer than tis max seconds are considered the end of a session and, therefore, not related to the next entry in the log file. As an example, consider the log file of Table 1. Using the following values for αmin = 0.25 and αmax = 0.75, the calculated inter-session times are tis min = 240 and = 360 respectively. Therefore, webpage v8 is not tis max considered for the construction of the information graph, because it has been visited for only 60 seconds, which falls below the minimum inter-session time. Similarly, webpage v6 is considered to be the end of a session because it has been visited during 840 seconds, which lies over the calculated maximum inter-session time. Using this technique and the log file of table 1, we can calculate the information graph shown in fig. 3, assuming that vertices s1 and v10 were already part of the graph. In it, we can see the graph start vertex g linked to the set of session start vertices. As indicated above, the weights over the edges indicate the probability that the sequence defined by the edge has been seen in the log files analyzed by the infostation thus far.
0.11
v10
v5
v4
v7
0.13
(x,y) (1.0,2.0) (1.0,2.0) (1.0,2.0) (5.0,7.0) (1.0,2.0) (1.0,2.0) (1.0,2.0)
0. 7
ID s2 v4 v5 v8 v6 s3 v7
Table 1. Sample User Log File with Derived Information User Log File Derived Information timestamp size (Byte) hit period(s) tis tis tis max min median 2003-06-20/12:00:00 512 yes 300 2003-06-20/12:05:00 624 yes 240 2003-06-20/12:09:00 824 yes 360 2003-06-20/12:15:00 110 yes 60 2003-06-20/12:16:00 552 yes 840 2003-06-20/12:30:00 – no – 2003-06-20/12:33:00 476 yes – 240 360 300
v6
Figure 3. Instance of a Web Graph We assume that the mobile device is able to store the user log file by using conventional techniques during the disconnected operation phase, so that in this section we concentrate on the algorithms applied for the update and traversal of the information graph as needed in the upload, analysis and download phases.
5.1
Disconnected Operation Phase
During the disconnected operation phase, the user tries to access webpages in the hope that they have been stored in the hoard-cache. In either case, that is, whether the requested webpage has been hoarded or not, the log file is updated with information about the time and location where the request was made.
5.2
Upload Phase
As soon as the mobile device enters the transmission area of an infostation, it calculates the derived log information, as seen in Table 1, that will be uploaded with the user log file to the infostation for further analysis, as specified in the next phase. As already mentioned, the calculation of the intersession times is performed by means of quantiles as follows.
Proceedings of the 2004 IEEE International Conference on Mobile Data 4Management (MDM’04) 0-7695-2070-7/04 $20.00 © 2004 IEEE
The notion of quantiles can be read, for example, in [6]. Given an ordered set of values M , the α-quantile of M with α in [0, 1] has the property that at least α ∗ 100% of the elements in M are less or equal the α-quantile, and at least (1 − α) ∗ 100% of the elements in M are greater or equal than the α-quantile. The 0.5-quantile is, therefore, the median of the elements in M . Using this concept, the minimum inter-session time tis min is defined to be the αmin -quantile of all entries in the user log file, where αmin is a number between 0 and 1, globally set as a parameter to our algorithm. Similarly, the maximum inter-session time tis max is defined in terms of the αmax quantile of all log entries. Finally, the median inter-session time is simply defined as the 0.5-quantile. Finally, the infostation sends the appropriate uploaded data to the corresponding neighboring infostations, if the user log file contains information about requests that should be forwarded to them. For example, the entry in Table 1 for webpage v8 has been created at location (5.0, 7.0) which is potentially also managed by another neighboring infostation.
5.3
the median inter-session time, since we see no other way to provide a better value from the information contained in the log file. With this information, it is now possible to calculate the normalized visit time period period∗l for a log entry l by applying the following formula: period∗l = periodl /sizel , where periodl is the visit time of webpage l as defined by the difference between its own request time and the one of the next consecutive entry, and sizel its size in bytes. The set of all normalized visit time periods period∗ is called P . Using this algorithm and the sample log file of Table 1, we calculate the normalized visit times for each entry shown in Table 2. Notice that the size of webpage s3 has been filled in by the infostation. The second step performed by the infostation in the analysis phase involves the update of the weights associated with each edge in the information graph, based on the newly acquired user log data. The core of the weight update procedure relies on the application of a smoothing function with parameter β, where 0 ≤ β ≤ 1, as follows:
Analysis Phase
Due to the (potentially high) mobility of users, it is not sufficient to simply transmit missing webpages onto the mobile device. Since the hoarded webpages exhibit certain location-dependency, the interest of a given user in certain webpages might change with respect to his/her location. During the analysis phase, the infostation performs the following steps in order to update the data contained in the information graph: 1. The visit times for all web pages requested in the user log file L are normalized by the size of the requested webpage; 2. the vertices representing web pages in L, and edges with their calculated weight are inserted into the graph or updated, depending on whether or not this edge was already in the information graph. In case a vertex si represents a session start web page, it is linked with the graph start vertex g by an edge (g, si ). For the normalization of the visit times in the user log file, we have to take the following facts into account: An entry representing a miss does not necessarily have enough information to determine either the size of the requested webpage, or the time the user might have spent visiting it. Therefore, the infostation uses the median inter-session time tis median as the visit time of those pages, and fetches them from the internet in order to determine their size. Similarly, the visit time spent by the user reading the webpage represented by the last log entry in a session is defined to be
weightnew = β ∗ weightold + (1 − β) ∗
period∗l , median(P )
where period∗l is the normalized visit time a user has spent on the webpage represented by log entry l, as defined above, and median(P ) is the median of all normalized visit times. The reason for the use of the median(P ) factor has to do with the differences in reading speeds of users. Unless the visit times are normalized by the median visit time, slower readers would contribute more to changes in the weight of a given edge, which would produce erroneous results. It is worth noticing that, within one session, no backward edges are allowed, so that webpages that happen to be visited several times per session are just weighted once using the maximum of all visit times for the page. This way, information that has been accessed several times is not weighted artificially high if it is used to access other webpages. For example, the use of the back-button might generate an artificially high number of entries in the log file for the same webpage. The process of updating the information graph is depicted in Figs. 4(a) and 4(b). The former represents the state of the information graph before the analysis of the user log file, and the latter, after adding the necessary new edges and updating the existing ones. More specifically, edge (g, s2 ) has been updated from 0.75 to 0.79, and edges (g, s3 ), (s3 , v7 ), (s2 , v4 ), (v4 , v5 ) and (v5 , v6 ) have been added to the information graph. The calculation of the weights for the edges (s3 , v7 ) and (g, s2 ) is performed using the formula above as follows:
Proceedings of the 2004 IEEE International Conference on Mobile Data 5Management (MDM’04) 0-7695-2070-7/04 $20.00 © 2004 IEEE
Web Page s2 v4 v5 v8 v6 s3 v7
time 12:00:00 12:05:00 12:09:00 12:15:00 12:16:00 12:30:00 12:33:00
Table 2. Normalized Visit Times size period(s) period∗ (s) Remarks 512 300 0.59 624 240 0.38 824 360 0.44 110 60 – visit time smaller than tis min 552 300 0.54 median used: last entry in session 642 300 0.47 median used: miss 476 300 0.63 median used: last log entry • BFS(∞): s1 , s2 , s3 , v10 , v5 , v4 .
0.63 = 0.15 0.54 0.59 = 0.79 = 0.87 ∗ 0.75 + (1 − 0.87) ∗ 0.54
weight(s3 ,v7 ) = 0.87 ∗ 0 + (1 − 0.87) ∗ weight(g,s2 )
All other weights are updated in an analogous way.
5.4
Download Phase
The download phase begins with the traversal of the information graph used to select the set of webpages that will be sent to the mobile device. In the implementation of our algorithms, the traversal of the information graph has been performed using either the breadth-first search algorithm (BFS), or the bounded version of the depth-first search algorithm (BDFS). These two variants are the most intuitive ones and the ones explored in the evaluation of our results in Section 6. Before executing both algorithms, it is possible to specify parameters γBF S and γBDF S that limit the amount of vertices (webpages) considered from a specific vertex. In the case of BFS, the γBF S parameter determines the number of siblings that take part in the search, whereas in the case of BDFS, γBDF S specifies the depth at which the search process will finish. Since the structure of the information graph contains a graph start vertex g, both algorithms start traversing the graph from g, and then proceed with the session start vertices in S. The weight associated with each edge guides the search process at each node so that the next node is selected based on its relative weight to other neighboring nodes. Finally, since the available size of the hoard-cache limits the amount of data that can be transferred to the mobile device, the search for appropriate webpages finishes as soon as the sum of the webpage size of all visited vertices exceeds the amount of available space at the mobile device. For example, using the information graph of Fig. 4(b) and the webpage sizes of Table 1, if the free hoard-cache size for a given mobile device is limited to 12 KBytes, we would hoard the following webpages. We assume that the size of s1 is 5800 bytes and the size of v10 is 3800 bytes.
• BDFS(∞): s1 , v10 , v5 , v6 , s2 . As a last comment to our traversal algorithm, it is worth saying that the set of visited pages marked during the BDFS traversal of the information graph is marked in a pre-order fashion, as opposed to the classical Bounded DFS algorithm, where the visited nodes are marked using post-order. The reason for this is the fact that in order to build the sequence of webpages that will be sent to the mobile device, we should give more importance to vertices located closer to the graph start vertex. Otherwise, webpages situated deep in the graph would be downloaded before their ancestors, possibly filling the cache with less interesting information. Due to the inherent liveliness of the hoarded information, all webpages located in the hoard-cache will be replaced by the new webpages. Therefore, if the hoard-cache is full, the transmission of additional webpages stops.
5.5
Complexity
The complexity of our algorithms plays an important role only in the analysis and download phases. In the former, the information graph ist updated to incorporate the data collected at the mobile device in the disconnected operation phase, whereas the latter deals with the traversal of the information graph. In the analysis phase, the number of operations performed is linear with respect to the size of the uploaded log file L. Therefore, the complexity of the update algorithm is O(L). However, assuming that the size of the information graph stored at the infostation is much bigger than the number of log entries in L, we can safely claim that our update algorithm performs in the order of O(V + E). This is definitely the case if L only triggers updates in some of the edges of the information graph, but even in the case where new vertices and edges are generated, it is safe to assume that, after a warm-up phase where the graph is initialized, the number of existing vertices is greater than the number of additions to the graph. As for the BFS and BDFS algorithms performed during the download phase, it is well known that their complex-
Proceedings of the 2004 IEEE International Conference on Mobile Data 6Management (MDM’04) 0-7695-2070-7/04 $20.00 © 2004 IEEE
Graph Start Vertex
s2
7
0.
0.
26
0. 09
0.4
0.4
0.11
v4
v5
v5
v7
v4
0.13
v4
Session Start Vertices
s3
15
0. 7
1
0.
26
s1
Graph Start Vertex 0.1
0.79
0.75
Session Start Vertices
s2
0.46
s1 0.
g 0.8
0.50
g 0.8
weight
weight
v6
Relation with label weight
(a) Instance of the Web Graph Before Uploading
Relation with label weight
(b) Instance of the Updated Web Graph
Figure 4. Instances of the Sample Web Graph Before and After the Update ity is, in the worst case, also within O(V + E). In our implementation of these algorithms, the use of the parameters γBDF S and γBF S to restrict the search to a specific level (BDFS) or number of siblings (BFS) respectively, allows us to have a real complexity lower than the given upper bound. Furthermore, since the type of mobile devices our algorithms deal with have limited resources in terms of memory availability, on average the traversal of the information graph will be performed well below O(V + E).
6
Experimental Evaluation The main goal of our experiments is two-fold: 1. Compare our graph-based algorithm to the coarse grained approach of Kubach and Rothermel [8, 9]; and 2. determine which traversal algorithm and with what parameters works best for real-life semistructured data.
The main characteristic of the coarse grained approach that differentiates it from our implementation is the fact that information items are considered unrelated to each other. Therefore, their implementation relies on the maintenance of an access probability table (APT) calculated from the number of requests to each information item. No other data related to the structure of the information is stored. The metric used in our experiments is simply the hoardcache hit ratio at a mobile device, defined in the usual way. More specifically, for the definition of the log file in section 4, the hit ratio is determined from the analysis of the log files as follows: hitratio =
|H| , |L|
where |L| is the number of entries in the log file and |H| is the cardinality of a set H that only contains those entries of the requested webpages found in the hoard-cache.
6.1
Experimental Setup
In order to be able to make the comparison of the different algorithms and approaches with real-life data, we processed the log files stored at the proxy caching server of a real company in Germany1 , and extracted 45 anonymized user log files with their webpage requests. For the purposes of our algorithm, the proxy caching server acts as an infostation whose hoarding area corresponds to the company location. Due to space constraints, in this paper we only consider the algorithms performed at a single infostation. In our experiments, we created an information graph before measurements were taken by randomly choosing a subset M1 ⊂ L of 40 user log files to initialize the information graph. To perform the measurements depicted in the figures detailed below, we used another subset, M2 ⊂ L, of 5 user log files with M1 ∩ M2 = ∅ and M1 ∪ M2 = L, that sent requests to the infostation. To avoid picking out the best subsets for our algorithm, we repeated the test twenty times, each time randomly selecting a different subset M1 and M2 from the set of 45 user log files. Then, we took the average of these measurements to create the curves below. Table 3(a) shows the characteristics of the information graph after its initialization and the number of entries in the log files used for its update. In order to create the curves shown below, we run our simulations with several hoard-cache sizes that are typical for mobile devices and compared our results with those of Kubach and Rothermel. Even if future mobile phones will have multiple megabytes of user memory this memory has to be shared with other applications like calender, address book, and electronic games. Concerning especially young mobile users, electronic games will have great influence on the memory usage. So we can assume that even if the total amount of memory increases, not all of it will be avail1 Name
concealed due to privacy reasons.
Proceedings of the 2004 IEEE International Conference on Mobile Data 7Management (MDM’04) 0-7695-2070-7/04 $20.00 © 2004 IEEE
Table 3. Characteristics of the Information Graph and Traversal Algorithms (a) Characteristics of the Information Graph
Key Figure average number of vertices average number of edges average number of session start vertices minimal number of log file entries maximal number of log file entries average number of log file entries median of log file entries minimal webpage size maximal webpage size median webpage size
(b) Parameters for the Traversal Algorithms
Value 9571 15503 2278 1 2674 507 234 106 998774 2583
able for hoarding. Therefore, we have tested the following hoard-cache sizes: • Mobile Phones/Handhelds: 200 KBytes, 500 KBytes • Handhelds/Laptops: 2 MBytes, 5 MBytes, 10 MBytes, 32 MBytes, 64 MBytes Additionally, we tested all possible combinations of the parameters specified in Table 3(b) in our algorithm to determine which combination of parameters offers the best performance.
6.2
Experimental Results
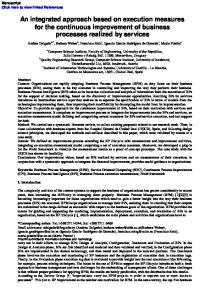
Fig. 5(a) shows the hit ratio of three of our traversal algorithms for β = 0.87, αmin = 0.4 and αmax = 0.9, and the hit ratio for the approach of Kubach and Rothermel. In it, we can see that our graph-based implementation performs better than their coarse grained approach for small cache sizes, which is significant because starting from a certain cache size (10 MBytes in our experiments), all algorithms perform equally well. This is due to the fact that sufficiently big hoard-cache sizes have enough available space to incorporate most popular webpages, and so, the specific traversal algorithm does not play such an important role. For small hoard-cache sizes, the sequence of the webpage requests and the way they are traversed is more critical because the number of hoarded webpages is much smaller. In such a situation, depicted for hoard-caches between 200 KBytes and 10 MBytes in Fig. 5(b), it seems clear that our BFS(∞) algorithm performs best, achieving, for example for a hoard-cache size of 5 MBytes, hit ratios of over 40%, as opposed to 20% for all other approaches. In running our simulations, we learned that the choice in value of parameters is extremely important. For the data set we used, it seems that the optimal parameter combination is β = 0.87, αmin = 0.4 and αmax = 0.9. This is indeed an
Parameters αmin -quantile αmax -quantile β γBF S γDBF S
Tested Values {0.10, 0.25, 0.40} {0.60, 0.75, 0.90} {0.13, 0.3, 0.5, 0.7, 0.87, 0.9} {1, 5, 10, 20, 50, ∞} {1, 5, 10, 20, 50, ∞}
interesting and surprising result, because the value of β was obtained by looking at the implementation of TCP and using the suggested value of 7/8 = 0.875. A smoothing factor of 0.87 is aparently a good compromise for a smoothing function that converges fast enough that it is able to adapt to changes in its environment, but does not change too rapidly. The values of αmin and αmax can be explained by noticing the intuition behind them. A small value for αmin means that almost every webpage will be considered part of a session, whereas a bigger value filters out pages that have not been visited long enough, so that they are not considered by the update algorithm. Analogously, a small value for αmax splits the user log file into unnecessarily many sessions, since the maximum visit time is lowered by a small αmax -quantile. On the other hand, a large value of αmax creates less session start vertices, but the ones created are closer to the number of real sessions. Fig. 6(a) and 6(b) show the differences in hit ratios for different values of αmin and αmax . Both figures have been plotted with a value of β = 0.5, because the variation of αmin and αmax in combination with other values of β do not differ from each other as much as for the case exposed in the figures. Regarding the choice of γBF S and γBDF S , the parameters that limit the traversal of our algorithms, they should be set according to the size of the hoard-cache of the client. In Fig. 5(a), the BDFS(5) algorithm has exactly the same performance for hoard-caches bigger than 5 MBytes because the parameter γBDF S is set to a small value and, therefore, the traversal of the graph is stopped unnecessarily before the hoard-cache is full. For this reason, in most cases γBDF S should be set to ∞ and let the size of the hoardcache be the limiting factor for the traversal. The only range where a small value of γBDF S seems to provide better performance is for hoard-cache sizes between 200 KBytes and 500 KBytes where, as can be seen in Fig. 5(b) DBFS(5) performs better than DBFS(∞), but this could be accidental. BFS, on the other hand, seems to be very sensitive to
Proceedings of the 2004 IEEE International Conference on Mobile Data 8Management (MDM’04) 0-7695-2070-7/04 $20.00 © 2004 IEEE
0.8
0.45
0.7
0.4
0.35
0.6
0.3
Hitratio
Hitratio
0.5
0.4
0.25
0.2
0.3 0.15
BFS(full) BDFS(full) BDFS(5) Kubach
0.2
BFS(full) BDFS(full) BDFS(5) Kubach
0.1
0.1
0.05
0
0 0
10000
20000
30000
40000
50000
60000
70000
0
2000
Hoardcache Size [KB]
4000
6000
8000
10000
Hoardcache Size [KB]
(a) hitRatio β = 0.87, αmin = 0.4, αmax = 0.9
(b) hitRatio β = 0.87, αmin = 0.4, αmax = 0.9
Figure 5. Simulation Results: Full and Limited Range the choice of γBF S . This is probably the case because, if we analyze the characteristics of our information graph from Table 3(a), we see that on average, almost 25% of all webpages are represented by session start vertices. Therefore, it makes sense that the BFS algorithm with a value of γBF S = ∞ performs best overall, and that smaller values of γBF S have a dramatic effect on the performace of the algorithm, since important webpages will be left out of the traversal if γBF S is set to a very small value. Furthermore, it seems that the BDFS algorithm is best suited for users that access webpages in longer sessions, as opposed to other users that access their data using eminently short sessions, that is, including many session start vertices. Since the data we have used for our experiments comes from a real company, it is desirable (and definitely a good thing from the point of view of management!), that its users access webpages in short sessions, as opposed to long-lasting ones. However, we can imagine that other environments, like users accessing data from home, would show a different access behavior than the one we have seen in a company, so that it would probably make sense to have more than one information graph to model their behavior. In our case, that would mean managing two graphs, one for users that prefer short sessions, and one for users that access their data in long sessions. In such an environment, our guess is that BFS would perform better for the traversal of the information graph where short-lived sessions are stored, and BDFS would outperform all other traversal strategies for the graph with longer-lasting sessions.
7
Related Work
To overcome the drawbacks of wireless networks, such as frequent disconnections and energy constraints of mobile devices for the purpose of mobile information access, a number of methods for the optimization of mobile data management have been developed. We can distinguish two main topics: Caching strategies, and methods to support disconnected operation. The idea of caching, used in wired as well as in wireless networks, is to store information locally on a mobile device, once it is transferred from the server. To support geographical locality for mobile information access, semantic caching strategies have been developed, e.g. [12]. Nevertheless, no matter which replacement strategy is used, first-time access to an information object is not improved, because a connection to the server has to be established to trigger the caching process. In contrast, the goal of hoarding is to speed up first-time access to information. In [2], Chang et al. present an asynchronous information access approach to support disconnected operation. In the case of low or non-existing bandwidth, the information request is delayed until a high bandwidth network connection is available. The problem here is that the users might not be interested in the requested information anymore, as they could have moved to another location. Other approaches like [1], [4], [5], [16] or [17], focus primarily on reducing response time and increasing the scalability of the system by broadcasting information items. If the mobile devices involved in the system are locationaware, users are provided with the information items they need at their current location. However, location-aware broadcast-based dissemination systems do not predict the
Proceedings of the 2004 IEEE International Conference on Mobile Data 9Management (MDM’04) 0-7695-2070-7/04 $20.00 © 2004 IEEE
0.45
0.4
0.4
0.35
0.35
0.3
0.3
0.25
0.25
Hitratio
Hitratio
0.45
0.2
0.15
BFS(full) BDFS(full) BDFS(5) Kubach
0.1
0.2
0.15
BFS(full) BDFS(full) BDFS(5) Kubach
0.1
0.05
0.05
0
0 0
2000
4000
6000
8000
10000
0
2000
Hoardcache Size [KB]
4000
6000
8000
10000
Hoardcache Size [KB]
(a) hitRatio β = 0.5, αmin = 0.25, αmax = 0.75
(b) hitRatio β = 0.5, αmin = 0.4, αmax = 0.9
Figure 6. Analyzing Different Values of α-quantiles information items users will need after leaving for another location away from the coverage area of the current cell. Nevertheless, the broadcast-based approach might be useful for our purposes to increase scalability and to decrease the bandwidth required for the download phase as needed for the update of the mobile device data. The Coda file system [7], [14], [13] is one of the first approaches that used the concept of hoarding to allow for disconnected operation in network filesystems. It relies on user interaction for its operation, and requires a list of preferred information items from each user. Another approach in the field of network filesystems [10], [11] implemented an automated hoarding mechanism for mobile users. In order to predict which files a user will need in the future, the system observes the behavior of users and identifies the semantic distance between the accessed files. The automated hoarding algorithm presented in [15] is, therefore, based on detecting working sets. In contrast to our approach, those projects make use of properties of file systems that can not be adapted to general information objects. In [3], hoarding of objects in a virtual environment is enabled using caching and prefetching strategies. Disconnected operation is supported by observing the moving direction of the user, as well as the viewing direction, so that objects lying on the walking path are prefetched and copied locally into the device carried by the user. Another interesing approach, similar to ours, is presented in the Mapon-the-Move project [18], where drivers are provided with map information at different resolutions depending on the speed they travel through the transmission areas of infostations. Other factors considered are the current position of the user, the current speed and the planned route, that is, the start and end point of the journey. The difference to our ap-
proach is that we do not have specific information about the exact route a user might take. Moreover, our algorithms are applicable not only to maps, but to general semistructured information items. Kubach and Rothermel introduced infostation-based information hoarding in [8, 9]. The information items are sorted by computing the access probability to each information item in order to construct the list of hoarding items. This mechanism is based on the assumption that the type of information accessed by a given user is location-dependent. Thus, the hoarding decision is performed based on the specific location and the path a user takes. This approach is very close to ours with the exception that, for our algorithms, information items are considered to be semistructured, and Kubach and Rothermel only consider unstructured information items. Our algorithm optimizes this approach by incorporating relations between data.
8
Conclusion and Future Work
In this paper we have introduced a novel approach for hoarding semistructured information items, based on graph analysis. We have shown by means of experimental evaluations that our algorithm works better than the implementation of Kubach and Rothermel that relies simply on the access probability of data items without taking their structure into account. Furthermore, we have introduced the notion of sessions that allows us to manage the data items in a better way. Additionally, we have determined empirically that the traversal of our information graph using Breadth-First Search works best for the real-life data we have considered in our experiments. Finally, we have tested our algorithms with several parameter combinations in order to determine
Proceedings of the 2004 IEEE International Conference on Mobile Data10 Management (MDM’04) 0-7695-2070-7/04 $20.00 © 2004 IEEE
the values that provide us with the best hit ratios. The results presented in this paper are the first set of experiments we have performed on semistructured data, but there are many improvements that can be made to our system, which will become part of our future work. First of all, we plan on modeling user behavior in the World Wide Web (Web) to evaluate our algorithm. This model will include a Web graph model, an access behavior model and a mobility model. The evaluation of our algorithm using log data has enormous drawbacks: First, a huge amount of data is needed to achieve adequate results. Second, log data received from web servers or proxy servers often do not provide enough information to adequately extract user data. E.g., if several users share one IP-address, the web server can not distinguish between them. Simulating users has the advantage of an appropriate model once created, it can be adapted easily to various kinds of user behavior. Further on, it may be used to determine the scalability and performance of our algorithm. Next, we plan on extending the basic graph-based algorithm to take other information into account, like the physical structure of webpages, the semantic relationship among them, and whether or not there are pages that act as neuralgic centers of information. The access behavior of users needs to be considered since, as we have seen in the experiments presented in this paper, by just using one information graph, intrinsic differences in the way users access their information is not taken into account. Further on, we will consider user profiles such like interest in sport or in culture. For this purpose we will try to gain an automatical recognition of web page categories and to determine user profiles automatically by analyzing user log files. Finally, we plan on providing a greater level of granularity for each infostation by dividing the hoarding area into zones, as done by Kubach and Rothermel, so that we can compare our methodology with their fine grained approach. For this purpose, we plan on using not only webpages, but also other type of structured information whose location-dependency plays a more important role than that of webpage-related information.
[3]
[4]
[5]
[6] [7]
[8]
[9]
[10]
[11]
[12]
[13]
[14]
References [1] S. Acharya and S. Muthukrishnan. Scheduling on-demand broadcasts: new metrics and algorithms. In Proceedings of the fourth annual ACM/IEEE international conference on Mobile computing and networking, pages 43–54. ACM Press, 1998. [2] H. Chang, C. Tait, N. Cohen, M. Shapiro, S. Mastrianni, R. Floyd, B. Housel, and D. Lindquist. Web browsing in a wireless environment: disconnected and asynchronous operation in artour web express. In Proceedings of the third
[15]
[16]
annual ACM/IEEE international conference on Mobile computing and networking, pages 260–269. ACM Press, 1997. J. H. P. Chim, M. Green, R. W. H. Lau, H. V. Leong, and A. Si. On caching and prefetching of virtual objects in distributed virtual environments. In Proceedings of the sixth ACM international conference on Multimedia, pages 171– 180. ACM Press, 1998. A. Datta, D. E. VanderMeer, A. Celik, and V. Kumar. Broadcast protocols to support efficient retrieval from databases by mobile users. ACM Transactions on Database Systems (TODS), 24(1):1–79, 1999. N. Davies, K. Cheverst, K. Mitchell, and A. Friday. Caches in the air: Disseminating information in the guide system. In Proceedings of the Second IEEE Workshop on Mobile Computing Systems and Applications, pages 1–19, 1999. R. Hogg and A. Craig. Introduction to Mathematical Statistics. Prentice Hall, fifth edition, 1994. J. J. Kistler and M. Satyanarayanan. Disconnected operation in the coda file system. ACM Transactions on Computer Systems (TOCS), 10(1):3–25, 1992. U. Kubach and K. Rothermel. Exploiting location information for infostation-based hoarding. In Proceedings of the seventh annual international conference on Mobile computing and networking, pages 15–27. ACM Press, 2001. U. Kubach and K. Rothermel. A map-based hoarding mechanism for location-dependent information. In Proceedings of the 2nd Intl. Conference on Mobile Data Management, pages 145–157, Hongkong, China, 2001. G. H. Kuenning, W. Ma, P. Reiher, and G. J. Popek. Simplifying automated hoarding methods. In Proceedings of the 5th ACM international workshop on Modeling analysis and simulation of wireless and mobile systems, pages 15–21. ACM Press, 2002. G. H. Kuenning and G. J. Popek. Automated hoarding for mobile computers. In Proceedings of the sixteenth ACM symposium on Operating systems principles, pages 264– 275. ACM Press, 1997. Q. Ren and M. H. Dunham. Using semantic caching to manage location dependent data in mobile computing. In Proceedings of the sixth annual international conference on Mobile computing and networking, pages 210–221. ACM Press, 2000. M. Satyanarayanan, J. Kistler, P. Kumar, M. Okasaki, E. Siegel, and D. Steere. Coda: A highly available file system for a distributed workstation environment. IEEE Transactions on Computers, 39(4):447–459, 1990. M. Satyanarayanan, J. J. Kistler, L. B. Mummert, M. R. Ebling, P. Kumar, and Q. Lu. Experience with disconnected operation in a mobile environment. In USENIX, editor, Proceedings of the USENIX Mobile and LocationIndependent Computing Symposium: August 2–3, 1993, Cambridge, Massachusetts, USA, pages 11–28, Berkeley, CA, USA, Aug. 1993. USENIX. C. Tait, H. Lei, S. Acharya, and H. Chang. Intelligent file hoarding for mobile computers. In Proceedings of the first annual international conference on Mobile computing and networking, pages 119–125. ACM Press, 1995. K. Tan and B. Ooi. Data Dissemination in Wireless Computing Environments. Kluwer Academic Publishers, 2000.
Proceedings of the 2004 IEEE International Conference on Mobile Data11 Management (MDM’04) 0-7695-2070-7/04 $20.00 © 2004 IEEE
[17] N. Vaidya and S. Hameed. Data broadcast in asymmetric wireless environments. In Proceedings of the 1st Workshop on Satellite Based Information Systems, 1996. [18] T. Ye, H.-A. Jacobsen, and R. Katz. Mobile awareness in a wide area wireless network of info-stations. In Proceedings of the fourth annual ACM/IEEE international conference on Mobile computing and networking, pages 109–120. ACM Press, 1998.
Proceedings of the 2004 IEEE International Conference on Mobile Data12 Management (MDM’04) 0-7695-2070-7/04 $20.00 © 2004 IEEE