int. j. remote sensing, 2002, vol. 23, no. 6, 1197 –1205
An extension of a nonparametric clustering algorithm to derive radiometrically homogeneous objects pointed by seeds R. SALVADOR†‡* and J. SAN-MIGUEL-AYANZ†*
Downloaded by [European Commission] at 08:42 27 June 2016
† Joint Research Centre, Space Applications Institute, TP262, I-21020 Ispra ( Va), Italy ‡ Center for Ecological Research and Forestry Applications, Facultat de Cie`ncies, Universitat Auto`noma de Barcelona, 08193 Bellaterra, Barcelona, Spain (Received September 1999; in nal form 7 February 2001) Abstract. A simple semi-automatic methodology to derive radiometrically homogeneous objects, pointed by seeds, is described. This methodology has in its core a nonparametric clustering algorithm. As an example, some of the areas burnt by res that occurred in 1998 in Greece are drawn from an image obtained by the Wide Field Sensor (WiFS).
1.
Introduction Nonparametri c clustering algorithms have been applied for image segmentation since the early 1970s (Fukunaga and Hostetler 1975, Narendra and Goldberg 1977, Wharton 1983). Apart from few applications in which contextual information is used (Narendra and Goldberg 1980, Khotanzad and Bouarfa 1990), they are concerned mainly with the radiometric information of image bands. Speci cally, these algorithms are based on the direct or indirect estimation of the gradient of the multiband histograms and the later assignation of points to the closest histogram mode (Fukunaga and Hostetler 1975). In contrast with other spectral nonsupervised classi ers based on distances (Mather 1987, Richards 1993), the use of gradient estimates allows the adequate derivation of clusters of any shape (as long as they have a clear and unique mode) and there is no need to specify the number of classes to be derived (Fukunaga 1990). As a consequence of these properties, such algorithms will usually depend on one, or only a few parameters. Thus, compared to many other classi ers they have a quite straightforward applicability (Khotanzad and Bouarfa 1990). Nevertheless, although being rather simple to use, they have some inherent restrictions: 1. Results of classi cation procedures may be highly dependent on the value of the parameters but there is no easy and eYcient way to derive their optimum value a priori. 2. Since nonparametri c clustering algorithms are based on the estimate of the *emails:
[email protected];
[email protected] Internationa l Journal of Remote Sensing ISSN 0143-116 1 print/ISSN 1366-590 1 online © 2002 Taylor & Francis Ltd http://www.tandf.co.uk/journals DOI: 10.1080/01431160110059927
1198
R. Salvador and J. San-Miguel-Ayan z
Downloaded by [European Commission] at 08:42 27 June 2016
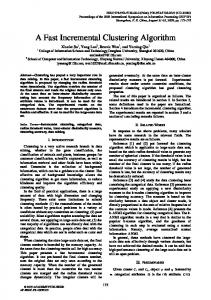
gradient and on the presence of clear modes in the histogram, the relative frequencies of the classes of interest in the image should be high enough to appear as de ned clusters. 3. Finally, since classes are only derived considering the spectral histogram (no spatial information is usually involved), diVerent land cover types having the same spectral response will be assigned to the same class. In this paper we describe a semi-automatic methodology, based on a nonparametric clustering algorithm, aimed to derive radiometrically homogeneous objects from images. The use of point seeds previously located inside these objects reduces the inconveniences due to the three previously listed problems in a rather easy manner. The methodology is meant to be applied separately in each of the objects pointed by a seed. To illustrate its use, areas burnt by res which occurred in Greece (summer of 1998) were derived from a Wide Field Sensor (WiFS) image, taken on the 25 August of 1998, with a red band (band 3) and a near-infrared band (band 4). 2. The methodology 2.1. L ocation of seeds pointing to objects and identi cation of windows The location of a seed (point) inside every one of the objects to be mapped is a previous stage necessary for the semi-automatic methodology. Although this was carried out manually in the example to be presented, this could also be coupled to an independent automatic procedure. Seeds pointing to the objects allow identifying windows (from the main image) where objects are contained. The size of such windows should be bigger than the objects but small enough for them to have a high relative frequency of pixels, thus minimizing the second restriction listed in the introduction. In the methodology developed the size of the window is supposed to be the same for all the objects, and is chosen before locating the seeds. The eVect of the size of the window is illustrated in gure 1, where windows of diVerent sizes containing one of the burnt patches of the study area are displayed together with their red–near-infrared spectral bivariate histogram. Three main clusters are clearly displayed in the histogram of the smallest window ( gure 1(b)): (1) the one made up with ‘sea’ pixels located in the lower left corner, (2) the largest including almost all ‘land’ pixels, and (3) another cluster located between the previous two, which contains mainly ‘burnt pixels’. As the size of the window is increased ( gure 1(c)–( f )) the third cluster in the spectral space (containing the burnt patch) becomes blurred and its distinctiveness drops signi cantly. Therefore, when comparing the distinctiveness of the cluster containing the burnt pixels in all the three windows, the smallest seems to be the most adequate to derive the desired object. 2.2. Nonparametric clustering of windows To carry out the clustering classi cation of the windows we followed the guidelines given by Fukunaga (1990). Building up the multivariate histogram is the rst step in nonparametric clustering algorithms. Usually, the histogram is considered as a sample from a probability function. In the present example, values of the bivariate histogram derived from the red–near-infrared bands were used to estimate the probability function by means of a Parzen uniform window (Fukunaga 1990). For each pair (x, y) of digital number (DN) values of the bivariate spectral space the
An algorithm to derive radiometrically homogeneous objects
Downloaded by [European Commission] at 08:42 27 June 2016
a
1199
b
d c
f
e
Figure 1. Windows of a WiFS image (RGB: near-infrared, red, red) of increasing size ((a): 743 km2, (c): 3365 km2 and (e): 22 116 km2) containing one, or more burnt patches, together with images of their respective red ( horizontal axis)—near-infrared (vertical axis) bivariate histograms (b, d and f ). The numbers in (b) point to the diVerent clusters observed (see §2.1. for a speci c description of each of the clusters found in this gure). The study area was located near Athens, in Greece.
1200
R. Salvador and J. San-Miguel-Ayan z
value of the probability function was estimated by
Downloaded by [European Commission] at 08:42 27 June 2016
æ f (u,v) pˆ (x, y)= C(x,y) npR2
(1)
where C(x, y) refers to all pairs (u, v) of DN values of the bivariate spectral space located inside a circumference of radius R (in DN units) with centre in the x, y coordinates, and f is the total number of pixels with pairs of DN values equal (u,v) to u and v (derived from the bivariate histogram) . Finally, n is the total number of pixels in the image and p is the number pi. In fact, npR2 is a xed quantity applied to derive estimates of probabilities from absolute counts, and for practical reasons may be ignored. When the probability function has been estimated for each pair of DN values of the bivariate spectral space, paths from each of these pairs to the nearest pair containing a mode (a local maximum in the estimates of the probability function) may be found. If graph theory is used, a noniterative process can be applied to assign every DN pair to a mode (Koontz et al. 1976, Narendra and Goldberg 1977). Speci cally, we can set the predecessor of a pair (x, y) to its neighbour (u, v) that gives the maximum slope (Fukunaga 1990). In such a way, the predecessor Pr(x, y) is de ned as: Pr(x, y)=max
G
pˆ (u, v) pˆ (x, y) ã (u x)2+(v y)2
H
(2)
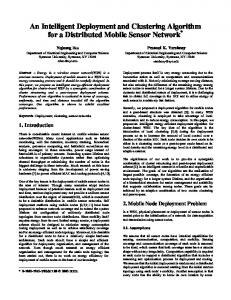
where, usually, the neighbourhood is also de ned by C(x, y). When the maximum value is negative, the (x, y) pair will contain a local mode and it is considered as a root of a tree. Hence, all pairs of DNs linked to each root will de ne a speci c spectral class. In gure 2(b) and (a) the classi ed image and the diVerent spectral classes derived by the algorithm applied to gure 1(a) are shown. 2.3. Selection of the spectral class including the object and estimation of its area Once the classi cation of the window has been carried out (see above) the object to be derived is assigned to one of the spectral classes obtained in the classi cation. a
b
c
Figure 2. (a) Bivariate plot where pairs of values of gure 1(b) assigned to the same class by the nonparametric classi er are shown with the same colour ( horizontal axis: red band, vertical axis: near-infrared band). (b) Classi ed image showing the spatial location of pixels with pairs of values assigned to the spectral classes shown in (a). (c) Final object delimitation after applying the growing algorithm. See §2.3 for an explanation of the meaning of the crosses shown. The same image used in gure 1(a) was used in this analysis.
Downloaded by [European Commission] at 08:42 27 June 2016
An algorithm to derive radiometrically homogeneous objects
1201
First, the spatial location of the digitized seed in the window is used to calculate the mean of the DN values included in the 3×3 window around it. Next, the mean values derived (for both bands) are placed in the bivariate histogram, and the class pointed is assigned as the class including the object (see the cross in gure 2(a)). Indeed, a simpler alternative could be reading the class value of the object directly from the seed located in the classi ed image (i.e. from the cross in gure 2(b)). However, taking the average DN values from the 3×3 window in the nonclassi ed image will minimize the eVect of placing the seed in a pixel of the object with unusual spectral values. Finally, any standard growing algorithm may be applied, starting where the seed is spatially located (see the cross in gure 2(b)), until the limits of the classi ed object are reached ( gure 2(c)). In fact, the speci c algorithm to use may depend on the type of objects to identify. In the speci c application of burnt area mapping, res may have several ignition points and, if they occur beside the sea, they may be spectrally mixed with the coastline (as in gure 2(b)). Hence, an algorithm that rejected linear growing and allowing the acceptance of other close patches was used to derive the re scars in the study area. Figure 2(b) and (c) illustrate how the third restriction listed in the introduction has been largely avoided (pixels of the coastline included in the same spectral class in gure 2(b) are rejected by the growing algorithm in gure 2(c)). 2.4. Selection of the optimal radius From §2.2 it is clear that the radius of the circumference (R) is the only parameter to specify when using the nonparametri c clustering described. As noted in the Introduction, the results may vary largely depending on the values of the input parameters, in this case the radius, R. To avoid the manual (and blind) input of several values of R until achieving an optimum, a procedure that takes advantag e of the algorithm working in small windows was developed. This procedure is based on the iterative execution of stages 2.2 and 2.3, starting from a small R and gradually increasing it. Speci cally, the number of pixels assigned to the object on each iteration can be used to select automatically the optimal R. Figure 3 presents the number of pixels assigned to the object as a function of R for the burnt patch of gure 1(a). Small values of R (arrow 1) lead to a low degree of smoothness of the estimated probability function and, hence, to a high number of local modes and spectral classes derived. In consequence, both the spectral class pointed by the seed and the patch derived by the growing algorithm are too small ( gure 4(a) and (b)). As R increases, the area considered as part of the object also increases (it may do it abruptly as shown in gure 3), until a local maximum is reached (arrow 2 of gure 3, gure 4(c) and (d )). At this point, the selected class has an optimal extension and is well typi ed, and the value of R is chosen automaticall y as the best. Larger values of R give an increasing weight to the main class, and the other classes become smaller, leading to a decrease in the size of the object (see arrow 3 of gure 3 and gure 4(e)–( f )). This process is continued until the small classes are completely absorbed by the main class. When this happens, the size of the object increases dramatically leading to a patch that is too big with boundaries reaching the limits of the window (arrow 4 of gure 3 and gure 4( g) and (h)). When the limits are touched the process is automaticall y stopped, and then the optimal R is given by the highest local maximum (in a mathematical sense) reached before the object touches the limit of the window (arrow 2 of gure 3).
Downloaded by [European Commission] at 08:42 27 June 2016
1202
R. Salvador and J. San-Miguel-Ayan z
Figure 3. Plot with the number of pixels assigned to the object of gure 1(a) by the described methodology as a function of the value of the radius used in the nonparametric clustering algorithm. Arrows point to diVerent stages explained in gure 4 and in the main text.
In addition to the burnt patch of gure 1(a), this semi-automatic methodology was applied to identify perimeters of other 48 burnt areas observed in the image of Greece. Some of these areas with the perimeters determined by the proposed methodology are shown in gure 5. Since there is no eld information available for these res, patches identi ed were used as a quick and preliminary estimate of the extension of res occurred in the study area in summer of 1998. 3.
Conclusions In this paper a simple semi-automatic methodology based on a nonparametric clustering algorithm is described. Since it requires the previous location of seeds inside the objects to be derived, it can be used as a more objective alternative to digitizing perimeters of spectrally homogeneous objects. On the other hand, the methodology may be coupled to another automatic procedure that releases point seeds. Nevertheless, if the seeds are located manually the process will be less automatic, more subjective and it will take more time (the selection of the window size in the beginning of the process also introduces some subjectivity to the methodology) . Although only a pair of bands has been used in the example presented, there is
Figure 4. Bivariate plots showing the spectral location of the class containing the mean DN value of the 3×3 window pointed by the seed (see the cross in gure 2(a)), and the nal extension of the object as derived by the growing algorithm. DiVerent results come from diVerent radii values. (a, b) R=2.5 (arrow 1 of gure 3), (c, d ) R=5.5 (arrow 2 of gure 3), (e, f ) R=15.0 (arrow 3 of gure 3) and ( g, h) R=20.0 (arrow 4 of gure 3). Horizontal axis: red band; vertical axis: near-infrared band in (a), (c), (e) and ( g). Study area is the same as in gure 1(a).
Downloaded by [European Commission] at 08:42 27 June 2016
An algorithm to derive radiometrically homogeneous objects
1203
a
b
c
d
e
f
g
h
Downloaded by [European Commission] at 08:42 27 June 2016
1204
R. Salvador and J. San-Miguel-Ayan z
Figure 5. Enlargement of the WiFS image of the study area (RGB: near-infrared, red, red) showing some burnt patches produced by the res that occurred in Greece during the summer of 1998. These patches are delimited by the borders of the objects derived by the methodology. This subimage shows an area of 6765 km2 located on the western part of the Peloponessus peninsula in Greece.
no restriction for a wider theoretical frame including more bands. However, some practical considerations should then be taken into account. When working with a high dimensionality, the multivariate histogram is better analysed and stored in special ways (Narendra and Goldberg 1977, Wharton 1983). In addition, the variance and bias of the Parzen estimates may increase signi cantly with the number of bands included (Fukunaga 1990). Acknowledgment This study was, in part, funded by a Marie Curie postdoctoral grant given to Raymond Salvador by the European Commission. References Fukunaga, K., 1990, Introduction to Statistical Pattern Recognition, 2nd edn (Boston: Academic Press).
An algorithm to derive radiometrically homogeneous objects
1205
Downloaded by [European Commission] at 08:42 27 June 2016
Fukunaga, K., and Hostetler, L. D., 1975, The estimation of the gradient of a density function, with applications in pattern recognition. IEEE T ransactions on Information T heory, 21, 32–40. Khotanzad, A., and Bouarfa, A., 1990, Image segmentation by a parallel, non-parametric histogram based clustering algorithm. Pattern Recognition, 23, 961–973. Koontz, W. L. G., Narendra, P. M., and Fukunaga, K., 1976, A graph-theoretic approach to non-parametric cluster analysis. IEEE T ransactions on Computers, 25, 936– 944. Mather, P. M., 1987, Computer Processing of Remotely-sensed Images (Chichester: Wiley). Narendra, P. M., and Goldberg, M., 1977, A non-parametric clustering scheme for Landsat. Pattern Recognition, 9, 207– 215. Narendra, P. M., and Goldberg, M., 1980, Image segmentation with directed trees. IEEE T ransactions on Pattern Analysis and Machine Intelligence, 2, 185–191. Richards, J. A., 1993, Remote Sensing Digital Image Analysis, 2nd edn (Berlin: Springer). Wharton, S. W., 1983, A generalized histogram clustering scheme for multidimensional image data. Pattern Recognition, 16, 193–199.