Animating multivariate dynamic social networks Michael Farrugia∗
Aaron Quigley†
University College Dublin
University College Dublin
A BSTRACT This article describes the visualization tool, developed for analysing a dynamic social network of phone calls, for the VAST 08 Mini Challenge. The tool was designed to highlight changes in the network over time using different network visual representations. We outline our experience with using the tool, and explain how certain features were helpful in the analysis process. Finally, we make some suggestions for future improvements. Keywords: Visual analytics, Dynamic social networks, Information visualization, Graph visualization 1
I NTRODUCTION
Support for visualizing network change over time, is still very limited in traditional social network analysis tools. Commonly used SNA tools such as Pajek [1], have limited support for visualizing time based networks. The user has to manually animate a sequence of images, like in a slideshow, to animate a dynamic network. Recently, Bender-deMoll and McFarland [2], started developing SoNIA, a social network image animator, in an effort to focus on visualizing social networks. 2
F EATURES
Our tool was designed to allow easy exploration and interactive animation of a dynamic network. The network can be represented at different levels of detail. At an overview level, the whole network can be visualized using a matrix representation. Then, interesting parts of the network can be zoomed in upon and explored, through a node-link representation visualization. Lastly, a micro view of the individual nodes, can be study to analyse the individual actors in the network. We aimed at giving the user ability to control different animation parameters during the animation process, to explore different animated visual features. The tool was implemented using Processing [3], which was an ideal for fast development of visualizations and interactive features. 2.1
Matrix View
The main purpose of the matrix representation is to highlight change occurring in the whole network, such as an increase in activity by a group of nodes. Matrix views in current social network analysis systems, like Pajek, have limits on the maximum size of a network that can be displayed, in matrix mode. In our visualization we overcame this, by representing edges as small 2 pixel squares. When animating the matrix view, the colour of the squares changes according to the edge activity at the animated time. The colour changes depending on the colour scheme chosen by the analyst, according to his/her highlighting requirements. Different decay functions can also be selected to control how the colour of squares fades, when they start becoming inactive. The timeline of the animation can also be dragged to a point in time to view the state of edges in the network at that time. ∗ e-mail:
[email protected]
† e-mail:
[email protected]
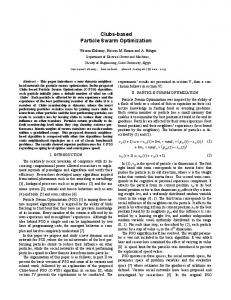
In the phone call network analysis, we found that without interaction the density of the display makes it difficult to get exact measures from the network. However, with the proper highlighting of squares and some basic interaction features like hovers on edges, it was easy to identify important changes in the network. During our analysis, the matrix view was immediately beneficial because it highlighted the introduction of very active late comers clearly. Based on the brief experience with animated matrix view, we believe that there is scope for further exploration of using dense pixel based matrix displays, to visualize dynamics of large graphs. Finding patterns in matrix displays can be improved by reordering nodes in the matrix. To facilitate this pattern discovery, we added the option of reordering nodes using a data attribute, which in our case was geography. This helped us determine if people in the same location called each other. In figure 2, the large dividing rectangles represent a different location, while the small squares are the edges. 2.2 Node link view In the node-link view, the analyst can explore any part of the network at any point in time. This view was designed to display only parts of the network, as any large network can quickly become to cluttered if visualised in this way. When a node is added to the network the ego-centric view of that network is displayed by default. Each time nodes are added, they are automatically drawn on the canvas, using a spring layout for automatic placement. The user can then expand or remove nodes by clicking on the context menu of each node. Node colouring was added to guide the analyst on which nodes to explore, when displaying only part of the network. For our analysis task we used 3 node colouring options, by node (undirected) degree, node importance (based on a classification all nodes in the network), and by node geographic location. When animating the node link view, the edges change width or colour intensity, according to the strength of the link between the nodes. As edges start decaying the edges start fading, or get removed altogether, depending on the animation settings. 2.3 Geographic Component The dataset for the mini challenge contained the location of cell towers from where each call was made. To handle this data, a geographic component was added to the visualization to explore node location change over time. The geographic component uses an underlying map of hidden nodes to represent geographic areas on the map. When a call is made from a node, the node is linked to the hidden location node. The acting spring then draws the node close to the location, effectively clustering the nodes based on geography. When nodes change their location, the edge with the old location is deleted, and a new one is created with the new location. This allows the node to move from the old location, to the new location, highlighting movement of the actors in the network. From our experience, the animation speed of this visualization should be controlled carefully, to give enough time for the node to stabilise near its location. This is especially important if nodes are changing location frequently over a short span of time. Figure 1 shows nodes 139 and 193 moving from north to south towards the end of day 5.
Figure 1: Nodes 139 and 193 moving from north to south
2.4
Animation Settings and Parameters
When exploring different animation parameters during analysis, we found that controlling what information is displayed, and for how long, is crucial for finding patterns. We provide several animation controls to allow the analyst control the speed of animation, and how edges fade. For instance, an edge can either fade completely after it decays, or else it can fade gradually, remaining visible but decreasing in prominence. The time it takes for an edge to fade, can also be manually adjusted in real time as this has a direct effect on how the network looks like. Caution must be exerted when analysing networks with fading edges because the absence of an edge does not necessarily mean that there is no link, but that the link does not exist at this point in time. 2.5 Interaction with Excel Social networks dont exist in isolation, and social network information is usually supported by other non relational data. To aid the analyst in analysing a scenario, we created a dynamic report in Excel for each actor in the network. When the ”view information” option is selected from a nodes context menu, the profile for the actor is automatically displayed in Excel. This feature is especially useful in a twin monitor setup, with the actors detail displayed on one screen, and the graph in the other. All the call records made by the queried node are also displayed, in the report. We found this to be an effective way to filter through large data sets during the exploration process. 3
C ONCLUSION AND F UTURE D EVELOPMENTS
There is scope for improving the matrix visualizations with interactive features that can make information more salient and easily identified. For instance, when an edge is selected in the matrix display, all the edges of that node can be highlighted by zooming on them, to see patterns in nodes, as well as edges. Also, the node link diagram can be added to the matrix view in a single coordinated display.
Figure 2: Matrix view permutation by geography
To get a rough idea on the usefulness of the visualization system, we presented the problem scenario to some colleagues, and provided them with a summary of findings. As interest in the problem increased, each one asked different questions about the social interaction of actors. We used the tool to answer these adhoc questions, and were satisfied that the majority of questions could be answered by using the tool. While this is no substitute for formal evaluation of the tool, we are encouraged to develop the tool further to tackle larger multi-attribute dynamic social networks. R EFERENCES [1] V. Batagelj and A. Mrvar. Pajek-Program for Large Network Analysis. Connections, 21(2):47–57, 1998. [2] S. Bender-deMoll and D. McFarland. The art and science of dynamic network visualization. Journal of Social Structure, 7(2), 2006. [3] Processing. http://processing.org.