using neural networks. In Gerald Tesauro, David S. Touretzky, and Todd K. Leen, editors, Advances in Neural Information Processing Systems 7, pages 981{.
Applications of multi-resolution neural networks to mammography Clay D. Spence and Paul Sa jda
Sarno� Corporation CN5300 Princeton, NJ 08543-5300 fcspencejpsajdag@sarno�.com
Abstract We have previously presented a coarse-to-�ne hierarchical pyramid/neural network (HPNN) architecture which combines multiscale image processing techniques with neural networks. In this paper we present applications of this general architecture to two problems in mammographic Computer-Aided Diagnosis (CAD). The �rst application is the detection of microcalci�cations. The coarse-to-�ne HPNN was designed to learn large-scale context information for detecting small objects like microcalci�cations. Receiver operating characteristic (ROC) analysis suggests that the hierarchical architecture improves detection performance of a well established CAD system by roughly 50%. The second application is to detect mammographic masses directly. Since masses are large, extended objects, the coarse-to-�ne HPNN architecture is not suitable for this problem. Instead we construct a �ne-to-coarse HPNN architecture which is designed to learn small-scale detail structure associated with the extended objects. Our initial results applying the �ne-to-coarse HPNN to mass detection are encouraging, with detection performance improvements of 20% to 40%. We conclude that the ability of the HPNN architecture to integrate information across scales, both coarse-to-�ne and �ne-to-coarse, makes it well suited for detecting objects which make have contextual clues or detail structure occuring at scales other than the natural scale of the object.
1 Introduction In a previous paper �6] we presented a coarse-to-�ne hierarchical pyramid/neural network (HPNN ) architecture that combines multi-scale image processing tech-
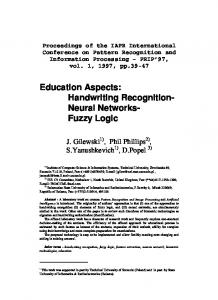
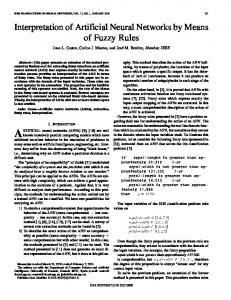
niques with neural networks to detect small objects in images (see �gure 1A). Networks operating at low resolution or coarse scale learn to detect context information. This is then passed to networks operating at high resolution to aid in the detection task. Each of the networks receives information directly from only a small part of several feature images, and so each of the networks can be relatively simple. The network at the highest resolution integrates the contextual information learned at the coarse resolution to detect the object of interest (i.e. the contextual inputs condition the probability of target present). The HPNN architecture can be extended by considering the implications of inverting the information �ow in the coarse-to-�ne archiecture. This �ne-to-coarse HPNN would have networks extracting detail structure at �ne resolutions of the image and then passing this detail information to networks operating at coarser scales (see �gure 1B). For many types of objects, information about the �ne detail structure is important for discrimination between di�erent classes. The �ne-to-coarse HPNN is therefore a natural architecture for exploiting �ne detail information for detecting extended objects. In this paper, we present our experiences in applying the HPNN framework to two problems in mammographic Computer-Aided Diagnosis (CAD )� that of detecting microcalci�cations in mammograms and that of detecting malignant masses in mammograms. The coarse-to-�ne HPNN architecture is well-suited for the microcalci�cation problem, while the �ne-to-coarse HPNN is suited for mass detection. We evaluate the performance and utility of the HPNN framework by considering its e�ects on reducing false positive rates in a well characterized CAD system. The University of Chicago (UofC) has been actively developing mammographic CAD systems for microcalci�cation and mass detection (REFS) and has been evaluating their performance clinically (REFS). A general block diagram showing the basic processing elements of these CAD systems is shown in �gure 2. First, a pre-processing step is used to segment the breast area and increase the overall signal-to-noise levels in the image. Regions of interest (ROIs ) are de�ned at this stage, representing local areas of the breast which potentially contain a cluster of calci�cations or a mass. The next stage typically involves feature extraction and rule-based/heuristic analysis, in order to prune false positives. The remaining ROIs are classi�ed as positive or negative by a statistical classi�er or neural network. One of the key requirements of CAD is that false positive rates be low enough that radiologists will not ignore the CAD system output. Critical therefore is to reduce false positive rates of CAD systems without signi�cant reductions in sensitivity. In this paper we evaluate the HPNN framework within the context of reducing the false positive rates of the UofC CAD systems for microcalci�cation and mass detection. In both cases the HPNN acts as a post-processor of the UofC CAD system.
2 Microcalci�cation detection Microcalci�cations are calcium deposits in breast tissue that appear as very small bright dots in mammograms. Clusters of microcalci�cations frequently occur around tumors. Unfortunately microcalci�cation clusters are sometimes missed, since they can be quite subtle and the radiologists can only spend about a minute evaluating a patient's mammograms. CAD systems are being developed to serve as second readers, aiding radiologists with this problem. Data used for the microcalci�cation experiments was provided by The University of Chicago. The �rst set of data consists of 50 true positive and 86 false positive ROIs. These ROIs are 99x99 pixels and digitized at 100micron resolution. A second
feature pyramid
neural networks P(t)
mammogram
Figure 1: Hierarchical pyramid/neural network architectures for (A) detecting microcalci�cations and (B) detecting masses. In (A) context is propagated from low to high resolution via the hidden units of low resolution networks. In (B) small scale detail information is propagated from high to low resolution. In both cases the output of the last integration network is an estimate of the probability that a target is present. Feature extraction Mammogram
Pre-processing
and rule-based/ heuristic analysis
Statistical/NN classifier
Cluster locations
Figure 2: Block diagram for a typical CAD detection system. set of data from the UofC clinical testing database included 47 true positives and 103 false positives, also 99x99 and sampled at 100micron resolution. We trained the coarse-to-�ne HPNN architecture in �gure 1A as a detector for individual calci�cations. For each level in the pyramid a network is trained, beginning with the network at low resolution. The network at a particular pyramid level is applied to one pixel at a time in the image at that resolution, and so produces an output at each pixel. All of the networks are trained to detect microcalci�cations, however, due to the reduced scale of the mammogram at low resolutions the microcalci�cations are not directly detectable at those pyramid levels. To achieve better than chance performance, the networks at those levels must learn something about the context in which microcalci�cations appear. To integrate context information with the other features the outputs of hidden units from low resolution networks are propagated hierarchically as inputs to networks operating at higher resolutions. Input to the neural networks come from an integrated feature pyramid (IFP ) �1]. To construct the IFP, we used steerable �lters �3] to compute local orientation energy. The steering properties of these �lters enables the direct computation of the orientation having maximum energy. We constructed features which represent, at each pixel location, the maximum energy (energy at �max ), the energy at the orientation perpendicular to �max (�max ; 90o ), and the energy at the diagonal (energy at �max ; 45o ).1 The resulting features are input into the coarse-to-�ne network hierarchy. In examining the truth data for the ROI data set, we found that the experts who 1
We found that the energies in the two diagonal directions were nearly identical.
cc 1 2 3 4 5
Az �Az .93 .94 .94 .93 .93
.03 .02 .03 .03 .03
HPNN
FPF
�FPF
.24 .21 .39 .48 .51
.11 .11 .19 .15 .06
TPF=1.0
Chicago NN
Az �Az .88 .91 .91 .90 .88
.04 .02 .03 .05 .05
FPF
�FPF
.50 .43 .48 .56 .68
.11 .10 .19 .21 .21
TPF=1.0
Table 1: Comparison of HPNN and Chicago networks. speci�ed the microcalci�cation positions often made errors in these positions of up to �2 pixels of the correct position. To take this uncertainty in position into account, we used the following error function
EUOP = ;
X
p2Pos
�
log 1 ;
Y
x2p
!
(1 ; y(x)) ;
X
x2Neg
log(1 ; y(x))
(1)
which we have called the Uncertain Object Position (UOP ) error function �5]. It is essentially the cross-entropy error, but the probability of generating a positive output on a particular example (the network's output on the example) has been replaced by the probability of generating at least one positive output in a region or set of pixels p in the image. To this we added the standard weight decay regularization term. The regularization constant was adjusted to minimize the ten-fold cross-validation error. The coarse-to-�ne HPNN was applied to each input ROI, and a probability map was constructed from the output of the Level 0 network at each pixel. This map represents the network's estimate of the probability that a microcalci�cation is at a given pixel location. Training and testing were done using as jackknife protocol �4], whereby one half of the data (25 TPs and 43 FPs) was used for training and the other half for testing. We used �ve di�erent random splits of the data into training and test sets. For a given ROI, the probability map produced by the network was thresholded at a given value to produce a binary detection map. Region growing was used to count the number of distinct detected regions. The ROI was classi�ed as a positive if the number of regions was greater than or equal to a certain cluster criterion. Table 1 compares ROC results for the HPNN and another network that had been used in the University of Chicago CAD system �7] using �ve di�erent cluster criterion (cc). Reported are the area under the ROC curve (Az ), the standard deviation of Az across the subsets of the jackknife (�Az ), the false positive fraction at a true positive fraction of 1.0 (FPF @TPF = 1:0) and the standard deviation of the FPF across the subsets of the jackknife (�FPF ). Az and FPF @TPF = 1:0 represent the averages of the subsets of the jackknife. Note that both networks operate best when the cluster criterion is set to two. For this case the HPNN has a higher Az than the Chicago network while also halving the false positive rate. This di�erence, between the two networks' Az and FPF values, is statistically signi�cant (z-test� pAz = :0018, pFPF = :00001). A second set of data was also tested. 150 ROIs taken from a clinical prospective study and classi�ed as positive by the full Chicago CAD system (including the Chicago neural network) were used to test the HPNN. Though the Chicago CAD
system classi�ed all 150 ROIs as positive, only 47 were in fact positive while 103 were negatives. We applied the HPNN trained on the entire previous data set to this new set of ROIs. The HPNN was able to reclassify 47/103 negatives as negative, without loss in sensitivity (no false negatives were introduced). On examining the negative examples rejected by the coarse-to-�ne HPNN, we found that many of these ROIs contained linear, high-contrast structure which would otherwise be false positives for the Chicago network. One possible reason for this is that the coarse-to-�ne HPNN also learns context for the false positives. The Chicago neural network presumably interprets the "peaks" on the linear structure as calci�cations. However because the coarse-to-�ne HPNN also integrates information from low resolution it can associate these \peaks" with linear structure at low resolution and thus determine that these peaks are not microcalci�cations. This is an interesting di�erence from our earlier work, in which the networks learned context associated with positive examples.
3 Mass detection Although microcalci�cations are an important cue for malignant masses in mammograms, they are not visible or even present in all cases. Thus mammographic CAD systems include algorithms to directly detect the presence of masses. We have started to apply a �ne-to-coarse HPNN architecture to detect malignant masses in digitized mammograms. Radiologists often distinquish malignant from benign masses based on the detailed shape of the mass border and the presence of spicules alone the border. Thus to integrate this high resolution information to detect malignant masses, which are extended objects, we apply the �ne-to-coarse HPNN of �gure 1B. The experimental paradigm is similar to the microcalci�cation experiments in that we apply the HPNN as a post-processor to the UofC CAD system for mass detection. The data in our study consists of 72 positive and 100 negative ROIs. The negative ROIs are false-positives of the earlier stages of the CAD system. These are 256-by256 pixels and are sampled at 200 micron resolution. At each level of the �ne-to-coarse HPNN several hidden units process the feature images. The outputs of each unit at all of the positions in an image make up a new feature image. This is reduced in resolution by the usual pyramid blurand-subsample operation to make an input feature image for the network units at the next lower resolution. We trained the entire �ne-to-coarse HPNN as one network instead of training a network for each level, one level at a time. This training is quite straighforward. Back-propagating error through the network units is the same as in conventional networks. We must also back-propagate through the pyramid reduction operation, but this is linear and therefore quite simple, up to some implementation details, such as propagating the error properly at the borders of the image. In addition we use the same UOP error function 1 used to train the coarse-to-�ne architecture. The rationale for this application of the UOP error function is that the truth data speci�es the location of the center of the mass at the highest resolution. However, as we integrate up the �ne-to-coarse architecture the coordinate information becomes uncertain due to the subsample and bluring operations. To take into account this loss of positional information as we move up the �ne-to-coarse archiecture, we use the UOP error function. The features input to the �ne-to-coarse HPNN are radial and tangential gradient components at each resolution, relative to the mass center. The center coordinates are generated by the earlier stages of the CAD system. The gradients are generated
by �rst-derivative of Gaussian �lters, proportional to ~x exp(;k~xk2 =2�2 ) where ~x is the relative displacement from the �lter center. In addition to the �lter outputs, we add the squares of the �lter outputs so the local radial and tangential image energies are available to the network. Unlike the microcalci�cation coarse-to-�ne HPNN, we did not reduce these images in size to all lower resolution pyramid levels. For example, the gradient features extracted from level 2 are provided as input only to the hidden units at level 2. Information from this level passes to level 3 only through the hidden unit outputs. The �ne-to-coarse HPNN is quite similar to the convolution network proposed by Le Cun, et al �2], however with a few notable di�erences. The �ne-to-coarse HPNN receives as input preset features extracted from the image (in this case radial and tangential gradients) at each resolution, compared to the network by Le Cun, which receives preset features only at the highest resolution. Secondly, in the �ne-to-coarse HPNN, the inputs to a hidden unit at a particular position are the pixel values at that position in each of the feature images, one pixel value per feature image. Thus the hidden units do not learn linear �lters, as they do in the Le Cun network, except as linear combinations of the �lters used to form the features. Finally the �ne-tocoarse HPNN is trained using the UOP error function, which is not used in the Le Cun network. Currently our best performing �ne-to-coarse HPNN system for mass detection has two hidden units per pyramid level. This gives an ROC area of Az = 0:82 and eliminates 32 % of the false-positives at a cost of missing 10 % of the actual positives. To improve performance further, we are investigating di�erent regularizers, richer feature sets, and more complex architectures, i.e., more hidden units. In practice the HPNN's threshold and those in the previous stages of the CAD system would have to be adjusted together to optimize performance, so even this network may give a useful improvement in the CAD system's performance.
4 Conclusion We have presented the application of multi-resolution neural network architectures to two problems in computer-aided diagnosis, the detection of microcalci�cations in mammograms and the direct detection of malignant masses in mammograms. A summary of the performance of these archiectures is given in TABLE 2. In the case of microcalci�cations, the coarse-to-�ne HPNN architecture successfully discovered large-scale context information that improves the systems performance in detecting small objects. A coarse-to-�ne HPNN has been directly integrated with the UofC CAD system for microcalci�cation detection and the complete system is undergoing clinical evaluation. In the case of malignant masses, a �ne-to-coarse HPNN architecture was used to exploit information from �ne resolution detail which could be used to di�erentiate malignant from benign masses. The results of this network are encouraging, but additional improvement is needed. In general, we have found that the multi-resolution HPNNs are a useful class of network architecture for exploiting and integrating information at multiple scales.
5 Acknowledgments This work was funded by the National Information Display Laboratory, DARPA through ONR contract No. N00014-93-C-0202, and the Murray Foundation. We would like to thank Drs. Robert Nishikawa and Maryellen Giger of The University
of Chicago for useful disccusions and the providing of the data.
References
�1] Peter Burt. Smart sensing within a pyramid vision machine. Proceedings IEEE, 76(8):1006{1015, 1988. Also in Neuro-Vision Systems, Gupta and Knopf, eds., 1994. �2] Y. Le Cun, B. Boser, J. S. Denker, and D. Henderson. Handwritten digit recognition with a back-propagation network. In David S. Touretzky, editor, Advances in Neural Information Processing Systems 2, pages 396{404, 2929 Campus Drive, San Mateo, CA 94403, 19901. Morgan-Kaufmann Publishers. �3] William T. Freeman and Edward H. Adelson. The design and use of steerable �lters. IEEE Transactions on Pattern Analysis and Machine Intelligence, PAMI13(9):891{906, 1991. �4] Charles Metz. Current problems in ROC analysis. In Proceedings of the Chest Imaging Conference, pages 315{33, Madison, WI, November 1988. �5] Clay D. Spence. Supervised learning of detection and classi�cation tasks with uncertain training data. In Image Understanding Workshop. ARPA, 1996. This Volume. �6] Clay D. Spence, John C. Pearson, and Jim Bergen. Coarse-to-�ne image search using neural networks. In Gerald Tesauro, David S. Touretzky, and Todd K. Leen, editors, Advances in Neural Information Processing Systems 7, pages 981{ 988, Massachusetts Institute of Technology, Cambridge, MA 02142, 1994. MIT Press. �7] W. Zhang, K. Doi, M. L. Giger, Y. Wu, R. M. Nishikawa, and R. Schmidt. Computerized detection of clustered microcalci�cations in digital mammograms using a shift-invariant arti�cial neural network. Medical Physics, 21(4):517{524, April 1994.