http://dx.doi.org/10.5755/j01.eie.22.6.17227
ELEKTRONIKA IR ELEKTROTECHNIKA, ISSN 1392-1215, VOL. 22, NO. 6, 2016
Classification of Knot Defect Types Using Wavelets and KNN Ibrahim Cetiner1, Ahmet Ali Var2, Halit Cetiner3 Keciborlu Vocational School, Department of Motor Cars and Transportation, 2 Faculty of Forest, Department of Forest Industry Engineering, 3 Keciborlu Vocational School, Department of Computer Technologies, Suleyman Demirel University Isparta, Turkey
[email protected]
1
the wood. The development of computer science, wood technology, and multidisciplinary works increase the solution ideas of the knot defect detection and classification. At this point, we proposed an algorithm which includes automatic defect detection methods. The algorithm is based on detection of defects, automatically classification. Automatic defect classification method is a system which is intelligent, accurate and reliable and allows the detection of knot classification and the reduction of labour costs [1]. This paper addresses the issue of the automatic quality control of a wood material. There has been a growing interest in research and improvement of the automatic quality control the wood material, especially in wood-rich countries. Because the quality control process takes a lot of time, it causes eye fatigue, low specificity, sensitivity, accuracy in the evaluation of the quality control of wood material. One of the most important issues in the evaluation of the quality control of wood material is the knot classification, because knots directly affect resistance of wood material. Because of these reasons, we automatically tried to determine the quality of the wood material [1]. Automatic defect detection methods consisted of two stages. First stage was the detection of the defects on woods. The second was the classification of the defects. These stages included the acquisition of desired wood images of finding defects, normalization of images and removal of noises, feature extraction, and classification of knot which means the digitization of defects. The images obtained from Oulu University were applied pre-processing methods including image-processing techniques. The pre-processing methods are normalization of images, removal of noises and thresholding of images. Three different thresholding methods are applied to knot images obtained from Oulu University. Three different thresholding methods are global thresholding, minimum crosswise entropy method and Otsu method. The best technique is tried to be determined by increasing the difference between foreground and background of the wood surface. Thus, we aim to make vision improvement of the knot defects apparent. Then, the regions and the distribution of the knot defects are determined using morphological methods. The determined regions are extracted. Features of these regions are extracted
defect classification methods are important to increase the productivity of the forest industry. In this respect, classification is also an important component of a pattern recognition system. Well designated classification algorithm will make recognition process more efficient and productive. Quality control is one of the most important steps among the applications that use classification. There are various techniques which are available in order to check quality of wooden material. However, display based quality control of wooden materials is still stands as a hard process. Although there are quality control methods, there are quality control problems because of the classification depending on the person’s eyestrain. We aim the reduction of labor costs. Also, we aim to achieve a more accurate and reliable way to make automatic quality classification. In this article, we proposed a method for quality control of wood material. In order to determine quality control of wooden material, knot detection algorithm which is developed using image processing techniques. This knot detection algorithm consists of several steps. These steps are morphological preprocesses in the knot preprocessing step, knot features obtained from Wavelet Moment (WM) in the feature extraction step, k nearest neighbor method (KNN) classification technique in the classification step. 1Abstract—Automatic
Index Terms—Approach coefficients; knot defect types; k nearest neighbour method; wavelet moment; wood.
I. INTRODUCTION The class quality of wood changes according to distribution and number of defects on wood. The quality of wood is generally determined by distribution of defects and number of defects. The most common type of defect is the knot reducing the resistance of a wooden part. Selection and classification of knot manually is a difficult, costly and timeconsuming process. Knot defects reduce the value of wood. Distribution and number of the knot are the important factor for quality classification of wood. There has been a growing interest in research of automatic knot defect detection and classification methods to save and improve the utilization of Manuscript received 15 April, 2016; accepted 24 September, 2016. This study was financially supported by Suleyman Demirel University “Scientific Research Project Fund” through a research project (Project No: 3126-D-12). The authors are grateful for the financial support from Suleyman Demirel University “Scientific Research Projects Fund”.
67
ELEKTRONIKA IR ELEKTROTECHNIKA, ISSN 1392-1215, VOL. 22, NO. 6, 2016 by using WM. The extracted features are classified with a classifier based on Euclidean distance with neighbouring approach. The classifier is employed for classifying seven different types of knots, including leaf knot, encased knot, dry knot, edge knot, horn knot, sound knot and decayed knot. Regarding the process of identification of knot defect types, a success at the average rate of 98 % is achieved in the study on knot database images taken from University of Oulu. In the study, determination of knot defect types and quality class of board by detection of knot defects on the floorboard in a shorter time than a sec are carried out. This time is much shorter than a human’s average identification the time of all wood defects.
An algorithm for the script recognition based on the texture characteristics is proposed. A custom oriented database which consists of some text documents written in Cyrillic, Latin and Glagolitic scripts is subjected to the proposed algorithm [8]. Back-propagation neural network has been used for the classification of RPM and oil level related gearbox faults. Also, signal was more refined in order to make the feature selection process much more accurate [9]. Zhang and Ye propose a dimensionality reduction algorithm. Because, the dimensions of wood images are high, which is difficult to deal with. They show that the practical usefulness and high scalability of proposed method for wood knot defects recognition tasks [10]. Yu-Hua et al. propose to classify four types of wood knots by using images captured from lumber boards [11]. Ruz et al. present improvements in the segmentation, feature extraction, and the classification modules for wood defect classification. Support vector machine classifier shows 91 % of correct classification on a 550 test wood image which is containing 11 defect categories [1].
II. RELATED WORKS Choosing wood by hand and its classification process is a boring and time consuming process. Mohan and Venkatachalapathy tried to classify and identify the knots on wood. Knot images were pre-processing using Hilbert Conversion and Gabor filters. Features obtained from preprocessed were compared by ‘bagging’ technique and were classified using data mining method [2]. Mahram et al. tried to identify wood knots and cracks in order to be able to classify wood. In order to be able to do this, they applied an efficient and productive classification that bases well defined pattern recognition and feature. They used three different feature extracting technique which are grey level co-occurrence matrix (GLCM), local binary pattern (LBP) and statistical moments. They used LDA and principal component analysis (PCA) in order to decrease dimension of feature. They used support vector machine (SVM) and KNN classifiers in order to be able to classify five different wood knot types [3]. Scanning of lumbers with high speed industrial computer tomography (CT) is a new approach in lumber industry and it is being mentioned that it is not an appropriate method trying to find knots in images with this approach. Johansson et al. developed a method that aims to identify knots in images of CT of lumbers in order be able to segment variable threshold valued knots in cylindrical crusts of CT images [4]. Krahenbuhl et al. present a work with knot identification problem in the three dimensional x-ray CT images of three roots. They are stating that this image type is very different from classical medical images and they have special geometric structures. They have studied about automatically finding knots by analysing wood defects on signified images [5]. The intrusion detection system presented is based on support vector machines that classify unknown data instances according both to the feature values and weight factors that represent importance of features towards the classification [6]. An innovative approach in analysis of the electroencephalographic signals. The proposed method is novel not only because of its efficiency, but also because of the choice of the applied equipment [7].
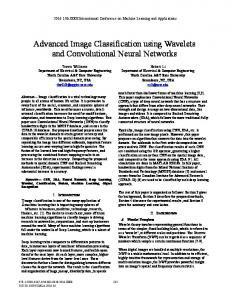
III. MATERIAL AND METHOD A. Knot Database The database shown in Fig. 1, was labelled by Oulu University Wood Technology Laboratories and published.
Fig. 1. Some samples of used knot from database.
There are 438 labelled knot images in the database shown in Fig. 1 [12]. These knot images, at the same time have 7 different knot types. B. Pattern Recognition Process Patterns must be classification with fast and high accurate rate in order to increase product output in the industrial environment. Proposed system need to make quick decision in order to create highly accurate and fast classification. Decision is, when the thinking skill of human examined, processing the images taken from outside world and describing them by symbols and making an idea about the objects when he/she sees them by using his/her know-how (data set) with these symbols. Methods have been developed in order to be able to bring human’s vision skill for computers. For example; if it is assumed that defects in a lumber image represent pattern cluster. Each pattern in this cluster needs to be represented
68
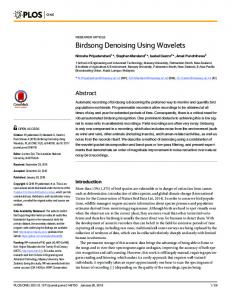
ELEKTRONIKA IR ELEKTROTECHNIKA, ISSN 1392-1215, VOL. 22, NO. 6, 2016 in a vector form that computer will be able to process, in order the computer be able to perceive. These vectors are features. The features are extracted by using a wavelet feature extraction algorithm from a lumber image. Then, the obtained features are used to classifying with KNN classifier. This process can be thought as finding knot type to separate categories from each other and best represent its own category [13]. The most representative features can give the best classification results. We should first determine the number of categories in the knot images for classification. The number shows that the patterns divided into several groups or class. Category number of knots in the images taken with camera was specified as Leaf Knot(0), Encased Knot(1), Dry Knot(2), Edge Knot(3), Horn Knot(4), Sound Knot(5) and Decayed Knot(6). Figure 2 shows the images that fall into this category knots. The images that are given as introduction, were being tried to categorize into 7 different product classes by applying process steps in Fig. 3.
translation range value in time axis. In (1), translation step in time axis can be expressed as n 0 0m depending on 0m
value. The most commonly used 0 and 0 values are 2 and 1
[14], approach and wavelet function are created by using multiples of 2, can be described such as in (2) and (3) respectively:
m,n t 2
m
m, n t 2
m
2 m t n , 2 m t n .
2
(2)
2
(3)
For a St time series that contains N piece sample which
has an i discrete time step, discrete wavelet transformation is described as in (4) Wm,n 2
m N 1 2 S
i 0
i
2
m
in .
(4)
In (4), Wm, n , 2 m has scale and 2m n time value which are wavelet transformation multiples. After these operations, two-dimensional discrete wavelet transformation function; approach and detailed information of an image with a 3th degree filtration from Daubechies ‘db2’ type are shown in Fig. 4. representatively for leaf knot.
Fig. 2. Identified knot defect types. Convert Process Wood Images
Knot Clusters
Decision Feature Extraction
Classifier
Vector Form
Fig. 3. Pattern recognition process.
6
5
4
3
2
1
0
Pattern recognition process can be thought of as five steps: image acquisition, image enhancement, image segmentation and detecting the pattern, feature extraction and classification of pattern. We focused on extracting features and classification of extracted features.
Fig. 4. Wavelet packet decomposition tree at level 3.
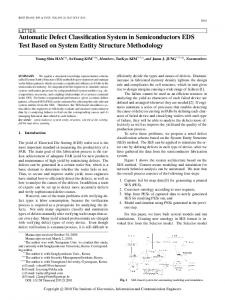
The decomposition in the Fig. 4 is obtained from discrete wavelet transform. Low frequency component, high frequency component of the main components is called approximation (A) and details (D) respectively in this decomposition. After dividing the sub bands with a standard wavelet transform, approximation component of the signal is again divided into sub-bands with the same procedure. This process is continued until it reaches the desired resolution. Daubechies db2 type decomposition plot of a leaf knot is shown in the Fig. 5. Details coefficients are consisting of horizontal, vertical and diagonal coefficients in the Fig. 6 A1, A2 and A3 represent 1st, 2nd, 3rd level of Daubechies db2 type approximation coefficients respectively. H1, H2 and H3 represent 1st, 2nd, 3rd level of Daubechies db2 type horizontal detail coefficients respectively. V1, V2 and V3 represent 1st, 2nd, 3rd level of Daubechies db2 type vertical detail coefficients respectively. D1, D2 and D3 represent 1st, 2nd, 3rd level of Daubechies db2 type diagonal detail coefficients respectively.
C. Wavelet Moment (WM) Feature Extraction Method In this study, Daubechies db2 kind discrete wavelet type was used while separating signal into its low and high frequency components. Discrete wavelet transformation creates the base of specified different kind wavelet types. Instead of making analyse in the entire scale in discrete wavelet transformation, it is being ensured that specific scale groups are identified and making analyse within this range. Function is used for discrete wavelet transformation, is given in (1)
t
m, n
t n0 0m m 2 0 0m
,
(1)
where m and n are integer, are translation parameters of wavelet in scale and time axis respectively. 0 represents a constant translation step and its value is higher than 1. 0 is
69
ELEKTRONIKA IR ELEKTROTECHNIKA, ISSN 1392-1215, VOL. 22, NO. 6, 2016
a)
b) c) Fig. 5. General demonstration with wavelet transformation for leaf knot: a) Multilevel 2-D wavelet decomposition of the leaf knot, b) approximation coefficient of db2 type 3rd wavelet decomposition, c) detail coefficient of db2 type 3 rd wavelet decomposition.
Fig. 6. Display the coefficients of approximations and details. First, Second and Third Row: 1st, 2nd, 3rd level of Daubechies db2 type approximation and details coefficients from leaf knot respectively.
IV. RESULT OF IMAGES OF KNOT WITH KNN CLASSIFICATION
their success of recognition in classification methods [15]. After the test sample x is classified using the nearest neighbour algorithm. Using KNN, a test sample is classified as a values with a positive value k neighbours. In the experimental works, classification of knots carried out by k is taken 8 in this study
In the evaluation, wood knots are formed by using images of 438 labelled knots. The chosen knot types; as Leaf Knot, Encased Knot, Dry Knot, Edge Knot, Horn Knot, Sound Knot and Decayed Knot. Dataset consists of labelled image of knot’s each class. Success rates are analysed according to classification with KNN of knot features obtained from DM method, are reported in the experiments. It can display that it will either represent or not represent the interested field in a special object or an image, which is a task of a classifier. Classifier must be trained with sample images beforehand, in order to be able to successfully do this. The classifier being used in this study conducted, is first being trained in order to be able to identify difference or types among separated samples. Detailed study steps are shown in Fig. 7. Their features are extracted from images using DM methods. 108 features are obtained by Daubechies db2 and 3 level from specified feature extraction methods. Percentage accuracy rate is tried to be identified by dividing identified knot number to total number in knot clusters; in identification of features obtained from specified feature extraction methods,
D C
N
2
f j x f j C . j 1
(5)
In the feature vector N, it indicates the number of features.
f j x x represents the test sample of the j th features. f j C , represents the j th features of the C th classes. KNN is used to classify test knot samples. Features for each knot image are obtained by using Daubechies db2 and 3. Euclidean distance is calculated between the test samples and k neighbours. Euclidean distance formula is given in (5). Features with training, test, verification and total past time periods of 1260 total knot images obtained from DM algorithms are given in Table I and Table II.
70
ELEKTRONIKA IR ELEKTROTECHNIKA, ISSN 1392-1215, VOL. 22, NO. 6, 2016 We conclude that using Daubechies db2 and 3, for KNN classifiers with 8 neighbours achieves much better results than [3] and [16].
TABLE I. TIME PARAMETERS OBTAINED BY KNN CLASSIFICATION. Time Parameters Training Algorithm Test duration Verification Duration (second) duration (second) (second) KNN 104.9212 7.9981 0.0035
V. CONCLUSIONS Proposed algorithm is applied on a database that contains wood knot types. Firstly, the preprocessing methods are applied on knot images in the database. The pre-processing methods provide the realization of the width and height adjustments of images. Then, features of knots images are extracted using DM algorithm. The best DM type is determined by trial and error. We identified that approximation coefficients contain more meaningful data from the detail coefficients. The determined approximation coefficients are used in the classification step. The KNN classification algorithm is preferred in the next step. Because training phase of KNN algorithm is completed in a short time. Neighbour number is determined by trial and error. The neighbour number of KNN classification algorithm is 8. At the end of the study knot images are being able to be classified into seven different knot types with a success rate of 98 %. Usage of DM feature extraction and KNN method will be appropriate in a design of a machine that can be created with micro-processor, micro-supervisor and programmable logic circuits; in the processes of automatic defect identification and removal of defects as a real-time, without human, in flooring woods with a study that can be conducted in the future.
TABLE II. RECOGNITION RATE AND TOTAL TIME OBTAINED BY KNN CLASSIFICATION. Recognition and Time Parameters Algorithm Recognition Total time (second) Rate (%) KNN
98
112.9229
ACKNOWLEDGMENT This study was made use of Phd. Thesis by Ibrahim Cetiner in the Graduate School of Natural and Applied Sciences, Suleyman Demirel University, Isparta, Turkey. The design and development of study was proposed and supervised by Ahmet Ali Var. Algorithm analysis, manuscript drafting and modified the draft were performed by Halit Cetiner.
Fig. 7. Classification steps of knots with KNN classifier.
Table III shows that compare the results of proposed algorithms with the recently presented methods in [3] and [16] for the same database.
REFERENCES [1]
TABLE III. COMPARISON OF PROPOSED METHOD CLASSIFICATION ACCURACY WITH PREVIOUS METHODS. Recognition and Time Parameters Authors Recognition Rate (%) Total time (second) Proposed
98
112.9229
91
-
87.7
-
[16]-DWT+MLP
87.0
-
[16]-DWT+MLP
83.1
-
[16]-Cluster-based wavelet features+PNN [16]- Cluster-based wavelet features+MLP
[3]-Sm
81.7
-
[3]-Glcm
94.37
-
[3]-Lbp
95.78
-
[3]-Glcm+Sm
94.37
-
[17]-BPNNs
91.6
-
[2]
[3]
[4]
[5]
71
G. A. Ruz, P. A. Estevez, P. A. Ramirez, “Automated visual inspection system for wood defect classification using computational intelligence techniques”, Int. Journal of Systems Science, vol. 2, pp. 163–172, 2009. [Online]. Available: http://dx.doi.org/ 10.1080/00207720802630685 S. Mohan, K. Venkatachalapathy, “Wood knot classification using bagging”, Int. Journal of Computer Applications, vol. 51, no. 18, pp. 50–53, 2012. [Online]. Available: http://dx.doi.org /10.5120/8146-1937 A. Mahram, M. G. Shayesteh, S. Jafarpour, “Classification of wood surface defects with hybrid usage of statistical and textural features”, in 35th Int. Conf. IEEE Telecommunications and Signal Proc. (TSP 2012), pp. 749–752, 2012. [Online]. Available: http://dx.doi.org/10.1109/TSP.2012.6256397 E. Johansson, D. Johansson, J. Skog, M. Fredriksson, “Automated knot detection for high speed computed tomography on Pinus sylvestris L. and Picea abies (L.) Karst. using ellipse fitting in concentric surfaces”, Computers and electronics in agriculture, vol. 96, pp. 238–245, 2013. [Online]. Available: http://dx.doi.org/10.1016/j.compag.2013.06.003 A. Krahenbuhl, B. Kerautret, I. Debled-Rennesson, F. Longuetaud, F. Mothe, “Knot detection in x-ray ct images of wood”, in Advances in Visual Computing, pp. 209–218, 2012. [Online]. Available: http://dx.doi.org/10.1007/978-3-642-33191-6_21
ELEKTRONIKA IR ELEKTROTECHNIKA, ISSN 1392-1215, VOL. 22, NO. 6, 2016 [6]
N. Macek, B. Dordevic, V. Timcenko, M. Bojovic, M. Milosavljevic, “Improving intrusion detection with adaptive support vector machines”, Elektronika ir Elektrotechnika, vol. 20, no. 7, pp. 57–60, 2014. [Online]. Available: http://dx.doi.org/10.5755/ j01.eee.20.7.8025 [7] A. Kawala-Janik, M. Pelc, M. Podpora, “Method for EEG signals pattern recognition in embedded systems”, Elektronika ir Elektrotechnika, vol. 21, no. 3, pp. 3–9, 2015 [Online]. Available: http://dx.doi.org/10.5755/j01.eee.21.3.9918 [8] D. Brodic, Z. N. Milivojevic, A. Amelio, “Analysis of the south Slavic scripts by run-length features of the image texture”, Elektronika ir Elektrotechnika, vol. 21, no. 4, pp. 60–64, 2015. [Online]. Available: http://dx.doi.org/10.5755/j01.eee.1.4.12785 [9] T. Waqar, M. Demetgul, C. Kelesoglu, “Fault diagnosis on bevel gearbox with neural networks and feature extraction”, Elektronika ir Elektrotechnika, vol. 21, no. 5, pp. 69–74, 2015. [Online]. Available: http://dx.doi.org/10.5755/ j01.eee.21.5.13334 [10] Z. Zhang, N. Ye, “A novel nonlinear dimensionality reduction method for robust wood image recognition”, IEEE (IJCBS), pp. 533– 536, 2009. [Online]. Available: http://dx.doi.org/10.1109/IJCBS. 2009.55 [11] I. Yu-Hua Gu, H. Andersson, R. Vicen, “Wood defect classification based on image analysis and support vector machines”, Wood Sci Technol, vol. 44, pp. 693–704, 2009. [Online]. Available:
http://dx.doi.org/10.1007/s00226-009-0287-9 [12] O. Silven, Laboratory of Wood Technology Helsinki University of Technology, Finland VTT Building Technology: Wood Technology, 2009. [Online]. Available: http://www.ee.oulu.fi/research/imag /knots/KNOTS/ [13] T. Olmez, Z. Dokur, “Uzman Sistemlerde Oruntu Tanima”, ITU, Elektronik ve Haberlesme Muhendisligi Bolumu, pp. 325, Istanbul, 2009. (in Turkish). [14] J. Lampinen, S. Smolander, M. Korhonen, “Wood surface inspection system based on generic visual features”, in Int. Conf. Artificial Neural Networks (ICANN), 1995, vol. 95. [15] I. Cetiner, “Determination using image processing techniques of quality classes of wood floorboards produced from red pine according to knot factor”, Ph.D. dissertation, Suleyman Demirel University in Turkey, 2014. [16] G. Yu, S. V. Kamarthi, “A cluster-based wavelet feature extraction method and its application”, Engineering Applications of Artificial Intelligence, pp. 196–202, 2010. [Online]. Available: http://dx.doi.org/10.1016/j.engappai.2009.11.004 [17] A. Marcano-Cedeno, J. Quintanilla-Dominguez, D. Andina, “Wood defects classification using artificial metaplasticity neural network”, in 35th Annual Conf. IEEE Industrial Electronics, 2009, pp. 3422– 3427. [Online]. Available: http://dx.doi.org/10.1109/IECON. 2009.5415189
72