Journal of Imaging Science and Technology® 52(1): 010501–010501-10, 2008. © Society for Imaging Science and Technology 2008
Color Embedding and Recovery Based on Wavelet Packet Transform Kyung-Woo Ko, Oh-Seol Kwon, Chang-Hwan Son and Yeong-Ho Ha䉱 School of Electrical Engineering and Computer Science, Kyungpook National University, 1370 Sankyuk-dong, Buk-gu, Taegu 702-701, Korea E-mail:
[email protected]
Abstract. Colorization algorithms, which hide color information in gray images and find them to recover color images, have recently been developed. In these methods, it is important to minimize the loss of original information while the color components are embedded and extracted. In this article, we propose a colorization method using a wavelet packet transform in order to embed color components with minimum loss of original information. In addition, the compensation processing of color saturation in the recovered color images is achieved. In the color-to-gray process, an input redgreen-blue image is converted into Y, Cb, and Cr images, and a wavelet packet transform is applied to the Y image. After analyzing the amounts of total energy for each subband, color components are embedded into two subbands including a minimum amount of energy on the Y image. This makes it possible not only to hide color components in the Y image, but to recover the Y image with minimum loss of original information. In the gray-to-color process, the color saturation of the recovered color images is decreased by the printing and scanning process. To increase color saturation, the characteristic curve between printer and scanner, which can estimate the change of pixel values before and after the printing and scanning process, is used to compensate the pixel values of printed and scanned gray images. In addition, the scaling method of the Cb and Cr components is applied to the gray-to-color process. Through the experiments, it is shown that the proposed method improves both boundary details and color saturation in the recovered color images. © 2008 Society for Imaging Science and Technology. 关DOI: 10.2352/J.ImagingSci.Technol.共2008兲52:1共010501兲兴
INTRODUCTION Despite the availability of color printers, black-and-white printers are still widely used in offices, schools, and homes. However, once colors are converted into grayscales, it is generally impossible to recover the color information because the information of an original image is lost during the blackand-white printing process. To solve this problem, colorization algorithms that can recover color from a gray image have been developed.1–10 Colorization algorithms can be divided into two types. The first type involves adding arbitrary colors to monochrome images for discrimination regardless of the colors of the original images.4,5 The second type involves recovering colors that are similar when compared with the original image. A general method of recovering original colors uses the 䉱
IS&T Member.
Received Apr. 11, 2007; accepted for publication Oct. 10, 2007; published online Feb. 8, 2008. 1062-3701/2008/52共1兲/010501/10/$20.00.
statistics of luminance distribution between a monochrome target image and a reference color image.6–8 The red-greenblue (RGB) values of a target image and a reference image are both transformed into a luminance channel and two chromatic channels, and the statistics of luminance distribution between monochrome target images and reference color images are compared. Then, the chromatic information of the best matching region in the reference image is transferred to the target region. Consequently, a monochrome target image can be colorized. In this method, the recovered colors of a target image can be made approximate to the original image. However, since this method uses reference images, it is impossible to recover the colors exactly as in the original image. To recover colors that are as similar as those of the original image, Queiroz and Braun proposed a new colorization method that uses a wavelet transform.1,2 The main idea of this method is to embed color information from a gray image and to recover color image by extracting color information. The process of embedding and extracting color information is implemented using a wavelet transform. The color information of the Cb and Cr components is embedded into the vertical, horizontal, and diagonal subbands of the wavelet transformed Y image, and a new gray image is obtained using an inverse wavelet transform. After receiving the printed and scanned gray image, the decoder can then recover the colors using the wavelet transform again. However, boundary details are more or less lost in the recovered color image because the algorithm uses high-pass vertical, horizontal, and diagonal subbands in order to embed the color information. Also, color saturation is somewhat decreased because the pixel values of the new gray image are changed by the printing and scanning process. In this article, a colorization method using a wavelet packet transform is proposed. A wavelet packet transform is applied to Y image in order to divide it into 16 subbands, and the amounts of total energy for each subband are analyzed. Then, Cb and Cr images are embedded into the two subbands, including minimum information on the Y image in order to recover the Y image with minimum loss of boundary details. In the gray-to-color process, to enhance the color saturations of the recovered color image, the characteristic curve that is obtained between the printer and scanner is used. This characteristic curve is able to compen010501-1
Ko et al.: Color embedding and recovery based on wavelet packet transform
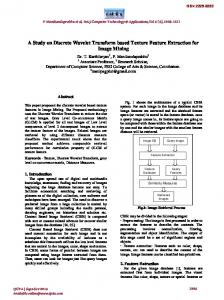
Figure 1. Diagrams of two-dimensional wavelet and wavelet packet transform: 共a兲 filter bank and resulting decomposition of wavelet transform and 共b兲 filter bank and resulting decomposition of wavelet packet transform.
sate for the change of pixel values between the printing and scanning process. In addition, to enhance color saturation more, we perform a scaling of Cb and Cr components using the maximum and minimum values of the Cb and Cr components of an original image. COLORIZATION METHOD USING WAVELET PACKET SUBBANDS Analysis of Wavelet Packet Subbands In a wavelet transform, an image is decomposed into a set of band limited components, called subbands, which can be reassembled to reconstruct the original image without error.11 Meanwhile, in a wavelet packet transform, the signal is passed through more filters than in a wavelet transform.12 For example, in a wavelet transform, each level is calculated by passing the previous approximation subbands through high- and low-pass filters. However, in a wavelet packet transform, the approximation and detail (vertical, horizontal, and diagonal) subbands are both decomposed. Thus, for 010501-2
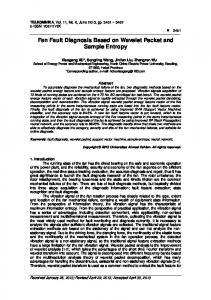
Figure 2. Test sample images to investigate the amount of information for each subband: 共a兲 test, 共b兲 lena, 共c兲 balloon, 共d兲 baboon, 共e兲 fruit, and 共e兲 temple.
n levels of decomposition, a wavelet packet transform produces different sets of subbands. Figure 1 shows diagrams of a two-dimensional wavelet and wavelet packet transform. In the proposed colorization algorithm, we used a four-level wavelet packet transform applying the perfect reconstruction filter family of quadrature mirror filters11 as follows: 1 1 ˆ 共z兲 = 关H 共z兲G 共z兲 + H 共z兲G 共z兲兴X共z兲 + 关H 共− z兲G 共z兲 X 0 0 1 1 0 0 2 2 + H1共− z兲G1共z兲兴X共− z兲,
共1兲
where H0, H1, G0, and G1 are Z-transformed versions of h0, h1, g0, and g1, respectively. For error-free reconstruction of ˆ 共z兲 = X共z兲, the input, X H0共z兲 = H02共z兲 − H02共− z兲 = 2 H1共z兲 = H0共− z兲 G0共z兲 = H1共− z兲 G1共z兲 = − H0共− z兲.
共2兲
J. Imaging Sci. Technol. 52共1兲/Jan.-Feb. 2008
Ko et al.: Color embedding and recovery based on wavelet packet transform Table I. Amount of information for each subband. Subbands Vertical
Horizontal
Test
Lena
Balloon
Baboon
Fruit
Temple
Approximation
0.72
1.23
1.51
1.76
1.06
1.54
Vertical
1.16
1.70
1.76
2.23
1.35
2.11
Horizontal
0.21
0.82
1.10
1.69
0.82
1.19
Diagonal
0.50
1.05
1.20
2.04
1.07
1.56
Approximation
0.88
0.69
1.21
2.44
1.95
2.44
Vertical
0.20
0.61
1.00
2.13
1.12
1.61
Horizontal
0.96
0.89
1.46
2.63
3.55
3.28
Diagonal
0.51
0.88
1.10
2.27
1.57
1.92
Figure 3. Process of color-to-gray algorithm.
Figure 4. Process of recovering colors from a textured gray image.
Each subband has the information of an original image, but the amount of information in each subband is different. In order to investigate the amount of information for each subband, test sample images are used, as shown in Figure 2. The amount of information is represented by the ratio of the subband energy to the total energy as follows:
J. Imaging Sci. Technol. 52共1兲/Jan.-Feb. 2008
subband energy Ei =
total energy
⫻ 100,
共3兲
where Ei denotes the amount of energy for each subband. Table I shows the amount of information for each subband of the Y channel. We can confirm that two subbands with minimum information of an original image are the horizontal subband of a vertical subband and the vertical subband of a horizontal subband. Therefore, we used these two sub010501-3
Ko et al.: Color embedding and recovery based on wavelet packet transform
bands in order to embed color information in the proposed colorization method. Color-to-Gray Algorithm An input RGB image is converted into Y, Cb, and Cr images, and a wavelet packet transform is applied to the Y image to divide it into 16 subbands. The general method of converting RGB into YCbCr uses a 3 ⫻ 3 conversion matrix as follows:
冢冣冢 Y
0.30
0.59
Cb = − 0.17 − 0.33 Cr
0.50
0.11 0.50
冣冢 冣
− 0.42 − 0.08
R
G .
共4兲
B
A four-level wavelet packet transform is applied to the Y image, which is the luminance component of an input image. The Y image is then divided into four subbands, and each subband is divided into four subbands again. As a result, 16 subbands, including the information of the original Y image, are created. As each subband has the information of the original image, the Y image can be reconstructed by applying an inverse wavelet packet transform. However, the amount of information in each subband is different and as already mentioned, the subbands with minimum information are the horizontal subband of the vertical subband and the vertical subband of the horizontal subband. Using the previous property, the Cb and Cr images are resized and embedded respectively into these two subbands with minimum information on the Y image. Then the inverse wavelet packet transform is carried out, and a new gray image with texture is obtained. The new gray image with the Cb and Cr information of the original color image has textures, where the color information appears as various texture patterns according to the Cb and Cr components. Figure 3 shows the process of the color-to-gray algorithm using two subbands with the minimum information of the original Y image among the 16 subbands. Gray-to-Color Algorithm The method of recovering colors from the new gray image with texture is performed using a reverse process of the previous color-to-gray algorithm. The printed textured gray image is scanned and divided into 16 subbands using a wavelet packet transform. Then the Cb and Cr components are extracted from the horizontal subband of the vertical subband and the vertical subband of the horizontal subband, and an inverse wavelet packet transform is used to reconstruct the Y image. At this time, the subbands with the Cb and Cr information are padded by zeros, because the original information is lost in the color-to-gray process. Nonetheless, the details of the reconstructed Y image are almost the same quality as those in the original Y image by using the subbands with minimum information. The extracted Cb and Cr components are interpolated to make the size the same as the original image. The RGB image is then reconstructed by combining the Y image with the Cb and Cr images. Figure 4 shows the process of recovering colors from a textured gray image. 010501-4
Figure 5. 共a兲 Gray patches used to obtain the characteristic curve and 共b兲 characteristic curve of the printer and scanner 共HP LaserJet 2200DN printer and HP ScanJet 7400C scanner兲.
Compensation of Color Saturation When a textured gray image is printed and scanned, the pixel values (8 bits: 0–255) of the textured gray image are generally changed by the inherent characteristics of the printer and scanner. This effect leads to a loss of color saturation in the recovered color images because the values of the embedded Cb and Cr components are also changed by the printing and scanning process. In order to compensate for the loss of color saturation in the recovered color image, two methods are applied. First, we use the gray patches that are composed of 256 gray levels (0–255) to obtain the inherent characteristic curve of the printer and scanner. These gray patches are also printed and scanned with the textured gray image. Then the pixel values of each patch can be obtained. As a result, the inherent characteristic curve of the printer and scanner can be created by matching the values of J. Imaging Sci. Technol. 52共1兲/Jan.-Feb. 2008
Ko et al.: Color embedding and recovery based on wavelet packet transform
Figure 6. Process of compensating color saturations using the characteristic curve.
each gray patch between the printing and scanning process. Figure 5(a) shows the gray patches that are needed to obtain the characteristic curve, and Fig. 5(b) shows the characteristic curve that was obtained by the aforementioned method using the HP LaserJet 2200DN printer and HP ScanJet 7400C scanner. The fitted characteristic curve is given by y = 0.6009x + 16.647. Using this curve, the pixel values of the scanned textured gray image are compensated. Figure 6 shows the process of compensating the color saturation of the recovered color image using the characteristic curve of the printer and scanner. Next, in order to compensate for the loss of color saturation, scaling Cb and Cr components are used in the grayto-color process. At this time, we assume that the maximum and minimum values of the Cb and Cr components for an original color image are known. These values can be given in an appendix. The absolute values of the extracted Cb and Cr in the gray-to-color process are generally smaller than the absolute values of the Cb and Cr of an original image. Therefore, we can improve the loss of color saturation by scaling the values of the extracted Cb and Cr components, as follows:
再
compensated Cb = ␣ · Cb compensated Cr = ␣ · Cr
冎
for positive values of Cb and Cr J. Imaging Sci. Technol. 52共1兲/Jan.-Feb. 2008
再
compensated Cb =  · Cb compensated Cr =  · Cr
冎
for negative values of Cb and Cr,
再冏 冏 冏 冏冎 再冏 冏 冏 冏冎
␣ = min
 = min
Cbmax,o Cbmax,e
Cbmin,o Cbmin,e
,
,
共5兲
Crmax,o Crmax,e
Crmin,o Crmin,e
,
共6兲
where ␣ and  are the scaling factors for the positive and negative values of Cb and Cr components, respectively. Cbmax,o and Crmax,o denote the maximum Cb and Cr values of an original image, and Cbmin,o and Crmin,o denote the minimum Cb and Cr values of an original image. Cbmax,e and Crmax,e are the maximum Cb and Cr values extracted from a gray image, and Cbmin,e and Crmin,e are the minimum Cb and Cr values extracted from a gray image. Figure 7 shows the diagram of the scaling Cb and Cr components for the printed and scanned gray image. Figure 8 shows the flowchart of the proposed colorization method. EXPERIMENTAL RESULTS AND DISCUSSION Figure 9 shows the test images used in the conventional and proposed methods. In the experiments, a modified conven010501-5
Ko et al.: Color embedding and recovery based on wavelet packet transform
Figure 7. Diagram of scaling Cb and Cr components.
Figure 9. Test images: 共a兲 balloon and 共b兲 fruit.
Figure 8. Flowchart of the proposed colorization method.
tional method was used to allow the proposed method to be compared with the best conventional method. The modified conventional method is more robust to decode opposite colors caused by a small image shift, as the chrominance information is divided into four planes, Cr+, Cr−, Cb+, and Cb−, which are then embedded into the vertical, diagonal, horizontal, and diagonal of the approximation subbands, respectively.1,2 To obtain and compare the textured gray images including color information, we used a wavelet transform and a wavelet packet transform. Figures 10(a) and 10(b) show the textured gray images using the conventional and proposed method, respectively. To better show texture details, enlarged images are also shown in Figs. 10(c) and 10(d). In the conventional method, four subbands (vertical, horizontal, diagonal, and diagonal of approximation) are used to embed the Cb and Cr components. Therefore, the textures that are changed according to the Cb and Cr components appear as visible patterns in the new gray image. On the other hand, textures are less visible in the proposed method. This is because we used only two subbands (horizontal subband of the vertical subband and vertical subband of the horizontal subband) to embed the Cb and Cr components, and the area 010501-6
Figure 10. Comparison of textured gray images: 共a兲 textured gray image using the conventional method, 共b兲 textured gray image using the proposed method, 共c兲 and 共d兲 enlarged partial images of 共a兲 and 共b兲 respectively, for closer inspection.
that is used for embedding color components is much smaller than that of the conventional method. Figure 11 shows the recovered color images from the textured gray images. In this experiment, we applied the colorization algorithms by means of a computer simulation without the real printing and scanning process. This means that we can avoid image warping, rotation, and pixel regisJ. Imaging Sci. Technol. 52共1兲/Jan.-Feb. 2008
Ko et al.: Color embedding and recovery based on wavelet packet transform
Figure 11. Comparison of recovered color images from the textured gray images: 共a兲 recovered color image using the conventional method and 共b兲 recovered color image using the proposed method.
tration problems, which originate from the real printing and scanning process.1,2 Therefore, we are able to recover color images that are almost the same as the original images. Figure 11(a) shows the recovered color image using the conventional method, while Fig. 11(b) shows the recovered color image using the proposed method. In the conventional method, because the Cb and Cr components were just embedded into the vertical, horizontal, diagonal, and diagonal of approximation subbands, a loss of boundary details occurred. However, the recovered color images using the proposed method are almost the same as those of the original image due to the use of subbands with minimum information. This made it possible to recover the color image with a minimum loss of original information. Figure 12 shows the frequency domains of the Y channels for the recovered color images. This confirms that the proposed method can improve boundary details when compared with the conventional method. We used a twodimensional discrete Fourier transform (DFT), which was applied to the Y channels of the recovered color images. The two-dimensional DFT for an image is given by Eq. (7): 1 F共u,v兲 =
m−1 n−1
兺 y=0 兺 f共x,y兲e−j2共ux/m+vy/n兲 ,
mn x=0
共7兲
where f共x , y兲 denotes the Y channel of an image, and m ⫻ n denotes image size. Figure 12(a) is the frequency domain of the original image, Fig. 12(b) is the frequency domain of the recovered image using the conventional method, and Fig. 12(c) is the frequency domain of the recovered image using the proposed method. In the figures, high frequency regions are lost in the conventional method because J. Imaging Sci. Technol. 52共1兲/Jan.-Feb. 2008
Figure 12. Comparison of frequency domains 共balloon兲: 共a兲 frequency domain of the original image, 共b兲 frequency domain of the recovered image using the conventional method, and 共c兲 frequency domain of the recovered image using the proposed method.
the subbands, including boundary details, are used for embedding color components. However, the frequency domain of the proposed method is almost the same as the original frequency domain because of the use of two subbands with minimum information for embedding the color components. In a textured gray image, Cb and Cr information appears as various texture patterns by means of a wavelet transform or wavelet packet transform, and these patterns exist as high frequency information. However, a joint photographic experts group (JPEG) operation destroys some high frequency information, thereby distorting the embedded color information. A halftoning operation is also unable to express the details of textured patterns in a textured gray image, making the quality of the recovered color image very coarse. To confirm the effect of image processing operations, such as JPEG and halftoning, these operations were applied to textured gray images obtained using the conventional and proposed color-to-gray method, and the recovered color images are shown in Figures 13 and 14, respectively. Figures 13(a) and 14(b) show the color images recovered from the textured gray images without any image processing operations, while Figs. 13(b) and 14(b) show the color images recovered from the textured gray images after applying a JPEG operation, and Figs. 13(c) and 14(c) show the color images recovered from the textured gray images after applying a halftoning operation. Table II then presents a comparison of the peak signal-to-noise ratio (PSNR) values to analyze the effect of the JPEG and halftoning operations by Eq. (8):
冉冑 冊 255
PSNRk = 20 log10
MSEk
k = R,G,B,
共8兲
010501-7
Ko et al.: Color embedding and recovery based on wavelet packet transform
Table II. Comparison of PSNR values to analyze the effect of the JPEG and halftoning operations.
Conventional method
Processing operations
PSNR 关dB兴 共RGB兲
PSNR 关dB兴 共Average兲
None
R: 27.48
27.46
G: 27.79 B: 27.14 JPEG
R: 26.54
26.68
G: 27.33 B: 26.25 Halftoning
R: 17.18
17.30
G: 20.34 B: 15.61 Proposed method
None
R: 29.26
28.93
G: 33.50 B: 26.56 JPEG Figure 13. Effect of image processing operations on conventional method: 共a兲 color image recovered from textured gray image, 共b兲 color image recovered from textured gray image 共JPEG image兲, and 共c兲 color image recovered from textured gray image 共halftoned image兲.
R: 26.73
26.92
G: 30.59 B: 25.09 Halftoning
R: 16.03
15.49
G: 19.66 B: 13.10
Figure 14. Effect of image processing operations on proposed method: 共a兲 color image recovered from textured gray image, 共b兲 color image recovered from textured gray image 共JPEG image兲, and 共c兲 color image recovered from textured gray image 共halftoned image兲.
1 MSEk =
mn
m−1 n−1
储Ok共i,j兲 − Rk共i,j兲储2 , 兺 兺 i=0 j=0
where 共i , j兲 are the coordinates of an m ⫻ n image, and k is the RGB color channels. O共i , j兲 and R共i , j兲 denote the pixel 010501-8
values of an original image and a recovered color image, respectively. The decreases in PSNR values were 0.78 dB and 10.16 dB with the conventional method, and 2.01 dB and 13.44 dB with the proposed method, indicating that the conventional colorization method was more robust to this type of attack than the proposed colorization method, as the textured patterns of the proposed method were more complicated than those of the conventional method. In other words, the textured gray image with the proposed method had much more high frequency information than that with the conventional method. Figure 15 shows the color images recovered from printed and scanned textured gray images. In this experiment, the color saturation of the recovered color images is decreased due to the change in pixel values between the printing and scanning process. Therefore, the quality of the recovered color images is worse than that without the printing and scanning process. However, in order to improve the color saturation of the recovered color images, we used the characteristic curve of the printer and scanner (HP LaserJet 2200DN printer and HP ScanJet 7400C scanner) to compensate for pixel values. Next, the scaling method of the Cb and Cr components are used. Figure 15(a) shows the color image recovered using the conventional method, Fig. 15(b) shows the color image recovered using the proposed method without the compensation algorithm, Fig. 15(c) shows the color image recovered using the proposed method with the compensation algorithm when applying the characteristic curve, J. Imaging Sci. Technol. 52共1兲/Jan.-Feb. 2008
Ko et al.: Color embedding and recovery based on wavelet packet transform
Table III. Comparison of PSNR values between the conventional and proposed methods.
Conventional method
PSNR 共dB兲 共RGB兲
PSNR 共dB兲 共Average兲
R: 13.52
15.20
G: 17.06 B: 15.76 Proposed method
Without compensation
R: 12.44
14.99
G: 17.57 B: 16.87 Compensation 共scaling Cb and Cr兲
R: 14.31
16.43
G: 17.94 B: 18.20
Compensation 共use of characteristic curve兲
R: 18.78
19.35
G: 24.08 B: 17.53
Compensation 共both compensation methods兲
R: 21.51
21.93
G: 25.14 B: 20.40
Figure 15. Color images recovered from printed and scanned gray images: 共a兲 color image recovered using conventional method, 共b兲 color image recovered using proposed method without compensation algorithm, 共c兲 color image recovered using proposed method with compensation algorithm when applying characteristic curve, 共d兲 color image recovered using proposed method with compensation algorithm when scaling Cb and Cr components, and 共e兲 color image recovered using proposed method with both compensation algorithm.
Fig. 15(d) shows the color image recovered using the proposed method with the compensation algorithm when scaling the Cb and Cr components, and Fig. 15(e) shows the color image recovered using the proposed method with both compensation algorithms. To verify the performance of the proposed algorithm, we calculated the PSNR values for each image. Table III shows a comparison of PSNR values between the conventional and proposed methods. The PSNR value of the conventional method is 15.20 dB. For the recovered color image using the proposed method without the compensation algorithm, the PSNR value is 14.99 dB. The methods of scaling the Cb and Cr components and the use of the characteristic curve are 16.43 dB and 19.35 dB, respectively. On the other hand, the recovered color image via the application of both compensation methods is 21.93 dB. Consequently, our experimental results confirm that the proposed method with the compensation algorithms can improve the color saturation in recovered color images. J. Imaging Sci. Technol. 52共1兲/Jan.-Feb. 2008
CONCLUSION This article proposed a colorization method that used wavelet packet subbands including minimum information in order to embed color components. In the color-to-gray process, a wavelet packet transform was applied to the Y image in order to divide it into 16 subbands, and the Cb and Cr images were then embedded into two subbands that include minimum information on the Y image. In the gray-to-color process, the printed textured gray image was scanned and divided into 16 subbands using a wavelet packet transform in order to extract the Cb and Cr components, and an inverse wavelet packet transform was used to reconstruct the Y image. The details of the reconstructed Y image are almost the same as those of the original Y image because subbands with minimum information were used to embed the Cb and Cr components. To improve the loss of color saturation during the gray-to-color process, the characteristic curve between printer and scanner and scaling the Cb and Cr components were used. Consequently, the proposed method can improve boundary details and color saturation in recovered color images. ACKNOWLEDGMENTS This work is financially supported by the Ministry of Education and Human Resources Development, the Ministry of Commerce, Industry, and Energy, and the Ministry of Labor through the fostering project of the Lab of Excellency. REFERENCES 1
R. L. de Queiroz and K. M. Braun, “Color to gray and back: Color embedding into textured gray images”, IEEE Trans. Image Process. 15, 1464–1470 (2006). 2 K. M. Braun and R. L. Queiroz, “Color to gray and back: Color embedding into textured gray images”, Proc. IS&T/SID 13th Color 010501-9
Ko et al.: Color embedding and recovery based on wavelet packet transform Imaging Conference (IS&T, Springfield, VA, 2005) pp. 120–124. M. Chaumont and W. Puech, “A color image hidden in a grey-level image”, CGIV 2006 Final Program and Proceedings (IS&T, Springfield, VA, 2006) pp. 226–231. 4 V. Tsagaris and V. Anastassopoulos, “Fusion of visible and infrared imagery for night color vision”, Displays 26, 191–196 (2005). 5 M. Vilaseca, J. Pujol, and M. Arjona, “Color visualization system for near-infrared multispectral images”, J. Imaging Sci. Technol. 49, 246–255 (2005). 6 T. Chen, Y. Wang, V. Schillings, and C. Meinel, “Grayscale image matting and colorization”, Proc. ACCV2004 (Springer, Jeju, Korea, 2004) pp. 1164–1169. 7 T. Welsh, M. Ashikhmin, and K. Mueller, “Transferring color to grayscale 3
010501-10
images”, Proc. ACM SIGGRAPH (ACM, San Antonio, TX, 2002) pp. 277–280. 8 A. Toet, “Colorizing single band intensified nightvision images”, Displays 26, 15–21 (2005). 9 T. Horiuchi and H. Kotera, “Colorization algorithm for monochrome image sequences using optical flow”, Proc. IS&T/SID 12th Color Imaging Conference (IS&T, Springfield, VA, 2005) pp. 140–143. 10 T. Horiuchi and H. Kotera, “Colorization for monochrome image with texture”, Proc. IS&T/SID 13th Color Imaging Conference (IS&T, Springfield, VA, 2005) pp. 245–250. 11 R. C. Gonzalez and R. E. Woods, Digital Image Processing (Prentice Hall, New York, 2002). 12 WIKIPEDIA, wavelet packet decomposition, http://en.wikipedia.org/.
J. Imaging Sci. Technol. 52共1兲/Jan.-Feb. 2008