ETASR - Engineering, Technology & Applied Science Research
Vol. 3, No. 6, 2013, 544-548
544
Discharges Classification using Genetic Algorithms and Feature Selection Algorithms on Time and Frequency Domain Data Extracted from Leakage Current Measurements D. Pylarinos
K. Theofilatos
K. Siderakis
E. Thalassinakis
Dr-Ing Electrical & Computer Engineer, Researcher/Consultant, Greece
[email protected]
Pattern Recognition Lab, Computer Engineering and Informatics Dpt, University of Patras, Greece
[email protected]
Electrical Engineering Dept., School of Applied Technology, Technological Educational Institute of Crete, Greece
[email protected]
Islands Network Operation Department, Hellenic Electricity Distribution Network Operator S.A., Greece
[email protected]
Abstract— A number of 387 discharge portraying waveforms recorded on 18 different 150 kV post insulators installed at two different Substations in Crete, Greece are considered in this paper. Twenty different features are extracted from each waveform and two feature selection algorithms (t-test and mRMR) are employed. Genetic algorithms are used to classify waveforms in two different classes related to the portrayed discharges. Five different data sets are employed (1. the original feature vector, 2. time domain features, 3. frequency domain features, 4. t-test selected features 5. mRMR selected features). Results are discussed and compared with previous classification implementations on this particular data group. Keywordsinsulators; leakage current; discharges; classification; frequency; genetic algorithms; mRMR; t-test
I.
INTRODUCTION
High Voltage insulators are an important component of a power system, as its integrity and reliability depends on their performance. The selection of insulator design and material is performed based on local conditions with pollution being probably the most important factor [1-3]. Pollution is a well known problem experienced by all power systems, in various degrees, and several techniques can be applied to deal with the phenomenon [4]. As power networks keeps involving and demands increase, research and automatic monitoring of insulators’ performance becomes an issue of increased importance. Leakage current monitoring is a well established technique for monitoring and assessing the performance of insulators during the research/testing stage and also during normal operation [5]. Although, lab tests are widely conducted, and have been standardized e.g. [6-8], field monitoring and testing is also important as the phenomenon is highly localized and environmental conditions can not be reproduced in the lab. Therefore, measurements are also conducted on already www.etasr.com
installed insulators [5] but also in specially designed open air test stations [9]. Field measurements require long term monitoring which means that a vast amount of data has to be recorded and/or interpreted. To bypass this problem, the usual approach is not to record the raw measurement (i.e. the waveform of the leakage current) but to extract, record and study values such as the peak value, the charge and the number of pulses exceeding pre-defined thresholds [5]. However, it is widely accepted that it is the actual shape of the leakage current waveform that is correlated to the experienced electrical activity and the basic stages of activity have been well correlated with certain waveform shapes during lab tests [5, 1012]. Recent research has shown that although similar shapes should be expected in the field [13-14], field waveforms are far more complex and thus, values as the ones mentioned above may be misleading [13-15]. Therefore, research has also focused in the application of signal processing and pattern recognition techniques in order to automate the classification of field leakage current waveforms [13-15]. In this paper, field waveforms portraying discharges are classified in two different classes using Genetic Algorithms (GAs). The classification is performed using twenty features, commonly used in the literature [5], that equally represent the time and the frequency domain (ten features from each domain). Fourier and wavelet analysis are used for the extraction of the frequency domain features. The time and frequency domain features are used separately and combined, and thus three different feature sets are defined. Further, two different feature selection algorithms (t-test and mRMR) are applied on the twenty features set, producing two additional sets. Finally, the GA classification is performed on these five different feature sets. Assessment and monitoring of High Voltage insulators is of great importance for the Hellenic Electricity Distribution Network Operator S.A. especially regarding the network in islands such as Crete and Rhodes [4]. Insulators installed in
Pylarinos et al.: Discharges Classification using Genetic Algorithms and Feature Selection Algorithms…
ETASR - Engineering, Technology & Applied Science Research
these islands experience intense marine pollution due to the proximity of the network to the sea and the experienced weather conditions, while subjected to relatively high levels of voltage [4, 16]. Therefore, a large project to battle the phenomenon has been initiated. Several different techniques have been applied over the years [4, 16-17] with the large application of RTV SIR coatings being the most dominant one, with significant economic benefits [18]. The latest part of this project is the construction and operation of TALOS High Voltage Test Station [19-21] which provides further potential that include the technical background for long term waveform monitoring, utilizing past research on waveform identification and classification [13-15, 22]. II.
545
order to acquire the STD_MRA VECTOR [23, 24]. The STD_MRA VECTOR contains the standard deviation (STD) of the details of each level of the wavelet multiresolution analysis (MRA) of the original waveform, with D1 referring to the first decomposition level, D2 to the second level etc [13, 15]. The distortion ratio [5] given by: DR
D1 D2 D3 D4 , is also D5
calculated. The frequency bands of the STD_MRA VECTOR’s components are shown in Table II.
SET-UP AND MEASUREMENT SITES
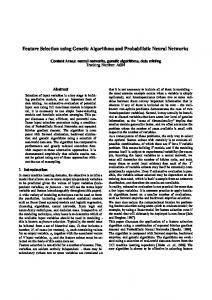
Eighteen different 150 kV post insulators (porcelain, RTV SIR coated and composite) have been monitored for more than six years. The insulators were part of the grid, installed at 150 kV Substations [20]. A collection ring was installed at the bottom of each insulator and the current was driven through a Hall current sensor to acquire the measurement. The data was then transmitted to a commercially available Data Acquisition system (DAQ). Each waveform recorded has a time length of 480 ms with a sampling rate of 2 kHz. Detailed specifications for the DAQ can be found in [14]. Regarding waveform recording, the DAQ used the time-window technique in order to cope with the data size problem, which means that a single waveform was recorded during a pre-specified time window (e.g. a day), and the waveform selected was the one portraying the largest peak value [15, 22]. A number of 387 discharge portraying waveforms are used as the data set in this paper. To isolate discharge waveforms from sinusoids and noise, the techniques described in [13, 15, 22] were applied. A schematic representation, pictures from the measuring system and also from the sites are shown in Figure 1. III.
Vol. 3, No. 6, 2013, 544-548
EXTRACTED FEATURES AND WAVEFORM CLASSES
The waveforms in the considered data set have been preclassified in two different classes, depending on the duration of discharges. Class A includes waveforms that portray discharges that last four halfcycles or less (170 waveforms) and class B includes waveforms that portray discharges that last five or more halfcycles (217 waveforms). The feature set used for the classification consists of 20 different features, shown in Table I. Features 1-10 derive from the time domain, and features 1120 from the frequency domain, and have been chosen in order to evenly represent both domains and also considering the literature [5]. Regarding time domain features, frequently used values such as the amplitude and charge, along with commonly used statistical values are employed. Regarding the feature domain features, it was considered that the content of odd harmonics is commonly correlated to the occurrence of discharges and to the distortion of the waveforms’ shape and therefore several commonly used odd harmonic ratios [5] are employed. It should be noted that the fundamental frequency is 50Hz and that the HD ratio is similar to the THD ratio, with the numerator being the sum of the odd harmonics’ content. Further, wavelet analysis and especially MRA is employed in www.etasr.com
a Fig. 1.
b
a. A schematic representation of the measuring set up and b. pictures from the installation
TABLE I. No. 1 2 3 4 5 6 7 8 9 10
Feature
FEATURE SET
No.
Feature
Amplitude Mean Median Variance
11 12 13
Standard Deviation Median Absolute Deviation
15
Third to First Harmonic Ratio Fifth to First Harmonic Ratio Fifth to Third Harmonic Ratio Total Harmonic Distortion Ratio (THD) Harmonic Distortion Ratio (HD) STD_MRA VECTOR Ratio: D1/D5
14
Skewness
16 17
Kurtosis
18
Interquartile Range Charge
19 20
TABLE II. Decomposition Level 1 2 3 4 5 6
STD_MRA VECTOR D2/D5 STD_MRA VECTOR D3/D5 STD_MRA VECTOR D4/D5 Distortion Ratio: DR
Ratio: Ratio: Ratio:
FREQUENCY BANDS OF MRA
(A) Approximation (Hz)
(D) Details (Hz)
0~500 0~250 0~125 0~62.5 0~31.25 0~15.625
500~1000 250~500 125~250 62.5~125 31.25~62.5 15.625~31.25
Pylarinos et al.: Discharges Classification using Genetic Algorithms and Feature Selection Algorithms…
ETASR - Engineering, Technology & Applied Science Research
IV.
FEATURE SELECTION ALGORITHMS & EMPLOYED FEATURE SETS
Two different feature selection algorithms are employed on the 387 feature vectors that contain 20 features each. One univariate, the student’s t-test [25-26] and one multivariate, the minimum Redundancy Maximum Revelance (mRMR) algorithm [27]. The main principle in both techniques is the calculation of a feature relevance score and the removal of lowscoring features. T-test or student’s T-test [25-26] is one of the simplest, oldest and most famous feature selection algorithms. The basic idea is to calculate ti and the degrees of freedom and check whether the significance of the ti value is high enough for each feature according to a standard table. The ti value and the degrees of freedom are given by various equations depending on the form of the data, with the form regarding unequal sample sizes and unequal variance being used in this paper. The t-test algorithm selected the features {1, 3~11, 13~17, 19~20]. In contrast to univariate techniques, multivariate ones examine the features as groups and not as single unities. The minimum Redundancy - Maximum Relevance (mRMR) algorithm [27] is a recently developed feature selection algorithm. Being a multivariate method, mRMR is capable of taking advantage of the complex dependencies between features. Its goal is to select a feature subset that illustrates the minimum redundancy between the selected features and the maximum relevance to the classes. Several values can be employed to calculate redundancy and relevance, with the mutual information being used in this paper. The mRMR algorithm selected the features {3, 5, 7, 8, 11, 13, 15, 16, 18, 19} The classification is finally performed on five different feature sets, (time-domain features, frequency domain features, all features, t-test features and mRMR features) as shown in Table III V.
CLASSIFICATION USING GENETIC ALGORITHMS
Genetic Algorithms (GAs) are general search metaheuristic algorithms based on the initial creation of a population of candidate solutions, called chromosomes, and their iterative differentiation using the operators of evaluation, selection, crossover and mutation until some termination criteria are reached [28]. GAs have been proved useful and efficient in optimization problems where the search space is big and complicated or there is not any available mathematical analysis of the problem. Further, the ability to define a different fitness function for each problem, and the flexibility of GAs to function deploying various representations of candidate solutions have enabled their extensive use in a variety of problems. In the present paper, we applied GAs for the classification of the waveforms in the pre-defined two classes, using five different data sets as shown in Table III. In order to achieve this linear classification, the two centers of the two classes should be determined. After the estimation of these centers is achieved, each waveform is classified in the class for which it has the minimum Euclidean distance from its center. www.etasr.com
Vol. 3, No. 6, 2013, 544-548
546
A simple GA is employed to solve this optimization problem [29]. The examined data set were firstly normalized. The candidate solutions of a genetic algorithm consist of 2*N genes whose values range from [0-1] with N being the number of features which are used as inputs. The initial population of the applied genetic algorithm was created by randomly initializing a number of candidate solutions. The optimal number of these solutions was found through experimentation using the training set to be equal to 100. The evaluate the performance of the proposed solutions we used the following fitness function: Fitness= Accuracy + Geometric Mean where
accuracy
is
the
classification
(1) accuracy
and
Geometric Mean= sensitivity*specificity. The Geometric Mean was included to the fitness function as our dataset is imbalanced towards one class.
The selection mechanism which was deployed is the probabilistic roulette wheel selection combined with an elitism mechanism which reassures that the best solution found so far will not be lost through the evolutionary process. The variation operators which were used in the proposed approach are the two points crossover operator and the Gaussian mutation operator. The two points crossover probability was applied with probability 90% while the Gaussian mutation operator with probability 10%. The Gaussian mutation probability simply adds to a selected for mutation gene a random value taken from a Gaussian distribution with center equal to zero and distribution equal to 0.1. The steps of evaluation, selection, crossover and mutation are applied iteratively until 1000 iterations are reached or the convergence criterion is satisfied. The convergence criterion is satisfied if the performance of the best member of the population is less than 5% away than the average performance of the population. In this case, the population is deemed as converged and most of the times if the algorithm is not terminated no new good solutions will be found. VI.
RESULTS & DISCUSSION
Results on the independent test set which consists of half our dataset are shown in Table III for all five feature sets. Classification accuracy ranges from 54.97% to 68.41%. The worst results are achieved when using the time domain feature set (54.97%), and they are only slightly improved when using all features (56.12%). Using only the frequency domain features provides further improvement (56.82%), which is more increased when using the mRMR (60.2%) and the student’s t-test (68.41%) feature sets. This shows that adding more features is not necessarily helping the classification, but that what is important is the selection of features, which can provide significant improvement to the classification process. It is also shown that the best results are achieved when using the student’s t-test feature set, even though the mRMR algorithm is
Pylarinos et al.: Discharges Classification using Genetic Algorithms and Feature Selection Algorithms…
ETASR - Engineering, Technology & Applied Science Research
more sophisticated and recent algorithm. This should be attributed to the fact that a linear classification algorithm is used, and therefore a univariate feature selection algorithm (i.e. one that examines each feature separately) is bound to provide better results than a multivariate one (i.e. one that examines group of features). In addition, it should be noted that recent research has shown that other classification algorithms perform better [12], however this should largely be attributed to the selection of the feature set. When GAs are applied for both feature selection and classification, accuracy can be significantly increased (88.48%) [30], however still be slightly inferior compared to Support Vector Machines (SVMs) (90.21%) [13]. An added problem that should be noted here is the absence of an insight to the classification process as both SVMs and GAs operate similarly to a black-box classifier. Therefore, the next step of the project is the implementation of a hybrid system that will use SVMs for the classification, GAs for the optimization of the feature set and system’s parameters, and fuzzy logic in order to produce comprehensive rules describing the classification process [31].. TABLE III.
Vol. 3, No. 6, 2013, 544-548
algorithms that were applied in this paper, although still slightly inferior to Support Vector Machines classification. A significant issue in any case, is the absence of a description regarding the classification process. Therefore, future work focuses on the implementation of a hybrid support vector fuzzy inference system for the classification of leakage current waveforms portraying discharges, in order to achieve higher accuracy and also acquire an insight to the classification process through the definition of fuzzy rules describing the classification. REFERENCES [1] [2]
[3] [4]
FEATURE SETS AND CLASSIFICATION RESULTS
[5] Feature Set
I
II
III
IV t-test
TD
FD
All
{1~10}
{11~20}
{1~20}
54.97%
56.82%
56.12%
Features
GA’s Accuracy
V mRMR
{3, 5, 7, 8, {1, 3~11, 11, 13, 15, 13~17, 16, 18, 19~20} 19} 68.41
[6] [7]
[8]
60.20 [9]
VII. CONCLUSION & FUTURE WORK Investigation and monitoring of the performance of High Voltage insulators is of crucial importance for the integrity and reliability of power systems. Leakage current measurements are widely applied as a research, assess and monitoring tool, both in lab and field conditions. Experienced electrical activity is correlated to the shape of the leakage current waveform. However, managing leakage current waveforms, especially in the field where long term monitoring is required, is a rather complex task. In this paper, a novel approach is performed for the classification of discharge portraying waveforms: twenty different features are extracted, feature selection is performed and Genetic Algorithms are employed for the classification. The features used equally represent the time and the frequency domain. One univariate (t-test) and one multivariate (mRMR) feature selection algorithm are employed. The classification is performed on five different feature sets (time domain features, frequency domain features, t-test selected features, mRMR selected features, all features,). Overall results show the significance of feature selection for classification performance and achieved accuracy. Further, it is shown that the feature set selected by the univariate algorithm provides the best results, which is attributed to the linearity of the classification algorithm. Comparison with previous implementations hints that using GAs for feature selection may provide significantly better results than the commonly used feature selection www.etasr.com
547
[10]
[11]
[12]
[13]
[14]
[15]
[16]
[17]
IEC/TS 60815, Selection and dimensioning of high-voltage insulators intended for use in polluted conditions, 2008 CIGRE WG 33-04, “The measurement of site pollution severity and its application to insulator dimensioning for a.c. systems”, Electra Vol. 64, p. 101-116, Cigre, 1979 CIGRE WG 33-04, TF 01, A review of current knowledge: polluted insulators, CIGRE, 1998 K. Siderakis, D. Pylarinos, E. Thalassinakis, E. Pyrgioti, I. Vitellas, “Pollution maintenance techniques in coastal high voltage installations”, Engineering, Technology & Applied Science Research, Vol. 1, No. 1, pp. 1-7, 2011 D. Pylarinos, K. Siderakis, E. Pyrgioti “Measuring and analyzing leakage current for outdoor insulators and specimens”, Reviews on Advanced Materials Science, Vol. 29, No. 1, pp. 31-53, 2011 IEC 60507, Artificial pollution tests on high-voltage insulators to be used on a.c. systems, 1991 IEC 60587, Electrical insulating materials used under severe ambient conditions-Test methods for evaluating resistance to tracking and erosion, 2007) IEC 62217, Polymeric insulators for indoor and outdoor use with a nominal vlotage > 1000 V – General definitions, test methods and acceptance criteria, 2005 CIGRE WG B2.03, Guide for the establishment of naturally polluted insulator testing stations, CIGRE, 2007 M. A. R. M. Fernando, S. M. Gubanski, “Leakage current patterns on contaminated polymeric surfaces”, IEEE Trans. Dielectr. Electr. Insul., Vol. 6, No. 5, pp. 688–694, 1999 T. Suda, “Frequency characteristics of leakage current waveforms of an artificially polluted suspension insulator”, IEEE Trans. Dielectr. Electr. Insul., Vol. 8, pp. 705–709, 2001. J. Li, W. Sima, C. Sun, S. A. Sebo, “Use of Leakage Current of Insulators to Determine the Stage Characteristics of the Flashover Process and contamination Level Predicition”, IEEE Trans. Dielectr. Electr. Insul., Vol. 17, No. 2, 2010 D. Pylarinos, K. Theofilatos, K. Siderakis, E. Thalassinakis, I. Vitellas, A. T. Alexandridis, E. Pyrgioti, “Investigation and classification of field leakage current waveforms”, IEEE Transactions on Dielectrics and Electrical Insulation, Vol. 19, No. 6, pp. 2111-2118, 2012 D. Pylarinos, K. Siderakis, E. Thalassinakis, E. Pyrgioti, I. Vitellas, “Investigation of leakage current waveforms recorded in a coastal high voltage substation”, Eng. Technol. Appl. Sci. Res., Vol. 1, No. 3, pp. 6369, 2011 D. Pylarinos, K. Siderakis, E. Pyrgioti, E. Thalassinakis, I. Vitellas, “Impact of noise related waveforms on long term field leakage current measurements”, IEEE Transactions on Dielectrics and Electrical Insulation, Vol. 18, No. 1, pp. 122-129, 2011 S. Gubanski, “Greek Power Company Evaluates Alternatives to Combat Pollution in Transmission System on Crete”, Insulator News & Market Report (INMR), Issue 58, Volume 10, Number 4, p. 30, 2002 INMR, “Greek Utility Battles Pollution Affecting Island Transmission System”, Insulator News & Market Report (INMR), Issue 78, Volume 15, Number 4, p. 24, 2007
Pylarinos et al.: Discharges Classification using Genetic Algorithms and Feature Selection Algorithms…
ETASR - Engineering, Technology & Applied Science Research
Vol. 3, No. 6, 2013, 544-548
548
[18] E. Thalassinakis, “Greek Utility Assesses Economics of RTV Silicone Coatings as Measure to Combat Pollution”, Insulator News & Market Report (INMR), Issue 64, Volume 12, Number 2, p. 66, 2003 [19] INMR, “Greek utility readies to energize new insulator test station”, Insulator News & Market Report, Issue 82, Volume 16, Number 4, p. 32, 2008 [20] D. Pylarinos, K. Siderakis, E. Thalassinakis, I. Vitellas, E. Pyrgioti, “Recording and managing field leakage current waveforms in Crete. Installation, measurement, software development and signal processing”, ISAP 16th International Conference on Intelligent System Applications to Power Systems, Hersonissos, Crete, Greece, September 25-28, 2011 [21] TALOS High Voltage Test Station, www.talos-ts.com [22] D. Pylarinos, K. Siderakis, E. Thalassinakis, E. Pyrgioti, I. Vitellas, S. L. David, “Online applicable techniques to evaluate field leakage current waveforms”, Electric Power Systems Research, Vol. 84, No. 1, pp. 6571, 2012 [23] S. G. Mallat, A wavelet tour of signal processing, Academic Press, 1999. [24] S. G. Mallat, “A theory for multiresolution signal decomposition: the wavelet representation”, IEEE Trans. Pattern Analysis and Machine Intelligence, Vol. 11, pp. 674-693, 1989. [25] R. A. Johnson, G. K. Bhattacharyya, Statistics: principles and methods, John Wiley & Sons Inc, 6th Edition, 2010 [26] S. Welleck, Testing statistical hypothesis of equivalence, Chapman & Hall, CRC, 2003 [27] H. Peng, F. Long, C. Ding, “Feature selection based on mutual information: criteria of max-dependency, max-relevance, and minredundancy”, IEEE Trans. Pattern Anal. Mach. Intell., Vol. 27, No. 8, pp. 1226-1238, 2005. [28] J. Holland, Adaptation in natural and artificial systems : an introductory analysis with applications to biology, control, and artificial intelligence, Cambridge: Mass ;MIT Press, 1995. [29] Z. Michalewicz, Genetic algorithms + Data Structures = Evolution Programs, Springer-Verlag, 3rd edition, 1996. [30] D. Pylarinos, K. Theofilatos, K. Siderakis, E. Pyrgioti, T. Papazoglou, I. Vitellas, E. Thalassinakis, "Feature selection and classification of field leakage current waveforms using genetic algorithms", CIGRE Symposium 2013 Lisbon, Portugal, April 22-24, 2013 [31] K. Theofilatos, D. Pylarinos, S. Likothanassis, D. Melidis, K. Siderakis, E. Thalassinakis, S. Mavroudi, “A hybrid support vector fuzzy inference system for the classification of leakage current waveforms portraying discharges”, Electric Power Components and Systems (accepted for publication)
www.etasr.com
Pylarinos et al.: Discharges Classification using Genetic Algorithms and Feature Selection Algorithms…