DYNAMIC CHANGE MONITORING OF FOREST RESOURCE BY USING REMOTE SENSING AND MARKOV PROCESS IN LOESS PLATEAU OF CHINA Qiao Yuliang a, *, Zhao Shangmin b, Liu Binyan a a
Taiyuan University of Technology, West District Xigao Donglou Dongdanyuan 1201, Taiyuan, Shanxi, China, 030024 -
[email protected],
[email protected] b Xinjiang Institute of Ecology and Geography Chinese Academy of Science, Urumchi, Xinjiang, China, 830011
[email protected] Commission VII, WG VII/5 KEY WORDS: Multi-Spectral Remote Sensing, Change Detection, Image Understanding, Spatial Analysis, Forestry, Markov Process, Dynamic Monitoring
ABSTRACT: This study applies remote sensing technology combined with Markov Process to monitor and forecast the dynamic change of forest resource in Chinese Loess Plateau. At first, according to the dynamic change maps of the forest resource from remote sensing data in three different phases–1978、1987 and 2000, the transitions among the forest resource types in the Daning County ---a key pilot area of “ the Three North Protection Forest Project ” in Chinese Loess Plateau are acquired by combining the different remote sensing information sources during those different phases. Then, the transition probability matrices at the two primary states (1978 and 1987) are established accordingly. Based on the transition probability matrices, we can simulate and forecast the forest dynamic transformation pattern and the forest-transforming tendency in the future periods. The results of the research prove that, this method is worth widely popularized, by which the conditions of the forest resources can be monitored and the dynamic change tendency of the forest resources can be forecasted simply and quickly so as to explore a scientific, rational and effective way to rectify the territory of China, improve the ecological environment and promote the development of national economy. This is most scholars are scarce of when they do similar monitoring or prediction.
1. INTRODUCTION As the main body of terrestrial ecological system, forest is the indispensable resource for human to improve the environment and boost habitation quality. With the rapid development of society and economy, people have to face severe challenge of gradually decreasing forest resource and continually deteriorated environment. Application of remote sensing technology to monitoring the dynamic change of forest resource in Loess Plateau with quite fragile ecology and badly erosive soil, therefore, has increasingly important significance in developing Chinese national economy, protecting ecology and forecasting the change of world environment (Qiao Yuliang, 2000). Forest resource, however, is a complex biological, ecological and economical system. Hence, it changes at any time because of its own movement law and outer environment effect, such as nature, society and economy. So it is difficult to monitor and forecast the dynamic change of forest resource in a specified area (Zhang Sanli, 1999).
With the rapid development of remote sensing and GIS technology, model analysis and forecast have enhanced its application in dynamic monitoring of resource and environment and become an important research field of Geo-information Science (Qiao Yuliang, 2002). Based on remote sensing materials in different periods, the dynamic change monitoring of forest resource, and simulation, analysis and forecast of its transforming and developing tendency in future by using Markov Process are of important significance.
2. RESEARCH METHOD In this research, taking the example of Daning County, a key pilot area of “the Three North Protection Forest Project” in China’s Loess Plateau, we obtain a series of forest resource maps in different periods according to visual interpretation of remote sensing images in reference to the geographical data. By analyzing the transitional data among the forest types in every different period and deciding the initial transition probability matrices of corresponding transition among different forest types, the dynamic transforming process of forest types can be simulated and the transforming tendency in future can be forecasted by using Markov Process.
Markov Process is a model which is appropriate to monitor the change and predict the tendency of forest resource in the future periods according to the acquired data in the known periods. It is a simple tool which processes data according mathematical theory regardless of its internal complex structure. In our research, we can check up the correction of our forecast result because we have data at three phases. So the data at the third phase can examine the prediction results based on the data of the former two phase. This can prove the validity of this model in our research. Then we can forecast the forest resource by using the latter two phase data. Moreover, because the probability we calculate is annual mean transformation. So we can acquire the forecast data at any year after the third phase.
2.1 Research Area Daning County is located at the west foot of the Lvliang Mountain in Shanxi Province. It belongs to the Torso Plateau and donga area of the Loess Plateau and its geomorphology is 815
The International Archives of the Photogrammetry, Remote Sensing and Spatial Information Sciences. Vol. XXXVII. Part B7. Beijing 2008
types. That’s because in certain conditions, the dynamic transformation of forest types possesses the property of Markov Process:
mainly composed of various kinds of loess platforms, ridges, hills and valleys. The Xinshui River and Yiting River run through the county. Both banks of the two rivers are plain and smooth terrain. This county belongs to the warm temperature zone of continental climate with four seasons clearly demarcated under the influence of monsoon and drought with less rainfall all the year round. The total land area is 9672 hm2 with rare natural vegetation spreading unevenly.
1. 2.
In certain district, there exist mutual transitions among different forest types. The process of mutual transitions among different forest types contains more things that can’t be depicted by functions.
2.2 Information source Because of the above, we choose Markov Process to carry out the research.
In this research, we selected the 1:10,000 black-and-white aerial photographs in 1978, 1:55,000 color infrared black-and-white aerial photographs in 1981, Landsat TM images in 1987, 1:5000 color infrared aerial photographs in 1998, Landsat TM images and CBERS-1images in 2000(These images were taken in autumn) as the main information source. At the same time, we also collected local investigation and statistic data of forest resource.
3. THE ESTABLISHMENT OF TRANSITIONAL PROBABILITY MATRICES The key to the utilization of Markov Process is establishment of the initial transitional probability matrices P of the mutual transition among different forest type, whose formula usually is:
2.3 Acquisition of the forest type maps in different periods In the classification system of forest vegetation in Daning County, the land is divided into Natural forest, Manual forest, Sparse forest, Shrubbery and Non-forest.
P=
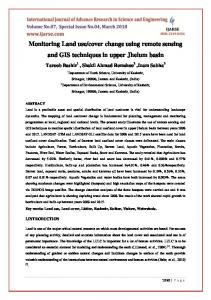
Based on above information source and classification system, the forest type maps are worked out in three different periods through interpretation, checking, revising and transfer drawing, which are the foundation for further research. The Figure 1 is one of the maps which are typical to represent the results of visual interpretation. It vividly reflects the change and transitional condition in the period of 1978~1987 in Danning County.
p11 p 21
... ...
p12 p 22
p1m p 2m
...
...
...
...
p m1
p m2
...
pm m
(1)
where m = the number of the forest types pij = the probability of the forest type i which transits to the forest type j 0≤pij≤1;
N
∑P
ij
=1.
j =1
In Geo-science research, the transitional probability is usually replaced by the transitional frequency. The foundation of this research is the forest type maps in different periods, so it is appropriate to use transitional frequency per year among different forest types to replace its transitional probability (Li Decheng, 1995). The transitional probability of forest type in three different periods can be obtained with the method of combination on the forest type maps in corresponding periods, as shown in Table 1. In Table 1, there exist two number in left and right slash of every square, the numbers in left and right slash represent the mutual transitional situations among forest types in the periods of 1978-1987 and 1987-2000 respectively; the number in the i line represents the area of the forest type i which transits to other forest types in the two periods, and the number in the j column represents the area of other forest types which transit to the forest j in the two periods. The number in the square with the same row and column represents the area of the forest type which doesn’t transit during the two periods.
Figure 1. Dynamic change map of forest resource in Danning County (1978~1987) 2.4 Brief introduction of Markov Process Markov Process is a kind of probability model, which is used in studying dependent events. It takes study target as an independent system. In a series of defined temporal intervals, the situation of the system at the latter moment (called t2) can be inferred according to probability and based on the known situation at the former moment (called t1).
According to Table1, the transitional probability (the transitional frequency per year) of mutual transition among forest types in two periods can be worked out. That is, Table 2, the transition probability matrices in primary states of the year 1978 and 1987 can be obtained with the same explanation with Table1.
In Markov Process, the linear Markov Process is preferable and simple. This kind of transition process demands that the situation of the system at t2 moment only relates to that at t1 moment, but doesn’t relate to that at any moments before t1. It is suitable in studying the dynamic transformation of forest
816
The International Archives of the Photogrammetry, Remote Sensing and Spatial Information Sciences. Vol. XXXVII. Part B7. Beijing 2008
Land Type
Natural forest Manual forest Sparse forest Shrubbery Non-forest
Natural forest Manual forest Sparse forest Shrubbery Non-forest ∑
673/668 0/0 2/6 3/35 1/128 679/837
0/0 40/240 48/13 1/2 153/442 242/697
3/2 7/4 10/5 1/1 0/0 2/1 250/320 10/3 3/1 20/25 440/440 12/1 69/66 46/28 7878/7241 343/414 503/475 7905/7249
∑
%
693/679 43/242 313/343 476/503 8147/7905 9672/9672
7.17/7.02 0.45/2.50 3.24/3.55 4.91/5.20 84.23/81.73 1/1
Table 1. Transition among forest types during 1978-1987-2000 in the Daning County (hm2) Land Types Natural forest Manual forest Sparse forest Shrubbery Non-forest
Natural forest Manual forest Sparse forest Shrubbery Non-forest 9968/9987 0/0 7/14 7/53 0/12
0/0 9922/9994 170/29 2/3 21/43
5/2 11/5 16/6 26/33 0/0 52/3 9776/9948 36/7 11/2 47/38 9916/9904 28/2 10/6 6/3 9963/9935
∑ 1/1 1/1 1/1 1/1 1/1
Table 2. Transition probability matrices in primary states of the year 1978 and 1987(×10-4) increased 242 hm2 and forest cover ratio has increased 2.5% in the past 9 years that is 0.28% per year. At the same time, natural forestland has decreased 14 hm2. In 9 years, the main part of increased forestland area is manual forest, which has increased 199 hm2, 4.63 times over before, sharing 13.1% of the total forest area. And the increased forestland is mainly composed of acacia forest and oil pine forest. Acacia is mainly distributed in Xujiaduo, Gemai, Yulin and Taide Town and both bands of Xinshui River and Yiting River in the area of loess hill donga. The oil pine is distributed in the southern stone hill area. In the next place, the increased forest land is composed of arborvitae, polar and shrubbery whose area is 30 hm2.
4. QUANTITATIVE ANALYSIS OF DYNAMIC TRANSFORMATION AMONG FOREST TYPES 4.1 Dynamic change of different forest types The dynamic change of the forest types can be shown in Table 3 through the comparison of the forest vegetation area between 1978 and 1987. Table 3 shows: Total area of Daning County is 9672 hm2 and the woodland area is 1525 hm2 in 1978. The cover ration is 15.8%. The forestland area increases to 1767 hm2 in 1987 and the cover ratio becomes 18.3% accordingly. The forestland has Project 1978 1987 Difference Percent (%)
Total area 9672 9672 ─ ─
Forest land 1525 1767 242 15.9
Natural forest 693 679 -14 -2
Manual forest 43 242 199 463
Sparse forest 313 343 30 9.6
Shrubbery 476 503 27 5.7
Covering ratio (%) 15.8 18.3 ─ 2.5
Table 3. Dynamic change of forest type during 1978-1987 in Daning County (hm2) Through the comparison of the forest vegetation area between 1987 and 2000, the dynamic change of the forest types can be shown in Table 4.
past 13 years, the main increased forestland area is also manual forestland which has increased 455 hm2, 1.88 times over before, and is 69.4% of the total added forest area. The newly added man-planted forest is still mainly composed of acacia and oilpine forest. They are also distributed in the loess valley areas including the four townships, Xujiaduo, Gemai, Yulin and Taide and both sides of the Xinshui and Yiting rivers. Secondly, the sparse forest increases 71 hm2, while shrubbery decreases 28 hm2 (Qiao Yuliang, 2004).
As shown in Table 4, the area of Daning County’s total forest land increases to 2423 hm2. In 13 years from 1987 to 2000, the forest land area has increased 656 hm2, with the forestland covering percent increasing from 18.3% to 25.1%, added 6.8%. The natural forest area increases 158 hm2, added 37.1%. In the
Project
Total area
1987 2000 Difference %
9672 9672 ─ ─
Forest land 1767 2423 656 37.1
Natural forest 679 837 158 23.2
Manual forest 242 697 455 188
Sparse forest 343 414 71 20.7
Shrubbery 503 475 -28 -5.6
Table 4. Dynamic change of forest type during 1987-2000 in Daning County (hm2)
817
Covering ratio (%) 18.3 25.1 ─ 6.8
The International Archives of the Photogrammetry, Remote Sensing and Spatial Information Sciences. Vol. XXXVII. Part B7. Beijing 2008
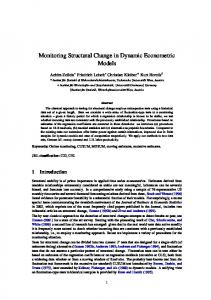
situations among different forest types all exist. We can see clearly that, in the two periods, the area of the sparse forest increased at a very high speed, which is transited mainly from shrubbery and other types such as cropland, slope land and so on through “Planting Trees and Making Forests”, rather than natural forest and manual forest. Of course, there are a little amount of natural forest and manual forest from which it is transited to sparse forest. It shows that the transitions among different types, such as “transit to better” or “transit to worse” and so on are under way at the same time. The main tendency, however, is very optimistic. So long as the tendency continues, the ecological environment in Loess Plateau will surely change for the better unceasingly. The analysis and figures of other forest types can correspondingly obtained, and we do not discuss it specifically here.
4.2 The mutual transitional situation among different forest types Represented by the sparse forest, the mutual transitional situation between it and other forest types in two periods can be shown in Figure.2. Similarly, other similar figures can be obtained through using other forest types as the representation. The “income and expenditure” process of areas of different forest types in the two periods can be clearly shown from these figures, so the results from the “Quitting Cultivation and Returning to Forest Project” in Daning County over the years can be assessed more clearly. According to these figures, some conceptions once apprehended only by quality can be analyzed by quantity, such as “Planting on hand, cutting down on other hand” and so on. As shown in Figure.2, no matter in which period, the mutual transitional
Figure 2. Transition between Sparse forest and other forest types Because of the data in two periods we have, it is surely significant to using the data in the first period to simulate and forecast and using the data in the second one to check the forecast. Meanwhile, it lays a foundation and provides a scientific basis to use the data in the second period to forecast in the future step.
5. DYNAMIC TRANSFORMING SIMULATION AND FORECAST OF FOREST TYPES According to Markov Process, the ratio situation of the areas among different forest types, namely the structure of the forest types in some years after the initial year (1978 or 1987) and even reaching the steadier situation can be simulated by using the initial transforming probability matrix in Table 2 (P. J. W. Hinsson, 1994).
Land Types Simulated Value Measured Value Difference
The contrasted results between the simulated patterns of forest types in 2000, which are got by using the data in 1978-1987 to process and the measured pattern are given in Table 5.
Natural forest Manual forest Sparse forest 6.83 5.09 3.93 8.59 7.03 4.24 -1.76 -1.94 -0.31
Shrubbery Non-forest 5.53 78.62 4.92 75.22 0.61 3.40
Table 5. Simulated and measured patterns of forest types in 2000(%)
818
∑ 1 1 0
The International Archives of the Photogrammetry, Remote Sensing and Spatial Information Sciences. Vol. XXXVII. Part B7. Beijing 2008
shrubbery decreases at a low scale, but the non-forest decreases at a high speed; the natural forest and sparse forest increase steadily; the manual forest increases at the highest speed of all.
We can see from Table 5 that the measured results of forest types except the shrubbery are bigger at different degree than the simulated results in 2000. It conforms to the reality. It says, with the progression of the society and the development to the economy, the government and people pay more and more attention to the ecological environment and “Planting Trees and Making Forests”, and the ecological environment and the forest areas are improved at a large scale. We certainly believe that the tendency will go on and on and may have the better momentum. Meanwhile, the science and the reasonableness of using the data in the period of 1987-2000 to forecast can be seen clearly.
The inherent reasons hided in the apparent features are: most shrubbery transits to the natural forest and sparse forest, that’s why they increase steadily; but inverse, the shrubbery does not get enough supply, so its area decreases; because people pay more attention to ecological environment and the policy of “Quitting Cultivation and Returning to Forest” goes deep into the hearts of the people, and “Manual Afforestation” to defend the sand storm and so on, the manual forest increases at the high speed, what makes the area of non-forest decrease quickly, the coverage of the forest increases evidently. It proves the probability of the improvement of the ecological environment by people’s power (RUCHI BADOLA, 1998).
Forecast of forest transformation patterns in future periods in Daning County is shown in Table 6. From Table 6, the area of forest types in the future is continuously increased as in the period of 1987-2000, whose apparent features are: the
Land Types
1987
2000
2010
2020
2030
2040
2050
Natural forest Manual forest Sparse forest Shrubbery Non-forest
7.02 2.50 3.55 5.20 81.73
8.59 7.03 4.24 4.92 75.22
9.71 10.26 4.71 4.73 70.59
10.75 13.30 5.14 4.55 66.27
11.72 16.15 5.52 4.38 62.24
12.63 18.82 5.86 4.22 58.47
13.48 21.32 6.17 4.08 54.95
Table 6. Forecast of forest transformation patterns in future periods in Daning County (%)
6. CONCLUSION According to the above, the main obtained conclusions are the following:
REFERENCES References from Journals: Li Decheng, et al, 1995. Simulation and Forecast of Soil Erosion Development with Markov Process-A Case Study in Yuexi, Anhui Province. Remote Sensing of Environment, 10(2), pp.89~95.
(1) Integrated with Remote Sensing and computer technology, dynamic transforming process of the forest types and mutual transitional situation among forest types in some districts can be analyzed quantificationally by using Markov Process. The contrast and analysis between simulated and measured results can be achieved by using the data in different periods. Then whether the initial transitional probability matrix should be adjusted or not is determined, so the science and reliability of the forecast results are guaranteed. The Markov model, however, can usually be made to forecast in a short period.
P. J. W. Hinsson, 1994. HOPSY, a model to support strategic decision making in forest resource management. Forest Ecology and Management, 69(1-3), pp.321~330. Qiao Yu liang, et al, 2000. Study on Monitoring Farmland by Using Remote Sensing and GIS in Shanxi China. Advances in Space Research, 26(7), pp. 1059~1064.
(2) The research of dynamic transformation of the forest types in Daning County in more than 20 years shows that, the forest cover ratio in Daning County is continuously going up, and especially in 1987-2000, every forest types increased at a large scale. It conforms to the fact that the big accomplishment is achieved by the ecological environment preserve and “Planting Trees and Making Forests Project” in more than 20 years in Daning County. It raises confidence of people to improve the ecological environment. But we should know it clearly, that the hard work in initial stage is important, but persist to the end is more difficult and more important. Moreover, the forest cover ratio is lower than 50% even if we stick it to 2050.
Qiao Yu liang, et al, 2002. Divisional Compound Hierarchical classification Method For Regionalization of Crops of China. Advances in Space Research, 29 (1), pp.89~93. Qiao Yuliang, et al, 2004. Study of remote sensing monitoring of dynamic change of the Loess Plateau forest resources. Advances in Space Research, 33 (1), pp. 302~306. RUCHI BADOLA, 1998. Attitudes of local people towards conservation and alternatives to forest resources: A case study from the lower Himalayas. Biodiversity and Conservation, 7(10), pp. 1245~1259
(3) Markov Process is a simple and useful tool which has definite geographical meaning and quantitative conception. Moreover, it is not limited by the scale and study area. Combined with GIS and RS technology in application, it can be used in dynamic monitoring of other resources and environments. This explores an effective way for us to integrate RS with GIS in resource and environment investigation.
Zhang Sanli, 1999. A preliminary study on the cinctrol system of undercut. Center south forest inventory and planning, 18(2), pp. 8~18
819
The International Archives of the Photogrammetry, Remote Sensing and Spatial Information Sciences. Vol. XXXVII. Part B7. Beijing 2008
820