These techniques are applied to the SPEC CPU95 and CPU2000 benchmark suites. It is shown that these suites contain both eccentric and fragile benchmarks.
Eccentric and Fragile Benchmarks Hans Vandierendonck and Koen De Bosschere Dept. of Electronics and Information Systems Ghent University, Sint-Pietersnieuwstraat 41, 9000 Gent, Belgium E-mail: {hvdieren,kdb}@elis.UGent.be
Abstract Benchmarks are essential for computer architecture research and performance evaluation. Constructing a good benchmark suite is, however, non-trivial: it must be representative, show different types of behavior and the benchmarks should not be easily tweaked. This paper uses principal components analysis, a statistical data analysis technique, to detect differences in behavior between benchmarks. Two specific types of benchmarks are identified. Eccentric benchmarks have a behavior that differs significantly from the other benchmarks. They are useful to incorporate different types of behavior in a suite. Fragile benchmarks are weak benchmarks: their execution time is determined almost entirely by a single bottleneck. Removing that bottleneck reduces their execution time excessively. This paper argues that fragile benchmarks are not useful and shows how they can be detected by means of workload characterization techniques. These techniques are applied to the SPEC CPU95 and CPU2000 benchmark suites. It is shown that these suites contain both eccentric and fragile benchmarks. The notions of eccentric and fragile benchmarks are important when composing a benchmark suite and to guide the sub-setting of a benchmark suite.
1 Introduction Computer architecture research and evaluation depends strongly on benchmarks. Test programs or benchmarks provide a means to reliably measure the potential speed-up of a new idea or technique in a repeatable way. It is typical that some benchmarks respond very well to the new technique, while others are sped up only moderately and still others are not improved at all. Sometimes, however, a benchmark can be extremely sensitive to a particular optimization. In such a case, we call the benchmark eccentric, because it is not at all like the average benchmark. A benchmark is eccentric when its execution is slowed down by one particular bottleneck of the processor – that
bottleneck which the optimization targets. Eccentric benchmarks have a number of properties which make them more interesting than average benchmarks. These benchmarks respond very well to optimizations that target the bottlenecks that they stress. It is therefore important to use these benchmarks when studying those specific bottlenecks, as they show how large the speedup can be, if that bottleneck is removed. Eccentric benchmarks are also excellent candidates to perform a case study. Furthermore, when composing a benchmark suite for general use, it is interesting to include several eccentric benchmarks, each of which is eccentric in a different aspect of program behavior. The benchmark health is one of the few documented examples of eccentric benchmarks [22]. This benchmark repeatedly traverses a large linked list. During each traversal, all elements of the list remain in the same order, with the exception that sometimes the head is removed and another element is added to the tail. Consequently, contextbased prefetchers or value predictors can easily learn the pattern of memory addresses that is touched. This is very atypical behavior for a program that manipulates linked-lists, as linked-list are most useful when insertions and/or deletions occur frequently in the middle of the list [12]. Consequently, if one would measure the behavior of health with respect to the the memory access patterns, one would find that they are a-typical, making health eccentric in comparison to other pointer-based benchmarks. Another example can be found in the work on hash functions for data caches. The goal of adding a hash function is to avoid repetitive conflict misses that result from arrays that interfere in the cache. Hash functions have an extremely large impact for three benchmarks in the SPEC CPU95 suite, specifically swim, tomcatv and wave5 [15]. It is shown in this paper that these benchmarks are indeed eccentric with respect to the data memory behavior. There is, however, a danger attached to using eccentric benchmarks. The execution time of these benchmarks is, to a large extent, determined by one specific bottleneck. It is therefore possible to speedup the benchmark significantly by means of an otherwise irrelevant optimization. We define
a fragile benchmark as an eccentric benchmark that is susceptible to optimizations that are useful only for that benchmark, or are irrelevant for most other benchmarks. Some examples clarify this definition. Some benchmarks spend almost all their time in a very small code fragment (these benchmarks are eccentric with respect to the working set of the instruction memory). They invite very specific, but very powerful optimizations. Such optimizations were developed and implemented in compilers for the matrix300 benchmark in SPEC89 [10] and the eqntott benchmark in SPEC92 [20]. In each case, optimizations were invented that could in principle speedup other programs, but the speedups obtained on these specific benchmarks strongly overestimates their usefulness. The same holds for the compiler optimizations that are applicable to the synthetic dhrystone and whetstone benchmarks [10]. Another reason why a benchmark may be fragile is that its behavior can be significantly changed by applying a small optimization to the source code. E.g., the execution time of health can be dramatically reduced by remembering a pointer to the tail of the linked list [22]. This makes the traversal of the linked list unnecessary and significantly changes the memory access patterns. Other small optimizations that may impact the behavior of a benchmark include: changing the sorting algorithm that is used by a benchmark, changing the order of fields in a structure definition [3], improving the data layout by applying loop optimizations [21], etc. In this view, health is clearly a fragile benchmark, as its behavior and execution time are strongly changed by applying small optimizations, requiring no more than 4 hours of work [22]. It is not desirable to use fragile benchmarks in performance evaluation or computer architecture research. E.g., compiler optimizations targeted at specific code fragments are usually not applicable to anything but the targeted benchmark. Although it is possible to validate compiler optimizations by testing whether the same speed-up is obtained for code that is only slightly different from the benchmark,1 it is better not to use such benchmarks at all. A benchmark is also not useful when it may be optimized by implementing small changes in the source code. The fragile benchmark is eccentric in some aspect of its behavior. If the benchmark is used to measure the impact of an optimization that is related to this aspect of behavior, then the performance benefit of the optimization is likely to be overestimated. The small changes to the source code are probably more useful than the architectural or compiler optimizations or, at least, mitigate the usefulness of these optimizations. Otherwise, if the benchmark is used to evaluate an optimization that is not related to its eccentric behavior, then it is likely that the strength of the optimization is un1 Tests for detecting optimizations specific to eqntott are listed on http://www.nullstone.com/eqntott/eqntott.html.
derestimated. In this case, the performance of the fragile benchmark is hindered more by a different bottleneck than by the bottleneck that is targeted. However, the larger bottleneck may be easily removed by applying small changes, after which optimizations to the targeted bottleneck become much more powerful. Note that an eccentric benchmark is not necessarily fragile. The benchmark may stress the system in a different way, but when its behavior is not easily changed, then it is not fragile. On the other hand, a fragile benchmark is almost certainly eccentric. It is important to continually improve benchmarks such that they become more robust and, at the same time, more realistic [14]. Before one can improve the benchmarks, it is necessary to recognize that they are eccentric or fragile. In the remainder of this paper, a method is described to detect eccentric benchmarks. This paper focuses on the data memory behavior, but the method can be applied to any other aspect of program behavior. The SPEC CPU95 and CPU2000 benchmark suites are analyzed and it is shown that these suites contain several eccentric benchmarks. Furthermore, it is shown that some eccentric benchmarks are also fragile benchmarks.
2 Methodology The behavior of the benchmarks is characterized by means of workload characteristics which predict the workload’s performance [4]. The focus of this paper is on the data memory behavior. Hence, the workload is characterized by the data cache miss rates in a wide range of cache configurations. We present each program as a point in a p-dimensional space, where the coordinates of the points are determined by the p workload characteristics [7, 8]. The benchmark suite corresponds to the cloud of points of the individual programs. The points in this cloud are typically located near each other, except for the eccentric programs, which are located far away from the other programs. Determining the eccentric benchmarks from the p workload characteristics is non-trivial given the large amount of data to inspect (e.g., p = 220 in the study of Gee et al. [9]). Furthermore, many of the workload characteristics are correlated, making the task even more difficult. These problems are tackled by reducing the p-dimensional space to a q-dimensional space with q � p (q = 4 in this work) without losing important information. This reduction is performed using principal components analysis (PCA), a statistical data reduction technique [6]. The workload characteristics can be analyzed more easily in the reduced qdimensional space, as q is small and the q workload characteristics created by PCA are not correlated. The role of principal components analysis in this work is
not essential: It is only a tool. There are many other ways to detect eccentric benchmarks. PCA is used because it provides a graphical representation of the space of benchmarks which nicely illustrates the concept of “ex-centric” benchmarks. In any case, the most important step is to select the right workload characteristics.
2.1 Characterization of Data Memory Behavior Similar to other studies [2, 9], the data memory behavior of a workload is characterized by its data cache miss rates in a wide range of cache configurations. The raw miss rates are transformed into ratios of miss rates, such that each workload characteristic measures the influence of changing one cache parameter while keeping the others constant. Hereby, much of the variability between miss rates in caches with a different size or block size is removed. E.g., the ratio of miss rates in caches with different associativity is largely constant across cache size and block size but depends on the degree of associativity [11]. When the cache miss rate becomes very low, a change in miss rate is not significant for overall performance (e.g., a drop from 0.5% to 0.01%). These cases are filtered out by setting the ratio of miss rates to 1 (i.e., no effect) as soon as the miss rate in the nominator or denominator is less than 1%. Note that the choice of a 1% threshold is arbitrary. A different choice may be more appropriate in different situations (e.g., when the last level of cache is examined). Each cache configuration is described by five parameters: the cache size, the degree of associativity, the block size, the replacement policy and the set index function. Two types of set index functions are considered: the conventional bit selection (B) and a XOR-based set index function (X). XOR-based functions can remove many conflict misses that are repetitive in nature and are typically caused by array accesses [15]. It is typically difficult to remove these repetitive conflict misses by increasing associativity [15, 17]. Thus, they present a type of program behavior that is distinct from the need for a high degree of associativity. Their presence is measured by the effectiveness of XOR-based set index functions. For each benchmark, a XOR-based set index function tuned to that benchmark is simulated. This is accomplished with the methodology described in [16, 18]. In total, 42 workload characteristics are fed into PCA (Table 1). Each characteristic is described by a fixed value for 4 of the 5 cache parameters and two values for the remaining parameter. E.g., the first characteristic equals the miss rate in a 2-way set-associative 8-KB cache with 32 byte blocks, divided by the miss rate in a direct mapped 8-KB cache with 32 byte blocks. The workload characteristics are described in groups of 6. The first 6 characteristics measure the effect of associa-
Var 1 2 3 4 5 6 7 8 9 10 11 12 13 14 15 16 17 18 19 20 21 22 23 24 25 26 27 28 29 30 31 32 33 34 35 36 37 38 39 40 41 42
Table 1. The Workload Characteristics Size (KB) Assoc BlkSz Repl Index 8 1→2 32 LRU B 8 2→4 32 LRU B 8 4→8 32 LRU B 8 1 32 LRU B→X 8 2 32 LRU B→X 8 4 32 LRU B→X 32 1→2 32 LRU B 32 2→4 32 LRU B 32 4→8 32 LRU B 32 1 32 LRU B→X 32 2 32 LRU B→X 32 4 32 LRU B→X 128 1→2 32 LRU B 128 2→4 32 LRU B 128 4→8 32 LRU B 128 1 32 LRU B→X 128 2 32 LRU B→X 128 4 32 LRU B→X 8 2 32→64 LRU B 8 2 64→128 LRU B 32 2 32→64 LRU B 32 2 64→128 LRU B 128 2 32→64 LRU B 128 2 64→128 LRU B 32 1→2 64 LRU B 32 2→4 64 LRU B 32 4→8 64 LRU B 32 1 64 LRU B→X 32 2 64 LRU B→X 32 4 64 LRU B→X 32 1→2 128 LRU B 32 2→4 128 LRU B 32 4→8 128 LRU B 32 1 128 LRU B→X 32 2 128 LRU B→X 32 4 128 LRU B→X 4→8 FA 32 MIN n.a. 8→16 FA 32 MIN n.a. 16→32 FA 32 MIN n.a. 32→64 FA 32 MIN n.a. 64→128 FA 32 MIN n.a. 128→256 FA 32 MIN n.a.
tivity and the set index function in an 8-KB cache. Variables 7–12, 13–18, 25–30 and 31–36 measure the same aspects but in, respectively, a 32-KB cache, a 128-KB cache, a 32KB cache with 64 byte blocks and a 128-KB cache with
128 byte blocks. Variables 19–24 measure the effect of increasing block size in 8, 32 and 128-KB caches, but always 2-way set-associative. Variables 37–42 measure the effect of increasing the cache size. The MIN policy [1] is used in fully-associative caches in order to filter out the effects of the replacement policy. It is possible to add more workload characteristics to the analysis. This should not change the conclusions of the analysis, provided that a similar mix of variables measuring the effect of each of the cache parameters is used.
2.2 Principal Components Analysis Principal components analysis (PCA) reduces the dimensionality of a data set to produce a set of new workload characteristics, called the principal components [6]. It is assumed that the variables are strongly correlated (in statistical terms, this means they contain the same information). This is clearly the case for the analyzed data, e.g., increasing associativity usually has the same effect regardless of the cache size or block size [11]. The p original variables Xi , i = 1, . . . , p are linearly transformed P into p principal components Zi , i = 1, . . . , p p with Zi = j=1 aij Xj , i = 1, . . . , p. The coefficients aij are determined by PCA in such a way that the principal components are sorted in order of decreasing variance (V ar[Zi ] ≥ V ar[Zj ] if i < j) and are not correlated (Cov[Zi , Zj ] = 0 if i 6= j). The dimensionality of the data set is reduced by retaining only those principal components that have the highest variance. The number of retained principal components can be traded-off against the fraction of the variance in the data set that is explained. In general, it is up to the user of PCA to decide how many principal components to retain. Dunteman [6] lists some rules of thumb to guide the choice. Before applying PCA, it is advisable to standardize the variables, i.e., rescale them such that they have zero mean and unit variance. Otherwise, variables with high variance will have a higher effect in the first principal components. E.g., variables measuring the effect of 8-way setassociativity have considerably less variance than variables measuring 2-way set-associativity and would have lower weights in the principal components. Yet, they could show an important difference between benchmarks.
2.3 Interpretation When q is sufficiently small, the reduced space can be visualized with a scatter plot, showing the position of each benchmark with respect to the principal components. Average benchmarks are located near the origin (coordinates (0, 0)) of this space, while eccentric benchmarks are located
far away from the center and from the majority of benchmarks. When a benchmark is sensitive to the cache parameter varied in Xj , then it has a small value for Xj . Depending on the sign of the factor loading aij , it will have either a negative value for Zi (aij > 0) or a positive value (aij < 0). Interpretation of the principal components is facilitated by projecting the original axes Xj on the scatter plot. This results in a third axis on the plot, with benchmarks scoring negatively on Xj on one end of the axis and benchmarks scoring positively on the other end. This sense of direction is emphasized by putting an arrow on the axis pointing in the direction of performance improvement. As similar variables are typically strongly correlated (e.g., variables measuring the impact of block size are similar, regardless of the cache size), these variables are grouped and the axis Xj + . . . + Xk is projected on the scatter plot instead.
3 Analysis The benchmarks are compiled for the Alpha instruction set using the Compaq compilers. All programs are compiled by the same compilers in order to factor out the effect of compiler improvements that have occurred between the introduction of CPU95 and that of CPU2000. The optimization flags are set to -fast -arch ev6 -O4 for C programs, to -arch ev6 -O2 for C++ programs and to -arch ev6 -O5 for Fortran programs. The cache miss rates are measured using SimpleScalar2 . To limit the simulation time, representative traces of up to 500 million instructions are determined using the SimPoint framework.3 Benchmarks shorter than 500 million instructions are simulated entirely. We validated a subset of the CPU2000 traces by comparing the miss rates measured for these traces with the miss rates of the whole program. The error averaged over the validated traces is at most 30% (for the 128-KB caches). However, the error in the ratios of miss rates is much smaller, as the errors in the nominator and the denominator cancel each other out. The error in the variables Xj is less than 8% and is frequently around 1-2%. To measure the presence of repetitive conflict misses, we generate a XOR-based set index function, tuned to each benchmark and each cache configuration with XOR-based functions. Each function hashes n + 2 virtual address bits into an n-bit set index, as hashing more address bits does not improve the mapping significantly [17]. All programs and all reference and training inputs are used with the following exceptions: the gcc input amptjp.i is not used as it is identical to c-decl-s.i except for a space; only one reference input for go is used; vpr could not be run due to floating-point imprecisions; the 2 http://www.simplescalar.com/ 3 http://www.cs.ucsd.edu/˜calder/simpoint/
perlbmk inputs could not be run properly in SimpleScalar, so the reference scrabble input from SPEC95 is used.
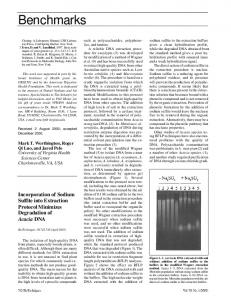
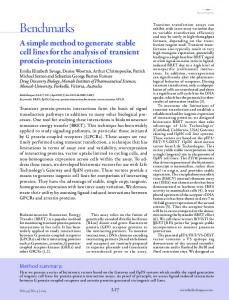
3.1 Analysis of CPU95 Applying PCA to CPU95 results in 4 principal components that explain 67.31% of the variance present in the original 42 variables. Although this is rather low, additional components are not discussed because (i) they include progressively less information and (ii) they do not provide additional insight. 3.1.1 Understanding the Principal Components The table in Figure 1 shows the factor loadings aij . Weights larger than 0.15 are assumed to have an important effect and are displayed in bold. The effect of variables with smaller weights is ignored in the following explanation. The first principal component loads positively on the variables X19 to X22 and loads negatively on a subset of the other variables. The effect of cache size is almost entirely ignored by PC1. Hence, PC1 primarily makes the contrast between benchmarks for which block size effects performance and benchmarks for which associativity and/or repetitive conflict misses are important. In order to facilitate the interpretation of PC1, two new axes are projected onto the plot of PC1 and PC2 (Figure 1). The first axis measures block size and is the sum of variables X19 to X22 . The second axis measures the effect of associativity and hashing in the 32 and 128-KB caches under the label ’assoc+hash’. These two axes are almost opposites. Consequently, a benchmark that fares well with large block sizes typically does not require high associativity. Analysis of PC2 learns that it makes the distinction between the effect of associativity and hashing: it loads positively on X8 , X9 , X26 , X27 , X32 and X33 , which all measure the effect of changing the degree of associativity. PC2 loads negatively on the X3 –X6 , X12 , X29 , X30 and X34 – X36 , which measure the importance of hashing. It also loads on the variables X24 and X39 , but these are ignored to the simplify the analysis. Figure 1 shows the axes combining the first (label ’assoc’) and second set of variables (label ’hash’). It divides the workload space into four quadrants. Benchmarks that see an effect of set-associativity but not from hashing are situated near the bottom of the plot. These include most gcc benchmarks and apsi and go with reference inputs. Benchmarks where hashing removes many misses but associativity does not are located near the top. E.g.: swim, tomcatv and ijpeg with reference inputs. Benchmarks where both techniques work are situated to the right and include perl, wave5 and su2cor. The remaining benchmarks see lessthan-average reductions in miss rate from either technique and are located to the left. They include compress, hydro2d
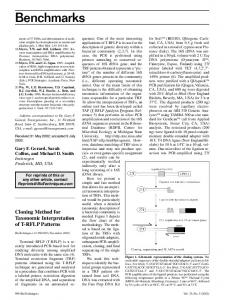
and applu. PC3 is decomposed in a similar fashion in three axes: block size (all cache sizes this time), associativity and hashing in the 128-KB cache (label ’128KB’) and an axis that contrasts the benefit of increasing the associativity from 1 to 2, versus increasing the associativity from 4 to 8 or adding hashing (’high vs. low’). PC4 is decomposed in the ’128KB’ axis and an axis that measures the effect of associativity in the 32-KB caches with large block sizes and the effect of larger caches (label ’32KB+size’). 3.1.2 Eccentric Benchmarks Eccentric benchmarks have a behavior that differs strongly from the other benchmarks. Hence, they are positioned far away from other benchmarks in the scatter plots. Figure 1 shows that swim, tomcatv and wave5 have extremely large values for the second principal component. The interpretation of PC2 learns that these benchmarks benefit strongly from hashing. Turb3d is eccentric in a different way. It benefits exceptionally well from higher associativity and hashing in the 128-KB cache (PC3 and PC4), but not from larger cache blocks (PC1). Other benchmarks take on extreme values for some workload characteristics, but they are not eccentric. E.g., go and perl see a decrease in miss rate when the block size is decreased (PC3 and PC4). This behavior is not eccentric, as there are many other benchmarks with the same property. Such benchmarks are located near go and perl, e.g., vortex, fpppp and ijpeg.
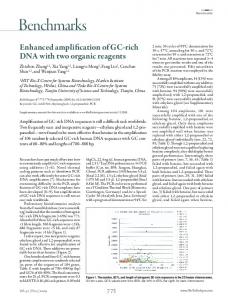
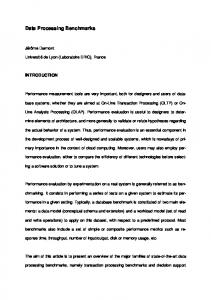
3.2 Analysis of CPU2000 3.2.1 Understanding the Principal Components Four PCs explain 64.1% of the total variance in the data set. The first principal component is remarkably similar to PC1 in the analysis of CPU95 (Figure 2). PC1 is decomposed into the axis X19 –X24 measuring the effect of block size on the miss rate and X1 –X12 and X25 –X36 measuring the effect of associativity and hashing in 8 and 32-KB caches. These axes are almost pointing in the opposite direction, so the sensitivity to block size and the presence of conflict misses are strongly negatively correlated. The plot shows that mostly floating-point benchmarks require large cache blocks (e.g.: lucas, swim, applu) while it are typically integer benchmarks that are prone to conflict misses (e.g.: perl, vortex, gap). PC2 loads negatively on the variables describing the 8KB cache (axis “8KB”) and loads positively on the block size (axis “block”) and on high associativity in the 32 and 128-KB caches (axis “high assoc”). The first two axes coincide and point into opposite directions. The third axis is almost perpendicular to them. Hence, equake sees a large miss rate reduction with high associativity and a larger-
CFP95, ref
CFP95, train
CINT95, ref
CINT95, train
block size
assoc+hash
assoc
hash
12
swim
Factor loadings
hash
10 8
tomcatv wave5
PC2
6 4 2
jpeg block cmp m88ksim size mgrid jpeg fpppp
0
applu hydro2d
-2
vortex
perl.primes perl.scrabble perl.jumble su2cor
apsi
assoc +hash
xlisp cmp.ref
gcc
go
-4
apsi
turb3d
assoc
-6 -6
-4
-2
0
2
4
6
8
10
PC1
8 8
CFP95, ref
CFP95, train
CINT95, ref
CINT95, train
block size
128KB
high vs. low
32KB+size
32KB +size
su2cor
6 4
apsi
block size
perl xlisp
PC4
2
go
gcc wave5
0 low assoc
-2
applu
vortex
mgrid
cmp hydro2d
high assoc
cmp perl
tomcatv swim
fpppp
apsi
m88ksim
-4
jpeg turb3d
-6
128KB
-8 -8
-6
-4
-2
0
2
4
6
Xi 1 2 3 4 5 6 7 8 9 10 11 12 13 14 15 16 17 18 19 20 21 22 23 24 25 26 27 28 29 30 31 32 33 34 35 36 37 38 39 40 41 42
PC1 -0.06 -0.18 -0.14 -0.08 -0.08 -0.07 -0.14 -0.18 -0.15 -0.23 -0.23 -0.18 -0.08 -0.16 -0.16 -0.15 -0.17 -0.13 0.20 0.22 0.20 0.23 0.12 0.10 -0.14 -0.16 -0.13 -0.22 -0.21 -0.17 -0.10 -0.17 -0.15 -0.20 -0.21 -0.15 -0.15 -0.06 -0.03 -0.03 -0.01 0.02
PC2 0.11 -0.04 -0.23 -0.27 -0.28 -0.28 0.10 0.19 0.21 -0.06 -0.12 -0.20 0.03 0.07 0.10 0.08 0.11 0.10 0.04 0.01 -0.03 -0.03 -0.12 -0.16 0.06 0.22 0.26 -0.12 -0.16 -0.22 0.03 0.20 0.26 -0.15 -0.16 -0.23 0.11 0.14 0.15 0.04 -0.04 -0.02
PC3 -0.19 -0.19 -0.07 -0.14 -0.11 -0.07 -0.24 0.04 0.07 -0.08 0.14 0.16 0.07 0.16 0.16 0.21 0.20 0.16 0.20 0.18 0.19 0.15 0.26 0.20 -0.18 0.07 0.11 -0.02 0.18 0.16 -0.14 0.07 0.12 0.01 0.16 0.15 -0.21 -0.06 0.12 0.19 0.20 0.18
PC4 -0.10 0.09 0.22 0.11 0.15 0.14 -0.10 -0.12 0.20 -0.19 -0.10 0.09 -0.03 0.18 0.26 0.15 0.22 0.21 -0.12 0.02 -0.16 0.05 -0.13 -0.07 -0.25 -0.15 0.14 -0.23 -0.14 0.02 -0.26 -0.19 0.07 -0.22 -0.17 0.03 0.11 -0.06 -0.16 -0.16 -0.17 -0.13
PC3
Figure 1. The SPEC CPU95 benchmarks plotted against the first 4 principal components. The darkcolored regions contain xlisp benchmarks and the light-colored regions contain gcc benchmarks.
than-average reduction due to increased block size. It scores worse-than-average on the “8+32-KB” axis because 2-way set-associativity is sometimes worse than direct mapping. PC3 and PC4 are dominated by the effect of block size and cache size. These PCs also make a contrast between high and low associativity, but we ignore these for simplicity. There remain three axes: block size (X19 –X24 ), cache size in the range 4 to 64-KB (X37 –X40 ) and cache size in the range 32 to 256-KB (X40 –X42 ). PC3 states that there
is a negative correlation between block size and cache size in the low range (i.e.: the corresponding axes are pointing in different directions when projected onto PC3). Similarly, PC4 states that block size and cache size in the high range are positively correlated. This shows that there is no point in increasing block size when the cache is too small to hold the working set. 3.2.2 Eccentric Benchmarks There are several benchmarks with eccentric behavior in the
CFP2000, ref
CFP2000, train
CINT2000, ref
CINT2000, train
block or 8KB
8+32KB
high assoc
gzip & bzip2
6
8KB sixtrack gap mesa mgrid
4
gap
eon
PC2
2
0
wupwise gcc facerec & mcf lucas
8+32KB mesa
vortex perl
apsi galgel
art
fma3d
gcc applu swim
-2
Factor loadings
twolf
parser
ammp mgrid
-4
-5
high assoc
equake
block size
-6
-3
-1
1
3
apsi
5
7
PC1 CFP2000, ref
CFP2000, train
CINT2000, ref
CINT2000, train
block size
4-64KB
32-256KB
gzip & bzip2
4 crafty gcc mcf&apsi
galgel
2
eon gap
crafty gzip
sixtrack
swim
lucas vortex facerec applu
PC4
0 gcc
perl ammp
vortex
-2
equake
wupwise & art
4-64KB galgel
parser
mesa
mgrid
fma3d
-4 apsi
-6 -6
-4
lucas 32-256KB
-2
0
2
mgrid
block size
4
6
8
Xi 1 2 3 4 5 6 7 8 9 10 11 12 13 14 15 16 17 18 19 20 21 22 23 24 25 26 27 28 29 30 31 32 33 34 35 36 37 38 39 40 41 42
PC1 -0.17 -0.17 -0.19 -0.16 -0.12 -0.12 -0.24 -0.20 -0.10 -0.25 -0.22 -0.09 -0.04 0.03 0.01 -0.03 -0.01 -0.06 0.16 0.15 0.15 0.16 0.12 0.10 -0.22 -0.18 -0.17 -0.24 -0.21 -0.16 -0.19 -0.19 -0.17 -0.23 -0.19 -0.14 -0.15 -0.13 0.06 0.07 0.09 0.07
PC2 -0.20 -0.22 -0.01 -0.24 -0.21 -0.13 -0.06 0.07 0.24 -0.03 0.16 0.21 0.08 0.05 0.11 0.14 0.16 0.14 0.16 0.20 0.11 0.09 0.19 0.18 -0.05 0.09 0.23 -0.03 0.22 0.26 -0.07 0.06 0.23 -0.06 0.21 0.27 -0.10 0.10 0.10 0.10 0.12 0.11
PC3 -0.05 -0.08 -0.06 -0.13 -0.17 -0.12 0.07 0.17 -0.17 -0.03 0.03 -0.11 0.20 0.23 -0.07 0.14 0.15 0.05 -0.13 -0.01 -0.21 -0.23 -0.18 -0.26 -0.01 0.18 -0.12 -0.11 -0.02 -0.12 -0.08 0.18 -0.08 -0.14 -0.03 -0.14 0.12 0.34 0.32 0.28 0.14 -0.02
PC4 0.03 0.02 -0.00 0.04 0.12 0.19 0.12 0.02 -0.14 0.04 -0.08 -0.13 0.19 -0.09 -0.07 0.25 0.12 0.17 0.07 -0.02 0.27 0.21 0.23 0.26 0.26 0.09 -0.13 0.13 -0.04 -0.13 0.30 0.15 -0.15 0.15 0.00 -0.14 -0.10 0.03 0.11 0.14 0.27 0.27
PC3
Figure 2. The SPEC CPU2000 benchmarks plotted against the first 4 principal components. The shaded regions contain gzip and bzip2 benchmarks. Some benchmarks are strong outliers in the plot for PC1 and PC2. They are not shown to improve the readability of the graph. Crafty.ref is located at (12.2,-1.1), crafty.train is at (13.5,-4.3) and equake.train is at (6.3,-11.0).
CPU2000 suite. Crafty has lower cache miss rates when the block size is small. It is also somewhat more dependent on high associativity than the other benchmarks. Equake depends strongly on the degree of associativity and suffers from repetitive conflict misses. The latter effect is much more pronounced in the training input than in the reference input. The apsi.train benchmark has many repetitive con-
flict misses, especially in the 128-KB cache (PC1 and PC2). Its miss rate is also reduced significantly when increasing the cache size, both in the range 4-64 KB and the range 32256 KB (PC3 and PC4). Finally, perl and mesa are eccentric as they have many conflict misses in the 8 and 32-KB caches, many of which are repetitive. Furthermore, they have little spatial locality.
CFP95
CFP2000
CINT95
CINT2000
block size
assoc+hash
8-KB
high assoc+128KB
12
Factor loadings
high assoc +128KB
10
turb3d
8
PC2
6
equake block size
xlisp
4 lucas
swim
gzip
su2cor apsi
wave5
gcc
applu
2
apsi
apsi
assoc +hash
su2cor
0 hydro2d
bzip2 &gzip eon
-4
crafty
gcc
-2
perl
go
xlisp
perl
ijpeg
swim
-6 -6
-3
0
3
6
9
PC1 CFP95
CFP2000
assoc vs. hash
assoc+hash
CINT95
CINT2000
su2cor
64,128B blocks apsi
6 extreme senstivity to hashing
3
apsi perl
wave5
crafty
mgrid tomcatv all applu
PC4
0 swim
go apsi
equake.train
-3 assoc vs. hash
-6
swim
jpeg equake.ref
turb3d 32B blocks
-9 -13
-10
-7
-4
-1
2
5
Xi 1 2 3 4 5 6 7 8 9 10 11 12 13 14 15 16 17 18 19 20 21 22 23 24 25 26 27 28 29 30 31 32 33 34 35 36 37 38 39 40 41 42
PC1 -0.13 -0.19 -0.16 -0.14 -0.11 -0.10 -0.21 -0.19 -0.12 -0.26 -0.23 -0.15 -0.08 -0.07 -0.08 -0.09 -0.09 -0.09 0.18 0.17 0.15 0.19 0.12 0.11 -0.21 -0.17 -0.13 -0.24 -0.21 -0.16 -0.18 -0.16 -0.13 -0.23 -0.20 -0.15 -0.16 -0.12 -0.02 0.02 0.05 0.08
PC2 0.15 0.18 0.12 0.25 0.22 0.17 0.10 -0.13 -0.20 0.06 -0.10 -0.10 -0.11 -0.19 -0.21 -0.24 -0.25 -0.21 -0.16 -0.16 -0.11 -0.09 -0.15 -0.10 0.07 -0.18 -0.23 0.05 -0.12 -0.09 0.07 -0.16 -0.24 0.05 -0.11 -0.08 0.10 -0.07 -0.19 -0.18 -0.15 -0.11
PC3 -0.17 -0.04 0.20 0.17 0.22 0.26 -0.16 -0.15 -0.10 -0.00 0.14 0.27 0.02 0.00 -0.00 0.02 -0.01 -0.01 0.07 0.08 0.13 0.12 0.23 0.25 -0.10 -0.17 -0.15 0.08 0.22 0.29 -0.05 -0.16 -0.15 0.11 0.22 0.30 -0.16 -0.14 -0.07 0.03 0.11 0.09
PC4 -0.06 0.09 0.18 0.09 0.12 0.08 -0.13 -0.13 0.21 -0.12 -0.07 0.11 -0.08 0.22 0.32 0.12 0.24 0.19 -0.15 -0.04 -0.23 -0.06 -0.19 -0.15 -0.25 -0.16 0.13 -0.16 -0.10 0.04 -0.26 -0.20 0.09 -0.15 -0.13 0.05 0.08 -0.11 -0.15 -0.11 -0.17 -0.17
PC3
Figure 3. Comparison of the SPEC CPU95 and CPU2000 benchmarks. The gray areas contain gcc, xlisp, bzip2 and gzip benchmarks.
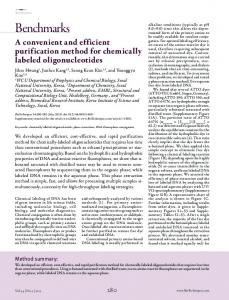
3.3 Comparison of CPU95 and CPU2000 It is shown that some of the benchmarks that are common to CPU95 and CPU2000 are fragile by performing a principal components analysis on both suites. Benchmarks that are present in both CPU95 and CPU2000 may have very different properties, which will easily show up in the scatter plots. For these benchmarks, we can show that they are fragile. With 4 principal components, 63.0% of the variance
is explained. Some benchmarks are not labeled in the scatter plots, for the sake of clarity (Figure 3). Only benchmarks that are discussed in the text or serve as reference points in comparison to the previous analyses are indicated. The analysis of the principal components is similar to the previous cases. We limit the discussion to PC3, as it shows the largest difference between CPU95 and CPU2000. PC3 is decomposed into two axes. The first axis contrasts associativity to hashing (axis “assoc vs. hash”, with the arrow
pointing to high sensitivity to hashing). The second axis corresponds to the impact of associativity, either when the block size is large (PC4> 0) or when it is small (PC4< 0). There are some strong outliers: swim, wave5 and tomcatv. These benchmarks are archetypal examples of benchmarks that suffer severely from repetitive conflict misses. The scatter plots show a number of important differences between CPU95 and CPU2000. A large part of the workload space does not contain benchmarks from the CPU2000 suite. All but one of the benchmarks to the left and below the dashed line drawn in the plot of PC3 and PC4 are members of the CPU95 suite. These benchmarks (swim, tomcatv, wave5, ijpeg and equake.train) contain an extreme number of repetitive conflict misses. Note that the eccentricity of the CPU95 benchmarks is much stronger than for the eccentric CPU2000 benchmarks. The former are positioned at a relatively large distance from the cluster containing the majority of benchmarks (PC3 vs. PC4). In contrast, crafty, apsi, equake, etc. are all positioned much closer to the cluster. Hence, the deviation in behavior of the eccentric CPU2000 benchmarks is much smaller than in CPU95. 3.3.1 Fragile Benchmarks It is possible to see whether a benchmark is fragile, if it occurs both in CPU95 and CPU2000. Very few changes were made to the swim benchmark between CPU95 and CPU2000, yet its behavior has changed significantly. Swim is a “typical” floating-point program that operates repeatedly on matrices. The leading dimension of these matrices is changed, which removes almost all conflict misses and thus swim’s sensitivity to set-associativity and repetitive conflict misses. Spatial locality is improved by this change, but also by the transition to double-precision floating-point arithmetic. These changes clearly illustrate that the CPU95 version is a fragile benchmark: it is eccentric because it is highly sensitive to repetitive conflict misses, while the modified (CPU2000) version behaves like an average benchmark. The CPU2000 version of swim is neither eccentric nor fragile. This occurs for many floating-point codes: some leading dimensions result in many repetitive conflict misses, but exorbitant cache miss rates can be avoided by restructuring the program or the data [21]. Similar changes were made to applu and apsi. They have almost no effect on the data memory behavior of applu. Apsi is much more dependent on its input, as it places the vectors and matrices in memory at run-time, at memory locations that depend on the dimensions specified in the input. This is reflected in the scatter plots, as the variants of the apsi benchmark are located relatively far apart. The source code of vortex, an object-oriented database program, is virtually unchanged between CPU95 and CPU2000. The inputs are modified, which has a notable
effect on the data memory behavior: reference input 1 of CPU2000 resembles the only reference input of CPU95, reference input 2 of CPU2000 resembles the training input of CPU95 and reference input 3 is most similar to the training input of CPU95. However, neither of these benchmarks is eccentric. Gcc and perl are programs that are continually evolving. Hence, there is a very large difference in the source code between the versions included in CPU95 and CPU2000. However, the behavior of gcc has changed only slightly: the CPU2000 version benefits more from larger block sizes and from increasing associativity.
4 Related Work It is very common that benchmark suites contain eccentric benchmarks. Charney and Puzak [2] identify some benchmarks in CPU95 that have a different behavior (e.g., perl for its sensitivity to high associativity). However, they do not identify the eccentricity of swim, tomcatv or wave5. Saavedra and Smith [13] construct a method to predict benchmark run-times. They analyze Fortran programs at the source code level and use cluster analysis to determine the similarity of benchmarks. Interestingly, their results show that whetstone (a synthetic benchmark) and livermore and linpack (benchmark kernels) are eccentric, although they do not pay further attention to this. Very few researchers report on fragile benchmarks. Zilles shows that health is completely broken [22]. The synthetic benchmarks whetstone [5] and dhrystone [19] are prone to compiler optimizations. E.g., dead code removal can discard 25% of the code in dhrystone [10]. In previous work, we have applied principal components analysis to analyze the effect of an input on the behavior of a program [7, 8]. The input has little effect on program performance when all program-input pairs for the same program are strongly clustered in the workload space.
5 Conclusion This paper introduces the notions of eccentric and fragile benchmarks. It is shown how these types of benchmarks can be detected using statistical data analysis techniques. These techniques are applied to the CPU95 and CPU2000 benchmark suites. An eccentric benchmark has a behavior that differs significantly from the behavior of other benchmarks. Eccentric benchmarks are useful when constructing benchmark suites, as it is possible to obtain a large coverage of the behavior space with a few eccentric benchmarks. They are also excellent candidates for case studies and it is important to include them when sub-setting a benchmark suite (e.g., to limit simulation time).
A fragile benchmark is a weak benchmark: its behavior can be radically changed by applying trivial or straightforward optimizations. A fragile benchmark is therefore also eccentric. Fragile benchmarks are not useful to measure the impact of an architectural or compiler improvement, as they will either overestimate the usefulness of the technique, or they will underestimate it. The SPEC CPU95 and CPU2000 suites are analyzed for eccentric and fragile benchmarks. CPU95 contains several eccentric benchmarks that are also fragile. These benchmarks (swim, tomcatv and wave5) suffer severely from repetitive conflict misses. This is a defect in the source code as the behavior of these benchmarks is easily changed by optimizing the data layout. CPU2000 contains more eccentric benchmarks. These benchmarks differ from the average CPU2000 benchmark in different ways, e.g., requiring high associativity or suffering from repetitive conflict misses (equake), having low spatial locality (crafty, mesa and perl) or benefiting from extremely large caches (apsi.train).
Acknowledgments Hans Vandierendonck is supported by the Flemish Institute for the Promotion of Scientific-Technological Research in the Industry (IWT).
References [1] L. A. Belady. A study of replacement algorithms for a virtual-storage computer. IBM Systems Journal, 5(2):78– 101, 1966. [2] M. J. Charney and T. R. Puzak. Prefetching and memory system behavior of the SPEC95 benchmark suite. IBM Journal of Research and Development, 41(3):265–285, May 1997. [3] T. M. Chilimbi, M. D. Hill, and J. R. Larus. Cacheconscious structure definition. In Proceedings of the ACM SIGPLAN’1999 Conference on Programming Language Design and Implementation, pages 13–24, 1999. [4] T. M. Conte and W.-m. W. Hwu. Benchmark characterization. IEEE Computer, 24(1):48–56, Jan. 1991. [5] H. Curnow and B. Wichman. A synthetic benchmark. The Computer Journal, 19:43–49, 1976. [6] G. H. Dunteman. Principal Components Analysis. SAGE Publications, 1989. [7] L. Eeckhout, H. Vandierendonck, and K. De Bosschere. Designing computer architecture research workloads. IEEE Computer, 36(2):65–71, Feb. 2003. [8] L. Eeckhout, H. Vandierendonck, and K. De Bosschere. Quantifying the impact of input data sets on program behavior and its applications. Journal of Instruction-Level Parallelism, 5:1–33, 2 2003. [9] J. D. Gee, M. D. Hill, D. N. Pnevmatikatos, and A. J. Smith. Cache performance of the SPEC92 benchmark suite. IEEE Micro, 13(4):17–27, Aug. 1993.
[10] J. L. Hennessy and D. A. Patterson. Computer architecture: A Quantitative Approach. Morgan Kaufmann, 3rd edition, 2003. [11] M. D. Hill and A. J. Smith. Evaluating associativity in CPU caches. IEEE Transactions on Computers, 38(12):1612– 1630, Dec. 1989. [12] E. Horowitz and S. Sahni. Fundamentals of Data Structures in Pascal. Computer Science Press, 2nd edition, 1986. [13] R. H. Saavedra and A. J. Smith. Analysis of benchmark characteristics and benchmark performance prediction. IEEE Transactions on Computers, 14(4):344–384, Nov. 1996. [14] K. Skadron, M. Martonosi, D. I. August, D. Hill, M., D. J. Lilja, and V. S. Pai. Challenges in computer architecture evaluation. IEEE Computer, 36(8):30–36, Aug. 2003. [15] N. Topham and A. Gonz´alez. Randomized cache placement for eliminating conflicts. IEEE Transactions on Computers, 48(2):185–192, Feb. 1999. [16] H. Vandierendonck and K. De Bosschere. Efficient profilebased evaluation of randomising set index functions for cache memories. In 2nd International Symposium on Performance Analysis of Systems and Software, pages 120–127, Nov. 2001. [17] H. Vandierendonck and K. De Bosschere. Evaluation of the performance of polynomial set index functions. In Workshop on Duplicating, Deconstructing and Debunking, held in conjunction with the 29th International Symposium on Computer Architecture (ISCA-29), pages 31–41, May 2002. [18] H. Vandierendonck and K. De Bosschere. Highly accurate and efficient evaluation of randomising set index functions. Journal of Systems Architecture, 48(13–15):429–452, May 2003. [19] R. P. Weicker. Dhrystone: a synthetic systems programming benchmark. Communications of the ACM, 27(10):1013– 1030, Oct. 1984. [20] R. P. Weicker. An example of benchmark obsolescence: 023.eqntott. SPEC Newsletter, Dec. 1995. [21] M. E. Wolf and M. S. Lam. A data locality optimizing algorithm. In Proceedings of the ACM SIGPLAN’1991 Conference on Programming Language Design and Implementation, June 1991. [22] C. B. Zilles. Benchmark health considered harmful. Computer Architecture News, 29(3):4–5, June 2001.