Apr 4, 2011 - known software packages based on this approach include Chaco [17], ...... improvement methods, which are based on max-flow min-cut com-.
Engineering Multilevel Graph Partitioning Algorithms Peter Sanders, Christian Schulz
arXiv:1012.0006v3 [cs.DS] 4 Apr 2011
Karlsruhe Institute of Technology (KIT), 76128 Karlsruhe, Germany {sanders,christian.schulz}@kit.edu
Abstract. We present a multi-level graph partitioning algorithm using novel local improvement algorithms and global search strategies transferred from multigrid linear solvers. Local improvement algorithms are based on max-flow min-cut computations and more localized FM searches. By combining these techniques, we obtain an algorithm that is fast on the one hand and on the other hand is able to improve the best known partitioning results for many inputs. For example, in Walshaw’s well known benchmark tables we achieve 317 improvements for the tables 1%, 3% and 5% imbalance. Moreover, in 118 out of the 295 remaining cases we have been able to reproduce the best cut in this benchmark.
1
Introduction
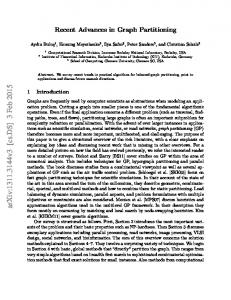
Graph partitioning is a common technique in computer science, engineering, and related fields. For example, good partitionings of unstructured graphs are very valuable in the area of high performance computing. In this area graph partitioning is mostly used to partition the underlying graph model of computation and communication. Roughly speaking, vertices in this graph represent computation units and edges denote communication. Now this graph needs to be partitioned such there are few edges between the blocks (pieces). In particular, if we want to use k PEs (processing elements) we want to partition the graph into k blocks of about equal size. In this paper we focus on a version of the problem that constrains the maximum block size to (1 + �) times the average block size and tries to minimize the total cut size, i.e., the number of edges that run between blocks. A successful heuristic for partitioning large graphs is the multilevel graph partitioning (MGP) approach depicted in Figure 1 where the graph is recursively contracted to achieve smaller graphs which should reflect the same basic structure as the initial graph. After applying an initial partitioning algorithm to the smallest graph, the contraction is undone and, at each level, a local refinement method is used to improve the partitioning induced by the coarser level. Although several successful multilevel partitioners have been developed in the last 13 years, we had the impression that certain aspects of the method are not well understood. We therefore have built our own graph partitioner KaPPa [18] (Karlsruhe Parallel Partitioner) with focus on scalable parallelization. Somewhat astonishingly, we also obtained improved partitioning quality through rather simple methods. This motivated us to make a fresh start putting all aspects of MGP on trial. Our focus is on solution quality and sequential speed for large graphs. We defer the question of parallelization since it introduces complications that make it difficult to try out a large number of alternatives
output partition
contraction phase
...
local improvement
match contract
initial
uncontract
...
refinement phase
input graph
partitioning
Fig. 1. Multilevel graph partitioning.
for the remaining aspects of the method. This paper reports the first results we have obtained which relate to the local improvement methods and overall search strategies. We obtain a system that can be configured to either achieve the best known partitions for many standard benchmark instances or to be the fastest available system for large graphs while still improving partitioning quality compared to the previous fastest system. We begin in Section 2 by introducing basic concepts. After shortly presenting Related Work in Section 3 we continue describing novel local improvement methods in Section 4. This is followed by Section 5 where we present new global search methods. Section 6 is a summary of extensive experiments done to tune the algorithm and evaluate its performance. We have implemented these techniques in the graph partitioner KaFFPa (Karlsruhe Fast Flow Partitioner) which is written in C++. Experiments reported in Section 6 indicate that KaFFPa scales well to large networks and is able to compute partitions of very high quality.
2 2.1
Preliminaries Basic concepts
Consider an undirected graph G = (V, E, c, ω) with edge weights ω : E → R>0 , node weights |, and m = |E|. We extend c and ω to sets, i.e., P c : V → R≥0 , n = |VP c(V 0 ) := v∈V 0 c(v) and ω(E 0 ) := e∈E 0 ω(e). Γ (v) := {u : {v, u} ∈ E} denotes the neighbors of v. We are looking for blocks of nodes V1 ,. . . ,Vk that partition V , i.e., V1 ∪· · ·∪Vk = V and Vi ∩ Vj = ∅ for i 6= j. The balancing constraint demands that ∀i ∈ 1..k : c(Vi ) ≤ Lmax := (1 + �)c(V )/k + maxv∈V c(v) for some parameter �. The last term in this equation arises because each node is atomic and therefore a deviation P of the heaviest node has to be allowed. The objective is to minimize the total cut i ασ 2 + β for some tuning parameters α and β. The Parameter β is a base value that avoids stopping just after a small constant number of steps that happen to have small variance. We also set it to ln n. There are different ways to initialize the queue P , e.g. the complete partition boundary or only the nodes which are incident to more than two partitions (corner nodes). Our implementation takes the complete partition boundary for initialization. In Section 4.2 we introduce multi-try k-way searches which is a more localized k-way search inspired by KaSPar [22]. This method initializes the priority queue with only a single boundary node and its neighbors that are also boundary nodes. The main difference of our implementation to KaSPar is that we use only one priority queue. KaSPar maintains a priority queue for each block. A priority queue is called eligible if the highest gain node in this queue can be moved to its target block without violating the balance constraint. Their local search repeatedly looks for the highest gain node v in any eligible priority queue and moves this node.
3
Related Work
There has been a huge amount of research on graph partitioning so that we refer the reader to [14,25,31] for more material. All general purpose methods that are able to obtain good partitions for large real world graphs are based on the multilevel principle outlined in Section 2. The basic idea can be traced back to multigrid solvers for solving
systems of linear equations [26,11] but more recent practical methods are based on mostly graph theoretic aspects in particular edge contraction and local search. Well known software packages based on this approach include Chaco [17], Jostle [31], Metis [25], Party [10], and Scotch [23]. KaSPar [22] is a new graph partitioner based on the central idea to (un)contract only a single edge between two levels. It previously obtained the best results for many of the biggest graphs in [28]. KaPPa [18] is a "classical" matching based MGP algorithm designed for scalable parallel execution and its local search only considers independent pairs of blocks at a time. DiBaP [21] is a multi-level graph partitioning package where local improvement is based on diffusion which also yields partitions of very high quality. MQI [19] and Improve [1] are flow-based methods for improving graph cuts when cut quality is measured by quotient-style metrics such as expansion or conductance. Given an undirected graph with an initial partitioning, they build up a completely new directed graph which is then used to solve a max flow problem. Furthermore, they have been able to show that there is an improved quotient cut if and only if the maximum flow is less than ca, where c is the initial cut and a is the number of vertices in the smaller block of the initial partitioning. This approach is currently only feasible for k = 2. Improve also uses several minimum cut computations to improve the quotient cut score of a proposed partition. Improve always beats or ties MQI. Very recently an algorithm called PUNCH [7] has been introduced. This approach is not based on the multilevel principle. However, it creates a coarse version of the graph based on the notion of natural cuts. Natural cuts are relatively sparse cuts close to denser areas. They are discovered by finding minimum cuts between carefully chosen regions of the graph. Experiments indicate that the algorithm computes very good cuts for road networks. For instances that don’t have a natural structure such as road networks, natural cuts are not very helpful. The concept of iterated multilevel algorithms was introduced by [27,29]. The main idea is to iterate the coarsening and uncoarsening phase and use the information gathered. That means that once the graph is partitioned, edges that are between two blocks will not be matched and therefore will also not be contracted. This ensures increased quality of the partition if the refinement algorithms guarantees not to find a worse partition than the initial one.
4
Local Improvement
Recall that once a matching is uncontracted a local improvement method tries to reduce the cut size of the projected partition. We now present two novel local improvement methods. The first method which is described in Section 4.1 is based on max-flow mincut computations between pairs of blocks, i.e. improving a given 2-partition. Since each edge of the quotient graph yields a pair of blocks which share a non empty boundary, we integrated this method into the quotient graph style refinement scheme which is described in Section 2.2. The second method which is described in Section 4.2 is called multi-try FM which is a more localized k-way local search. Roughly speaking, a k-way
input graph
output partition
...
local improvement
...
match contract
initial
uncontract
partitioning
Fig. 3. After a matching is uncontracted a local improvement method is applied.
local search is repeatedly started with a priority queue which is initialized with only one random boundary node and its neighbors that are also boundary nodes. At the end of the section we shortly show how the pairwise refinements can be scheduled and how the more localized search can be incorporated with this scheduling. 4.1
Using Max-Flow Min-Cut Computations for Local Improvement
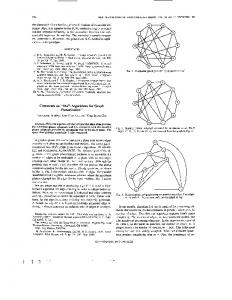
We now explain how flows can be used to improve a given partition of two blocks and therefore can be used as a refinement algorithm in a multilevel framework. For simplicity we assume k = 2. However it is clear that this refinement method fits perfectly into the quotient graph style refinement algorithms. To start with the description of the constructed max-flow min-cut problem, we need a few notations. Given a two-way partition P : V → {1, 2} of a graph G we define the boundary nodes as δ := {u | ∃(u, v) ∈ E : P (u) 6= P (v)}. We define left boundary nodes to be δl := δ ∩ {u | P (u) = 1} and right boundary nodes to be δr := δ ∩ {u | P (u) = 2}. Given a set of nodes B ⊂ V we define its border ∂B := {u ∈ B | ∃(u, v) ∈ E : v 6∈ B}. Unless otherwise mentioned we call B corridor because it will be a zone around the initial cut. The set ∂l B := ∂B ∩ {u | P (u) = 1} is called left corridor border and the set ∂r B := ∂B ∩ {u | P (u) = 2} is called right corridor border. We say an B-corridor induced subgraph G0 is the node induced subgraph G[B] plus two nodes s, t and additional edges starting from s or edges ending in t. An B-corridor induced subgraph has the cut property C if each (s,t)-min-cut in G0 induces a cut within the balance constrained in G. The main idea is to construct a B-corridor induced subgraph G0 with cut property C. On this graph we solve the max-flow min-cut problem. The computed min-cut yields a feasible improved cut within the balance constrained in G. The construction is as follows (see also Figure 4). First we need to find a corridor B such that the B-corridor induced subgraph will have the cut property C. This can be done by performing two Breadth First Searches (BFS). Each node touched during these searches belongs to the corridor B. The first BFS is initialized with the left boundary nodes δl . It is only expanded with nodes that are in block 1. As soon as the weight of the area found by this BFS would exceed (1 + �)c(V )/2 − w(block 2), we stop the BFS. The second BFS is done for block 2 in an analogous fashion. In order to achieve the cut property C, the B-corridor induced subgraph G0 gets additional s-t edges. More precisely s is connected to all left corridor border nodes ∂l B
δl
G
s
b1
∂l B
δr ∂r B
B
t
b2
G
s b1
B
t b2
Fig. 4. The construction of a feasible flow problem which yields optimal cuts in G0 and an improved cut within the balance constraint in G. On the top the initial construction is shown and on the bottom we see the improved partition.
and all right corridor border nodes ∂r B are connected to t. All of these new edges get the edge weight ∞. Note that this are directed edges. The constructed B-corridor subgraph G0 has the cut property C since the worst case new weight of block 2 is lower or equal to w(block 2) + (1 + �)c(V )/2 − w(block 2) = (1 + �)c(V )/2. Indeed the same holds for the worst case new weight of block 1. There are multiple ways to improve this method. First, if we found an improved edge cut, we can apply this method again since the initial boundary has changed which implies that it is most likely that the corridor B will also change. Second, we can adaptively control the size of the corridor B which is found by the BFS. This enables us to search for cuts that fulfill our balance constrained even in a larger corridor ( say �0 = α� for some parameter α ), i.e. if the found min-cut in G0 for �0 fulfills the balance constraint in G, we accept it and increase α to min(2α, α0 ) where α0 is an upper bound for α. Otherwise the cut is not accepted and we decrease α to max( α2 , 1). This method is iterated until a maximal number of iterations is reached or if the computed cut yields a feasible partition without an decreased edge cut. We call this method adaptive flow iterations. Most Balanced Minimum Cuts Picard and Queyranne have been able to show that one (s, t) max-flow contains information about all minimum (s,t)-cuts in the graph. Here finding all minimum cuts reduces to a straight forward enumeration. Having this in mind the idea to search for min-cuts in larger corridors becomes even more attractive. Roughly speaking, we present a heuristic that, given a max-flow, creates min-cuts that are better balanced. First we need a few notations. For a graph G = (V, E) a set C ⊆ V is a closed vertex set iff for all vertices u, v ∈ V , the conditions u ∈ C and (u, v) ∈ E imply v ∈ C. An example can be found in Figure 5. Lemma 1 (Picard and Queyranne [24]). There is a 1-1 correspondence between the minimum (s, t)-cuts of a graph and the closed vertex sets containing s in the residual graph of a maximum (s, t)-flow. To be more precise for a given closed vertex set C containing s of the residual graph the corresponding min-cut is (C, V \C). Note that distinct maximum flows may produce different residual graphs but the set of closed vertex sets remains the same. To enumerate all minimum cuts of a graph [24] a further reduced graph is computed which is described below. However, the problem of finding the minimum cut with the best balance (most balanced minimum cut) is NP-hard [12,2].
s
u
x
v
y
w
z
t
Fig. 5. A small graph where C = {s, u, v, w} is a closed vertex set.
The minimum cut that is identified by the labeling procedure of Ford and Fulkerson [15] is the one with the smallest possible source set. We now define how the representation of the residual graph can be made more compact [24] and then explain the heuristic we use to obtain closed vertex sets on this graph to find min-cuts that have a better balance. After computing a maximum (s, t)-flow, we compute the strongly connected components of the residual graph using the algorithm proposed in [4,16]. We make the representation more compact by contracting these components and refer to it as minimum cut representation. This reduction is possible since two vertices that lie on a cycle have to be in the same closed vertex set of the residual graph. The result is a weighted, directed and acyclic graph (DAG). Note that each closed vertex set of the minimum cut representation induces a minimum cut as well. As proposed in [24] we make the minimum cut representation even more compact: We eliminate the component T containing the sink t, and all its predecessors (since they cannot belong to a closed vertex set not containing T ) and the component S containing the source, and all its successors (since they must belong to a closed vertex set containing S) using a BFS. We are now left with a further reduced graph. On this graph we search for closed vertex sets (containing S) since they still induce (s, t)-min-cuts in the original graph. This is done by using the following heuristic which is repeated a few times. The main idea is that a topological order yields complements of closed vertex sets quite easily. Therefore, we first compute a random topological order, e.g. using a randomized DFS. Next we sweep through this topological order and sequentially add the components to the complement of the closed vertex set. Note that each of the computed complements ˜ That means by sweeping of closed vertex sets C˜ also yields a closed vertex set (V \C). through the topological order we compute closed vertex sets each inducing a min-cut having a different balance. We stop when we have reached the best balanced minimum cut induced through this topological order with respect to the original graph partitioning problem. The closed vertex set with the best balance occurred during the repetitions of this heuristic is returned. Note in large corridors this procedure may finds cuts that are not feasible, e.g. if there is no feasible minimum cut. Therefore the algorithm is combined with the adaptive strategy from above. We call this method balanced adaptive flow iterations.
s
G b1
t
b2
G s
B
b1
t
b2
B
Fig. 6. In the situation on the top it is not possible in the small corridor around the initial cut to find the dashed minimum cut which has optimal balance; however if we solve a larger flow problem on the bottom and search for a cut with good balance we can find the dashed minimum cut with optimal balance but not every min cut is feasible for the underlying graph partitioning problem.
4.2
Multi-try FM
This refinement variant is organized in rounds. In each round we put all boundary nodes of the current block pair into a todo list. The todo list is then permuted. Subsequently, we begin a k-way local search starting with a random node of this list if it is still a boundary node and its neighboring nodes that are also boundary nodes. Note that the difference to the global k-way search described in Section 2.2 is the initialisation of the priority queue. If the selected random node was already touched by a previous k-way search in this round then no search is started. Either way, the node is removed from the todo list (simply swapping it with the last element and executing a pop_back on that list). For a k-way search it is not allowed to move nodes that have been touched in a previous run. This way we can assure that at most n nodes are touched during one round of the algorithm. This algorithm uses the adaptive stopping criteria from KaSPar which is described in Section 2.2.
4.3
Scheduling Quotient Graph Refinement
There a two possibilities to schedule the execution of two way refinement algorithms on the quotient graph. Clearly the first simple idea is to traverses the edges of Q in a random order and perform refinement on them. This is iterated until no change occurred or a maximum number of iterations is reached. The second algorithm is called active block scheduling. The main idea behind this algorithm is that the local search should be done in areas in which change still happens and therefore avoid unnecessary local search. The algorithm begins by setting every block of the partition active. Now the scheduling is organized in rounds. In each round, the algorithm refines adjacent pairs of blocks, which have at least one active block, in a random order. If changes occur during this search both blocks are marked active for the next round of the algorithm. After each pair-wise improvement a multi-try FM search (k-way) is started. It is initialized with the boundaries of the current pair of blocks. Now each block which changed during this search is also marked active. The algorithm stops if no active block is left. Pseudocode for the algorithm can be found in the appendix in Figure 11.
5
Global Search
Iterated Multilevel Algorithms where introduced by [27,29] (see Section 3). For the rest of this paper Iterated Multilevel Algorithms are called V -cycles unless otherwise mentioned. The main idea is that if a partition of the graph is available then it can be reused during the coarsening and uncoarsening phase. To be more precise, the multilevel scheme is repeated several times and once the graph is partitioned, edges between two blocks will not be matched and therefore will also not be contracted such that a given partition can be used as initial partition of the coarsest graph. This ensures increased quality of the partition if the refinement algorithms guarantees not to find a worse partition than the initial one. Indeed this is only possible if the matching includes non-deterministic factors such as random tie-breaking, so that each iteration is very likely to give different coarser graphs. Interestingly, in multigrid linear solvers FullMultigrid methods are generally preferable to simple V -cycles [3]. Therefore, we now introduce two novel global search strategies namely W-cycles and F-cycles for graph partitioning. A W-cycle works as follows: on each level we perform two independent trials using different random seeds for tie breaking during contraction, and local search. As soon as the graph is partitioned, edges that are between blocks are not matched. A F-cycle works similar to a W-cycle with the difference that the global number of independent trials on each level is bounded by 2. Examples for the different cycle types can be found in Figure 7 and Pseudocode can be found in Figure 10. Again once the graph is partitioned for the first time, then this partition is used in the sense that edges between two blocks are not contracted. In most cases the initial partitioner is not able to improve this partition from scratch or even to find this partition. Therefore no further initial partitioning is used if the graph already has a partition available. These methods can be used to find very high quality partitions but on the other hand they are more expensive than a single MGP run. However, experiments in Section 6 show that all cycle variants are more efficient than simple plain restarts of the algorithm. In order to bound the runtime we introduce a level split parameter d such that the independent trials are only performed every d’th level. We go into more detail after we have analysed the run time of the global search strategies.
Fig. 7. From left to right: A single MGP V-cycle, a W-cycle and a F-cycle.
Analysis We now roughly analyse the run time of the different global search strategies under a few assumptions. In the following the shrink factor names the factor the graph shrinks during one coarsening step. Theorem 1. If the time for coarsening and refinement is Tcr (n) := bn and a constant shrink factor a ∈ [1/2, 1) is given. Then: d / 1−a T (n) if 2ad < 1 1−2ad V if 2ad = 1 (1) TW,d (n) ∈ Θ(n log n) log 2 log 1 d ∈ Θ(n ad ) if 2a > 1 1 TV (n) (2) 1 − ad where TV is the time for a single V-cycle and TW,d ,TF,d are the time for a W-cycle and F-cycle with level split parameter d. Pl Pl Proof. The run time of a single V-cycle is given by TV (n) = i=0 Tcr (ai n) = bn i=0 ai = bn(1 − al+1 )/(1 − a). The run time of a W-cycle with level split parameter d is given by the time of d coarsening and refinement steps plus the time of the two trials on the created coarse graph. For the case 2ad < 1 we get TF,d (n) ≤
TW,d (n) = bn
d−1 X
ai + 2TW,d (ad n) ≤ bn
i=0
≤
∞ 1 − ad X d i (2a ) 1 − a i=0
1 − ad 1 − ad T (n) ≈ TV (n). V (1 − al+1 )(1 − 2ad ) 1 − 2ad
The other two cases for the W-cycle follow directly from the master theorem for analyzing divide-and-conquer recurrences. To analyse the run time of a F-cycle we observe that TF,d (n) ≤
l X i=0
∞
Tcr (ai·d n) ≤
bn X d i 1 (a ) = TV (n) 1 − a i=0 1 − ad
where l is the total number of levels. This completes the proof of the theorem. Note that if we make the optimistic assumption that a = 1/2 and set d = 1 then a Fcycle is only twice as expensive as a single V-cycle. If we use the same parameters for a W-cycle we get a factor log n asymptotic larger execution times. However in practice the shrink factor is usually worse than 1/2. That yields an even larger asymptotic run time for the W-cycle (since for d = 1 we have 2a > 1). Therefore, in order to bound the run time of the W-cycle the choice of the level split parameter d is crucial. Our default value for d for W- and F-cycles is 2, i.e. independent trials are only performed every second level.
6
Experiments
Implementation We have implemented the algorithm described above using C++. Overall, our program consists of about 12 500 lines of code. Priority queues for the local search are based on binary heaps. Hash tables use the library (extended STL) provided with the GCC compiler. For the following comparisons we used Scotch 5.1.9., DiBaP 2.0.229 and kMetis 5.0 (pre2). The flow problems are solved using Andrew Goldbergs Network Optimization Library HIPR [5] which is integrated into our code. System We have run our code on a cluster where each node is equipped with two Quadcore Intel Xeon processors (X5355) which run at a clock speed of 2.667 GHz, has 2x4 MB of level 2 cache each and run Suse Linux Enterprise 10 SP 1. Our program was compiled using GCC Version 4.3.2 and optimization level 3. Instances We report experiments on two suites of instances summarized in the appendix in Table 5. These are the same instances as used for the evaluation of KaPPa [18]. We present them here for completeness. rggX is a random geometric graph with 2X nodes where nodes represent random points p in the unit square and edges connect nodes whose Euclidean distance is below 0.55 ln n/n. This threshold was chosen in order to ensure that the graph is almost connected. DelaunayX is the Delaunay triangulation of 2X random points in the unit square. Graphs bcsstk29 ..fetooth and ferotor ..auto come from Chris Walshaw’s benchmark archive [30]. Graphs bel , nld , deu and eur are undirected versions of the road networks of Belgium, the Netherlands, Germany, and Western Europe respectively, used in [8]. Instances af _shell9 and af _shell10 come from the Florida Sparse Matrix Collection [6]. For the number of partitions k we choose the values used in [30]: 2, 4, 8, 16, 32, 64. Our default value for the allowed imbalance is 3 % since this is one of the values used in [30] and the default value in Metis. Configuring the Algorithm We currently define three configurations of our algorithm: Strong, Eco and Fast. The configurations are described below. KaFFPa Strong: The aim of this configuration is to obtain a graph partitioner that is able to achieve the best known partitions for many standard benchmark instances. It uses the GPA algorithm as a matching algorithm combined with the rating function expansion∗2 . However, the rating function expansion∗2 has the disadvantage that it evaluates to one on the first level of an unweighted graph. Therefore, we employ innerOuter on the first level to infer structural information of the graph. We perform 100/ log k initial partitioning attempts using Scotch as an initial partitioner. The refinement phase first employs k-way refinement (since it converges very fast) which is initialized with the complete partition boundary. It uses the adaptive search strategy from KaSPar [22] with α = 10. The number of rounds is bounded by ten. However, the k-way local search is stopped as soon as a k-way local search round did not find an improvement. We continue by performing quotient-graph style refinement. Here we use the active block scheduling algorithm which is combined with the multi-try local search (again α = 10) as described in Section 4.3. A pair of blocks is refined as follows: We start with a pairwise FM search which is followed by the max-flow min-cut algorithm (including the most balancing cut heuristic). The FM search is stopped if more than 5%
of the number of nodes in the current block pair have been moved without yielding an improvement. The upper bound factor for the flow region size is set to α0 = 8. As global search strategy we use two F-cycles. Initial Partitioning is only performed if previous partitioning information is not available. Otherwise, we use the given input partition. KaFFPa Eco: The aim of KaFFPa Eco is to obtain a graph partitioner that is fast on the one hand and on the other hand is able to compute partitions of high quality. This configuration matches the first max(2, 7 − log k) levels using a random matching algorithm. The remaining levels are matched using the GPA algorithm employing the edge rating function expansion∗2 . It then performs min(10, 40/ log k) initial partitioning repetitions using Scotch as initial partitioner. The refinement is configured as follows: again we start with k-way refinement as in KaFFPa-Strong. However, for this configuration the number of k-way rounds is bounded by min(5, log k). We then apply quotient-graph style refinements as in KaFFPa Strong; again with slightly different parameters. The two-way FM search is stopped if 1% of the number of nodes in the current block pair has been moved without yielding an improvement. The flow region upper bound factor is set to α0 = 2. We do not apply a more sophisticated global search strategy in order to be competitive regarding runtime. KaFFPa Fast: The aim of KaFFPa Fast is to get the fastest available system for large graphs while still improving partitioning quality to the previous fastest system. KaFFPa Fast matches the first four levels using a random matching algorithm. It then continues by using the GPA algorithm equipped with expansion∗2 as a rating function. We perform exactly one initial partitioning attempt using Scotch as initial partitioner. The refinement phase works as follows: for k ≤ 8 we only perform quotient-graph refinement: each pair of blocks is refined exactly once using the pair-wise FM algorithm. Pairs of blocks are scheduled randomly. For k > 8 we only perform one k-way refinement round. In both cases the local search is stopped as soon as 15 steps have been performed without yielding an improvement. Note that using flow based algorithms for refinement is already too expensive. Again we do not apply a more sophisticated global search strategy in order to be competitive regarding runtime. Experiment Description We performed two types of experiments namely normal tests and tests for effectiveness. Both are described below. Normal Tests: Here we perform 10 repetitions for the small networks and 5 repetitions for the other. We report the arithmetic average of computed cut size, running time and the best cut found. When further averaging over multiple instances, we use the geometric mean in order to give every instance the same influence on the final score. 1 Effectiveness Tests: Here each algorithm configuration has the same time for computing a partition. Therefore, for each graph and k each configuration is executed once and we remember the largest execution time t that occurred. Now each algorithm gets time 3t to compute a good partition, i.e. taking the best partition out of repeated runs. If a variant can perform a next run depends on the remaining time, i.e. we flip a coin with 1
Because we have multiple repetitions for each instance (graph, k), we compute the geometric mean of the average (Avg.) edge cut values for each instance or the geometric mean of the best (Best.) edge cut value occurred. The same is done for the runtime t of each algorithm configuration.
corresponding probabilities such that the expected time over multiple runs is 3t. This is repeated 5 times. The final score is computed as in the normal test using these values.
6.1
Insights about Flows
We now evaluate how much the usage of max-flow min-cut algorithms improves the final partitioning results and check its effectiveness. For this test we use a basic two-way FM configuration to compare with. This basic configuration is modified as described below to look at a specific algorithmic component regarding flows. It uses the Global Paths Algorithm as a matching algorithm and performs five initial partitioning attempts using Scotch as initial partitioner. It further employs the active block scheduling algorithm equipped with the two-way FM algorithm described in Section 2.2. The FM algorithm stopps as soon as 5% of the number of nodes in the current block pair have been moved without yielding an improvement. Edge rating functions are used as in KaFFPa Strong. Note that during this test our main focus is the evaluation of flows and therefore we don’t use k-way refinement or multi-try FM search. For comparisons this basic configuration is extended by specific algorithms, e.g. a configuration that uses Flow, FM and the most balanced cut heuristics (MB). This configuration is then indicated by (+Flow, +FM, +MB). In Table 1 we see that by Flow on its own, i.e. no FM-algorithm is used at all, we obtain cuts and run times which are worse than the basic two-way FM configuration. The results improve in terms of quality and runtime if we enable the most balanced minimum cut heuristic. Now for α0 = 16 and α0 = 8, we get cuts that are 0.81% and 0.41% lower on average than the cuts produced by the basic two-way FM configuration. However, these configurations have still a factor four (α0 = 16) or a factor two (α0 = 8) larger run times. In some cases, flows and flows with the MB heuristic are not able to produce results that are comparable to the basic two-way FM configuration. Perhaps, this is due to the lack of the method to accept suboptimal cuts which yields small flow problems and therefore bad cuts. Consequently, we also combined both methods to fix this problem. In Table 1 we can see that the combination of flows with local
Variant α0 16 8 4 2 1 Ref.
(+Flow, -MB, -FM ) (+Flow, +MB, -FM) Avg. Best. Bal. t Avg. Best. Bal. t −1.88 −1.28 1.03 4.17 0.81 0.35 1.02 3.92 −2.30 −1.86 1.03 2.11 0.41 −0.14 1.02 2.07 −4.86 −3.78 1.02 1.24 −2.20 −2.80 1.02 1.29 −11.86 −10.35 1.02 0.90 −9.16 −8.24 1.02 0.96 −19.58 −18.26 1.02 0.76 −17.09 −16.39 1.02 0.80 (-Flow, -MB, +FM) 2 974 2 851 1.025 1.13
(+Flow, -MB, +FM) Avg. Best. Bal. t 6.14 5.44 1.03 4.30 5.99 5.40 1.03 2.41 5.27 4.70 1.03 1.62 3.66 3.37 1.02 1.31 1.64 1.68 1.02 1.19
(+Flow, +MB, +FM) Avg. Best. Bal. t 7.21 6.06 1.02 5.01 7.06 5.87 1.02 2.72 6.21 5.36 1.02 1.76 4.17 3.82 1.02 1.39 1.74 1.75 1.02 1.22
Table 1. The final score of different algorithm configurations compared against the basic two-way FM configuration. The parameter α0 is the flow region upper bound factor. All average and best cut values except for the basic configuration are improvements relative to the basic configuration in %.
Effectiveness
(+Flow, +MB, -FM) Avg. Best. α0 = 1 −16.41 −16.35 2 −8.26 −8.07 4 −3.05 −3.08 8 −1.12 −1.34 16 −1.29 −1.27 (-Flow, -MB, +FM) 2 833 2 803
(+Flow,-MB, +FM) Avg. Best. 1.62 1.52 3.02 2.83 4.04 3.82 4.16 4.13 3.70 3.86 2 831 2 801
(+Flow,+MB,+FM) Avg. Best. 1.65 1.63 3.36 3.25 4.63 4.36 4.74 4.64 4.28 4.36 2 827 2 799
Table 2. Three effectiveness tests each one with six different algorithm configurations. All average and best cut values except for the basic configuration are improvements relative to the basic configuration in %.
search produces up to 6.14% lower cuts on average than the basic configuration. If we enable the most balancing cut heuristic we get on average 7.21% lower cuts than the basic configuration. Since these configurations are the basic two-way FM configuration augmented by flow algorithms they have an increased run time compared to the basic configuration. However, Table 2 shows that these combinations are also more effective than the repeated execution of the basic two-way FM configuration. The most effective configuration is the basic two-way FM configuration using flows with α0 = 8 and uses the most balanced cut heuristic. It yields 4.73% lower cuts than the basic configuration in the effectiveness test. Absolute values for the test results can be found in Table 6 and Table 7 in the Appendix. 6.2
Insights about Global Search Strategies
In Table 3 we compared different global search strategies against a single V-cycle. This time we choose a relatively fast configuration of the algorithm as basic configuration since the global search strategies are at focus. The coarsening phase is the same as in KaFFPa Strong. We perform one initial partitioning attempt using Scotch. The refinement employs k-way local search followed by quotient graph style refinements. Flow algorithms are not enabled for this test. The only parameter varied during this test is the global search strategy. Clearly, more sophisticated global search strategies decrease the cut but also increase the runtime of the algorithm. However, the effectiveness results in Table 3 indicate that repeated executions of more sophisticated global search strategies are always superior to repeated executions of one single V-cycle. The largest difference in best cut effectiveness is obtained by repeated executions of 2 W-cycles and 2 F-cycles which produce 1.5% lower best cuts than repeated executions of a normal V-cycle. The increased effectiveness of more sophisticated global search strategies is due to different reasons. First of all by using a given partition in later cycles we obtain a very good initial partitioning for the coarsest graph. This initial partitioning is usually much better than a partition created by another initial partitioner which yields good start points for local improvement on each level of refinement. Furthermore, the increased effectiveness is due to time saved using the active block strategy which converges very
quickly in later cycles. On the other hand we save time for initial partitioning which is only performed the first time the algorithm arrives in the initial partitioning phase. It is interesting to see that although the analysis in Section 5 makes some simplified assumptions the measured run times in Table 3 are very close to the values obtained by the analysis.
Algorithm 2 F-cycle 3 V-cycle 2 W-cycle 1 W-cycle 1 F-cycle 2 V-cycle 1 V-cycle
Avg. 2.69 2.69 2.91 1.33 1.09 1.88 2 973
Best 2.45 2.34 2.75 1.10 1.00 1.61 2 841
Bal. 1.023 1.023 1.024 1.024 1.024 1.024 1.024
t Eff. Avg. Eff. Best 2.31 2 806 2 760 2.49 2 810 2 766 2.77 2 810 2 760 1.38 2 815 2 773 1.18 2 816 2 783 1.67 2 817 2 778 0.85 2 834 2 801
Table 3. Test results for normal and effectiveness tests for different global search strategies. The average cut and best cut values are improvements in % relative to the basic configuration (1 V-cycle). For F- and W-cycles d = 2. Absolute values can be found in Table 8 in the Appendix.
6.3
Removal / Knockout Tests
We now turn into two kinds of experiments to evaluate interactions and relative importance of our algorithmic improvements. In the component removal tests we take KaFFPa Strong and remove components step by step yielding weaker and weaker variants of the algorithm. For the knockout tests only one component is removed at a time, i.e. each variant is exactly the same as KaFFPa Strong minus the specified component. In the following, KWay means the global k-way search component of KaFFPa Strong, Multitry stands for the more localized k-way search during the active block scheduling algorithm and -Cyc means that the F-Cycle component is replaced by one V-cycle. Furthermore, MB stands for the most balancing minimum cut heuristic, and Flow means the flow based improvement algorithms. In Table 4 we see results for the component removal tests and knockout tests. More detailed results can be found in the appendix. First notice that in order to achieve high quality partitions we don’t need to perform classical global k-way refinement (KWay). The changes in solution quality are negligible and both configurations (Strong without KWay and Strong) are equally effective. However, the global k-way refinement algorithm converges very quickly and therefore speeds up overall runtime of the algorithm; hence we included it into our KaFFPa Strong configuration. In both tests the largest differences are obtained when the components Flow and/or the Multitry search heuristic are removed. When we remove all of our new algorithmic components from KaFFPa Strong, i.e global k-way search, local multitry search, FCycles, and Flow we obtain a graph partitioner that produces 9.3% larger cuts than KaFFPa Strong. Here the effectiveness average cut of the weakest variant in the removal test is about 6.2% larger than the effectiveness average cut of KaFFPa Strong. Also note that as soon as a component is removed from KaFFPa Strong (except for the global kway search) the algorithm gets less effective.
Variant Avg. Best. t Eff. Avg. Eff. Best. Strong 2 683 2 617 8.93 2 636 2 616 -KWay −0.04 −0.11 9.23 0.00 0.08 -Multitry 1.71 1.49 5.55 1.21 1.30 -Cyc 2.42 1.95 3.27 1.25 1.41 -MB 3.35 2.64 2.92 1.82 1.91 -Flow 9.36 7.87 1.66 6.18 6.08 Variant Avg. Best. t Eff. Avg. Eff. Best. Strong 2 683 2 617 8.93 2 636 2 616 -KWay −0.04 −0.11 9.23 0.00 0.08 -Multitry 1.27 1.11 5.52 0.83 0.99 -MB 0.26 0.08 8.34 0.11 0.11 -Flow 1.53 0.99 6.33 0.87 0.80 Table 4. Removal tests (top): each configuration is same as its predecessor minus the component shown at beginning of the row. Knockout tests (bottom): each configuration is same as KaFFPa Strong minus the component shown at beginning of the row. All average cuts and best cuts are shown as increases in cut (%) relative to the values obtained by KaFFPa Strong.
6.4
Comparison with other Partitioners
We now switch to our suite of larger graphs since that’s what KaFFPa was designed for and because we thus avoid the effect of overtuning our algorithm parameters to the instances used for calibration. We compare ourselves with KaSPar Strong, KaPPa Strong, DiBaP Strong, Scotch and Metis. Figure 8 summarizes the results. We excluded the European and German road network as well as the Random Geometric Graph for the comparison with DiBaP since DiBaP can’t handle singletons. In general, we excluded the case k = 2 for the European road network for the comparison since it runs out of memory for this case. As recommended by Henning Meyerhenke DiBaP was run with 3 bubble repetitions, 10 FOS/L consolidations and 14 FOS/L iterations. Detailed per instance results can be found in Appendix Table 13. kMetis produces about 33% larger cuts than the strong variant of KaFFPa. Scotch, DiBaP, KaPPa, and KaSPar produce 20%,11%, 12% and 3% larger cuts than KaFFPa respectively. The strong variant of KaFFPa now produces the average best cut results of KaSPar on average (which where obtained using five repeated executions of KaSPar). In 57 out of 66 cases KaFFPa produces a better best cut than the best cut obtained by KaSPar. The largest absolute improvement to KaSPar Strong is obtained on af_shell10 at k = 16 where the best cut produced by KaSPar-Strong is 7.2% larger than the best cut produced by KaFFPa Strong. The largest absolute improvement to kMetis is obtained on the European road network where kMetis produces cuts that are a factor 5.5 larger than the edge cuts produces by our strong configuration. The eco configuration of KaFFPa now outperforms Scotch and DiBaP being than DiBaP while producing 4.7 % and 12% smaller cuts than DiBap and Scotch respectively. The run time difference to both algorithms gets larger with increasing number of
1.00 0.95 0.90 0.85 0.80
is et M
ot
a
ch K
Sc
aP P
r aS
K
Pa
t as K
aF K
aF
FP
FP aF K
large graphs best avg. t[s] KaFFPa Strong 12 054 12 182 121.50 KaSPar Strong 12 450 +3% 87.12 KaFFPa Eco 12 763 +6% 3.82 KaPPa Strong 13 323 +12% 28.16 Scotch 14 218 +20% 3.55 KaFFPa Fast 15 124 +24% 0.98 kMetis 15 167 +33% 0.83
K
aF
FP
aS
tro
aE
ng
co
0.70
0.75
Edge cut relative to KMetis
algorithm
Fig. 8. Averaged quality of the different partitioning algorithms.
blocks. Note that DiBaP has a factor 3 larger run times than KaFFPa Eco on average and up to factor 4 on average for k = 64. On the largest graphs available to us (delaunay, rgg, eur) KaFFPa Fast outperforms KMetis in terms of quality and runtime. For example on the european road network kMetis has about 44% larger run times and produces up to a factor 3 (for k = 16) larger cuts. We now turn into graph sequence tests. Here we take two graph families (rgg, delaunay) and study the behaviour of our algorithms when the graph size increases. In Figure 9, we see for increasing size of random geometric graphs the run time advantage of KaFFPa Fast relative to kMetis increases. The largest difference is obtained on the largest graph where kMetis has 70% larger run times than our fast configuration which still produces 2.5% smaller cuts. We observe the same behaviour for the delaunay based graphs (see appendix for more details). Here we get a run time advantage of up to 24% with 6.5% smaller cuts for the largest graph. Also note that for these graphs the improvement of KaFFPa Strong and Eco in terms of quality relative to kMetis increases with increasing graph size (up to 32% for delaunay and up to 47% for rgg for our strong configuration). 6.5
The Walshaw Benchmark
We now apply KaFFPa to Walshaw’s benchmark archive [30] using the rules used there, i.e., running time is no issue but we want to achieve minimal cut values for k ∈ {2, 4, 8, 16, 32, 64} and balance parameters � ∈ {0, 0.01, 0.03, 0.05}. We tried all combinations except the case � = 0 because flows are not made for this case. We ran KaFFPa Strong with a time limit of two hours per graph and k and report the best result obtained in the appendix. KaFFPa computed 317 partitions which are better that previous best partitions reported there: 99 for 1%, 108 for 3% and 110 for 5%. Moreover, it reproduced equally sized cuts in 118 of the 295 remaining cases. The complete list of improvements is available at Walshaw’s archive [30]. We obtain only a few improvements for k = 2. However, in this case we are able to reproduce the currently best result in 91 out of 102 cases. For the large graphs (using 78000 nodes as
1.2
+
1.0
+
+
+ +
+
+ +
+
+ +
+ +
+ +
+ +
+ +
+
+
+
+
+
+
+
+
216
217
218
219
220
221
222
223
224
|V|
1.5
+
+
+
+ + + + +
+
+
+
+
+
+
+
+
+
+
+
+
+
+
+
+
+
215
216
217
218
219
220
221
222
223
224
+ 0.0
215
+
+ 1.0
+ +
KaFFPa−Fast KaFFPa−Eco KaFFPa−Strong
+
0.5
+
Average speedup relative to Kmetis
1.6 1.4
Random Geometric Graphs
0.8
Average improvement relative to Kmetis
Random Geometric Graphs KaFFPa−Fast KaFFPa−Eco KaFFPa−Strong
+
|V|
Fig. 9. Graph sequence test for Random Geometric Graphs.
a cut off) we obtain cuts that are lower or equal to the current entry in 92% of the cases. The biggest absolute improvement is observed for instance add32 (for each imbalance) and k = 4 where the old partitions cut 10 % more edges. The biggest absolute difference is obtained for m14b at 3 % imbalance and k = 64 where the new partition cuts 3183 less edges. After the partitions were accepted, we ran KaFFPa Strong as before and took the previous entry as input. Now in 560 out of 612 cases we where able to improve a given entry or have been able to reproduce the current result.
7
Conclusions and Future Work
KaFFPa is an approach to graph partitioning which currently computes the best known partitions for many graphs, at least when a certain imbalance is allowed. This success is due to new local improvement methods, which are based on max-flow min-cut computations and more localized local searches, and global search strategies which were transferred from multigrid linear solvers. A lot of opportunities remain to further improve KaFFPa. For example we did not try to handle the case � = 0 since this may require different local search strategies. Furthermore, we want to try other initial partitioning algorithms and ways to integrate KaFFPa into other metaheuristics like evolutionary search. Moreover, we would like to go back to parallel graph partitioning. Note that our max-flow min-cut local improvement methods fit very well into the parallelization scheme of KaPPa [18]. We also want to combine KaFFPa with the n-level idea from KaSPar [22]. Other refinement algorithms, e.g., based on diffusion or MQI could be tried within our framework of pairwise refinement. The current implementation of KaFFPa is a research prototype rather than a widely usable tool. However, we are planing an open source release available for download.
Acknowledgements We would like to thank Vitaly Osipov for supplying data for KaSPar and Henning Meyerhenke for providing a DiBaP-full executable. We also thank Tanja Hartmann, Robert Görke and Bastian Katz for valuable advice regarding balanced min cuts.
References 1. R. Andersen and K.J. Lang. An algorithm for improving graph partitions. In Proceedings of the nineteenth annual ACM-SIAM symposium on Discrete algorithms, pages 651–660. Society for Industrial and Applied Mathematics, 2008. 2. P. Bonsma. Most balanced minimum cuts. Discrete Applied Mathematics, 158(4):261–276, 2010. 3. W.L. Briggs and S.F. McCormick. A multigrid tutorial. Society for Industrial Mathematics, 2000. 4. J. Cheriyan and K. Mehlhorn. Algorithms for dense graphs and networks on the random access computer. Algorithmica, 15(6):521–549, 1996. 5. B.V. Cherkassky and A.V. Goldberg. On Implementing the Push-Relabel Method for the Maximum Flow Problem. Algorithmica, 19(4):390–410, 1997. 6. T. Davis. The University of Florida Sparse Matrix Collection, http://www.cise.ufl. edu/research/sparse/matrices, 2008. 7. D. Delling, A.V. Goldberg, I. Razenshteyn, and R.F. Werneck. Graph Partitioning with Natural Cuts. Technical report, Microsoft Research, MSR-TR-2010-164, 2010. 8. D. Delling, P. Sanders, D. Schultes, and D. Wagner. Engineering route planning algorithms. In Algorithmics of Large and Complex Networks, volume 5515 of LNCS State-of-the-Art Survey, pages 117–139. Springer, 2009. 9. D. Drake and S. Hougardy. A simple approximation algorithm for the weighted matching problem. Information Processing Letters, 85:211–213, 2003. 10. R. Preis et al. PARTY partitioning library. http://wwwcs.uni-paderborn.de/ fachbereich/AG/monien/RESEARCH/PART/party.html. 11. R. P. Fedorenko. A relaxation method for solving elliptic difference equations. USSR Comput. Math. and Math. Phys, 5(1):1092–1096, 1961. 12. U. Feige and M. Mahdian. Finding small balanced separators. In Proceedings of the thirtyeighth annual ACM symposium on Theory of computing, pages 375–384. ACM, 2006. 13. C. M. Fiduccia and R. M. Mattheyses. A Linear-Time Heuristic for Improving Network Partitions. In 19th Conference on Design Automation, pages 175–181, 1982. 14. P.O. Fjallstrom. Algorithms for graph partitioning: A survey. Linkoping Electronic Articles in Computer and Information Science, 3(10), 1998. 15. L. R. Ford and D. R. Fulkerson. Flows in Networks. Princeton University Press, 1962. 16. H.N. Gabow. Path-Based Depth-First Search for Strong and Biconnected Components. Information Processing Letters, 74(3-4):107–114, 2000. 17. B. Hendrickson. Chaco: Software for partitioning graphs. http://www.sandia.gov/ ~bahendr/chaco.html. 18. M. Holtgrewe, P. Sanders, and C. Schulz. Engineering a Scalable High Quality Graph Partitioner. 24th IEEE International Parallal and Distributed Processing Symposium, 2010. 19. K. Lang and S. Rao. A flow-based method for improving the expansion or conductance of graph cuts. Integer Programming and Combinatorial Optimization, pages 383–400, 2004. 20. J. Maue and P. Sanders. Engineering algorithms for approximate weighted matching. In 6th Workshop on Exp. Algorithms (WEA), volume 4525 of LNCS, pages 242–255. Springer, 2007.
21. H. Meyerhenke, B. Monien, and T. Sauerwald. A new diffusion-based multilevel algorithm for computing graph partitions of very high quality. In IEEE International Symposium on Parallel and Distributed Processing, 2008. IPDPS 2008., pages 1–13, 2008. 22. V. Osipov and P. Sanders. n-Level Graph Partitioning. 18th European Symposium on Algorithms (see also arxiv preprint arXiv:1004.4024), 2010. 23. F. Pellegrini. Scotch home page. http://www.labri.fr/pelegrin/scotch. 24. J.C. Picard and M. Queyranne. On the structure of all minimum cuts in a network and applications. Mathematical Programming Studies, Volume 13, pages 8–16, 1980. 25. K. Schloegel, G. Karypis, and V. Kumar. Graph partitioning for high performance scientific simulations. In J. Dongarra et al., editor, CRPC Par. Comp. Handbook. Morgan Kaufmann, 2000. 26. R. V. Southwell. Stress-calculation in frameworks by the method of “Systematic relaxation of constraints”. Proc. Roy. Soc. Edinburgh Sect. A, pages 57–91, 1935. 27. M. Toulouse, K. Thulasiraman, and F. Glover. Multi-level cooperative search: A new paradigm for combinatorial optimization and an application to graph partitioning. Euro-Par 99 Parallel Processing, pages 533–542, 1999. 28. C. Walshaw. The Graph Partitioning Archive, http://staffweb.cms.gre.ac.uk/ ~c.walshaw/partition/, 2008. 29. C. Walshaw. Multilevel refinement for combinatorial optimisation problems. Annals of Operations Research, 131(1):325–372, 2004. 30. C. Walshaw and M. Cross. Mesh Partitioning: A Multilevel Balancing and Refinement Algorithm. SIAM Journal on Scientific Computing, 22(1):63–80, 2000. 31. C. Walshaw and M. Cross. JOSTLE: Parallel Multilevel Graph-Partitioning Software – An Overview. In F. Magoules, editor, Mesh Partitioning Techniques and Domain Decomposition Techniques, pages 27–58. Civil-Comp Ltd., 2007. (Invited chapter).
procedure W-Cycle(G) G0 =coarsen(G) if G0 small enough then initial partition G0 if not partitioned apply partition of G0 to G perform refinement on G else W-Cycle(G0 ) and apply partition to G perform refinement on G G00 =coarsen(G) W-Cycle(G00 ) and apply partition to G perform refinement on G procedure F-Cycle(G) G0 =coarsen(G) if G0 small enough then initial partition G0 if not partitioned apply partition of G0 to G perform refinement on G else F-Cycle(G0 ) and apply partition to G perform refinement on G if no. trails. calls on cur. level < 2 then G00 =coarsen(G) F-Cycle(G00 ) and apply partition to G perform refinement on G
Fig. 10. Pseudocode for the different global search strategies.
procedure activeBlockScheduling() set all blocks active while there are active blocks A := set all blocks inactive permute A randomly for each (u,v) in A do pairWiseImprovement(u,v) multitry FM search starting with boundary of u and v if anything changed during local search then activate blocks that have changed during pairwise or multitry FM search Fig. 11. Pseudocode for the active block scheduling algorithm. In our implementation the pairwise improvement step starts with a FM local search which is followed by a max-flow min-cut based improvement.
Medium sized instances graph n m rgg17 217 1 457 506 rgg18 218 3 094 566 Delaunay17 217 786 352 Delaunay18 218 1 572 792 bcsstk29 13 992 605 496 4elt 15 606 91 756 fesphere 16 386 98 304 cti 16 840 96 464 memplus 17 758 108 384 cs4 33 499 87 716 pwt 36 519 289 588 bcsstk32 44 609 1 970 092 body 45 087 327 468 t60k 60 005 178 880 wing 62 032 243 088 finan512 74 752 522 240 rotor 99 617 1 324 862 bel 463 514 1 183 764 nld 893 041 2 279 080 af_shell9 504 855 17 084 020 Large instances rgg20 220 Delaunay20 220 fetooth 78 136 598a 110 971 ocean 143 437 144 144 649 wave 156 317 m14b 214 765 auto 448 695 deu 4 378 446 eur 18 029 721 af_shell10 1 508 065
13 783 240 12 582 744 905 182 1 483 868 819 186 2 148 786 2 118 662 3 358 036 6 629 222 10 967 174 44 435 372 51 164 260
Table 5. Basic properties of the graphs from our benchmark set. The large instances are split into four groups: geometric graphs, FEM graphs, street networks, sparse matrices. Within their groups, the graphs are sorted by size.
Variant α0 16 8 4 2 1 (-Flow, -MB, +FM)
(+Flow, -MB, -FM ) Avg. Best. Bal. t 3 031 2 888 1.025 4.17 3 044 2 905 1.025 2.11 3 126 2 963 1.024 1.24 3 374 3 180 1.022 0.90 3 698 3 488 1.018 0.76 2 974 2 851 1.025 1.13
(+Flow, +MB, -FM) Avg. Best. Bal. t 2 950 2 841 1.023 3.92 2 962 2 855 1.023 2.07 3 041 2 933 1.021 1.29 3 274 3 107 1.018 0.96 3 587 3 410 1.016 0.80
(+Flow, -MB, +FM) Avg. Best. Bal. t 2 802 2 704 1.025 4.30 2 806 2 705 1.025 2.41 2 825 2 723 1.025 1.62 2 869 2 758 1.024 1.31 2 926 2 804 1.024 1.19
(+Flow, +MB, +FM) Avg. Best. Bal. t 2 774 2 688 1.023 5.01 2 778 2 693 1.023 2.72 2 800 2 706 1.022 1.76 2 855 2 746 1.021 1.39 2 923 2 802 1.023 1.22
Table 6. The final score of different algorithm configurations compared against the basic two-way FM configuration. Here α0 is the flow region upper bound factor. The values are average values as described in Section 6.
Effectiveness (+Flow, +MB, -FM) α0 = 1 2 4 8 16 (-Flow, -MB, +FM)
Avg. 3 389 3 088 2 922 2 865 2 870 2 833
Best. 3 351 3 049 2 892 2 841 2 839 2 803
Bal. 1.016 1.017 1.022 1.023 1.023 1.025
Effectiveness (+Flow,-MB, +FM) α0 = 1 2 4 8 16 (-Flow, -MB, +FM)
Avg. 2 786 2 748 2 721 2 718 2 730 2 831
Best. 2 759 2 724 2 698 2 690 2 697 2 801
Bal. 1.024 1.024 1.025 1.025 1.025 1.025
Effectiveness (+Flow,+MB,+FM) α0 = 1 2 4 8 16 (-Flow, -MB, +FM)
Avg. 2 781 2 735 2 702 2 699 2 711 2 827
Best. 2 754 2 711 2 682 2 675 2 682 2 799
Bal. 1.023 1.021 1.022 1.023 1.022 1.025
Table 7. Each table is the result of an effectiveness test for six different algorithm configurations. All values are average values as described in Section 6.
Algorithm 2 F-cycle 3 V-cycle 2 W-cycle 1 W-cycle 1 F-cycle 2 V-cycle 1 V-cycle
Avg. 2 895 2 895 2 889 2 934 2 941 2 918 2 973
Best. 2 773 2 776 2 765 2 810 2 813 2 796 2 841
Bal. 1.023 1.023 1.024 1.024 1.024 1.024 1.024
t Eff. Avg. Eff. Best. 2.31 2 806 2 760 2.49 2 810 2 766 2.77 2 810 2 760 1.38 2 815 2 773 1.18 2 816 2 783 1.67 2 817 2 778 0.85 2 834 2 801
Table 8. Test results for normal and effectiveness tests for different global search strategies and different parameters.
k 2 4 8 16 32 64 Avg.
Avg. 561 1 286 2 314 3 833 6 070 9 606 2 683
Strong Best. t 548 2.85 1 242 5.13 2 244 7.52 3 746 11.26 5 936 16.36 9 466 25.09 2 617 8.93
Avg. 561 1 287 2 314 3 829 6 064 9 597 2 682
Effectiveness k 2 4 8 16 32 64 Avg.
-Kway Best. t 548 2.87 1 236 5.28 2 241 7.82 3 735 11.73 5 949 17.12 9 449 26.09 2 614 9.23
Strong Avg. Best. 550 547 1 251 1 240 2 263 2 242 3 773 3 745 6 000 5 943 9 523 9 463 2 636 2 616
-Multitry Avg. Best. t 564 549 2.68 1 299 1 244 4.26 2 345 2 273 5.34 3 907 3 813 6.40 6 220 6 087 7.72 9 898 9 742 9.69 2 729 2 656 5.55
-Kway Avg. Best. 550 548 1 251 1 243 2 270 2 249 3 769 3 742 6 001 5 947 9 502 9 437 2 636 2 618
Avg. 568 1 305 2 356 3 937 6 269 9 982 2 748
-Multitry Avg. Best. 550 548 1 257 1 246 2 280 2 267 3 830 3 795 6 116 6 078 9 745 9 702 2 668 2 650
-Cyc Best. 549 1 248 2 279 3 829 6 138 9 823 2 668
t 1.42 2.40 3.11 3.79 4.77 6.35 3.27
-Cyc Avg. Best. 549 548 1 255 1 245 2 277 2 263 3 828 3 799 6 139 6 099 9 811 9 754 2 669 2 653
Avg. 575 1 317 2 375 3 970 6 323 10 066 2 773
-MB Best. 551 1 254 2 295 3 867 6 177 9 910 2 686
-MB Avg. Best. 552 549 1 263 1 252 2 289 2 273 3 846 3 813 6 170 6 128 9 881 9 829 2 684 2 666
t 1.33 2.18 2.70 3.32 4.20 5.71 2.92
Avg. 627 1 413 2 533 4 180 6 573 10 359 2 934
-Flow Best. 582 1 342 2 441 4 051 6 427 10 199 2 823
-Flow Avg. Best. 581 573 1 316 1 299 2 408 2 387 4 029 3 996 6 403 6 369 10 139 10 085 2 799 2 775
Table 9. Removal tests: each configuration is same as left neighbor minus the component shown at the top of the column. The first table shows detailed results for all k in a normal test. The second table shows the results for an effectivity test.
t 0.85 1.02 1.32 1.80 2.60 3.94 1.66
k 2 4 8 16 32 64 Avg.
Avg. 561 1 286 2 314 3 833 6 070 9 606 2 683
Strong Best. t 548 2.85 1 242 5.13 2 244 7.52 3 746 11.26 5 936 16.36 9 466 25.09 2 617 8.93
Avg. 0.00 0.08 0.00 −0.10 −0.10 −0.09 −0.04
Effectiveness k 2 4 8 16 32 64 Avg.
-Kway Best. 0.00 −0.48 −0.13 −0.29 0.22 −0.18 −0.11
t 2.87 5.28 7.82 11.73 17.12 26.09 9.23
-Multitry Avg. Best. t 0.53 0.18 2.68 1.01 0.16 4.26 1.34 1.29 5.34 1.93 1.79 6.40 2.47 2.54 7.72 3.04 2.92 9.69 1.71 1.49 5.55
Avg. 1.25 1.48 1.82 2.71 3.28 3.91 2.42
-Cyc Best. 0.18 0.48 1.56 2.22 3.40 3.77 1.95
t 1.42 2.40 3.11 3.79 4.77 6.35 3.27
Avg. 2.50 2.41 2.64 3.57 4.17 4.79 3.35
-MB Best. 0.55 0.97 2.27 3.23 4.06 4.69 2.64
t 1.33 2.18 2.70 3.32 4.20 5.71 2.92
-Flow Avg. Best. 11.76 6.20 9.88 8.05 9.46 8.78 9.05 8.14 8.29 8.27 7.84 7.74 9.36 7.87
t 0.85 1.02 1.32 1.80 2.60 3.94 1.66
Strong -Kway -Multitry -Cyc -MB -Flow Avg. Best. Avg. Best. Avg. Best. Avg. Best. Avg. Best. Avg. Best. 550 547 0.00 0.18 0.00 0.18 −0.18 0.18 0.36 0.37 5.64 4.75 1 251 1 240 0.00 0.24 0.48 0.48 0.32 0.40 0.96 0.97 5.20 4.76 2 263 2 242 0.31 0.31 0.75 1.12 0.62 0.94 1.15 1.38 6.41 6.47 3 773 3 745 −0.11 −0.08 1.51 1.34 1.46 1.44 1.93 1.82 6.79 6.70 6 000 5 943 0.02 0.07 1.93 2.27 2.32 2.62 2.83 3.11 6.72 7.17 9 523 9 463 −0.22 −0.27 2.33 2.53 3.02 3.08 3.76 3.87 6.47 6.57 2 636 2 616 0.00 0.08 1.21 1.30 1.25 1.41 1.82 1.91 6.18 6.08
Table 10. Removal tests: each configuration is same as its left neighbor minus the component shown at the top of the column. The first table shows detailed results for all k in a normal test. The second table shows the results for an effectivity test. All values are increases in cut are relative to the values obtained by KaFFPa Strong. k 2 4 8 16 32 64 Avg.
Avg. 561 1 286 2 314 3 833 6 070 9 606 2 683
Strong Best. t 548 2.85 1 242 5.14 2 244 7.52 3 746 11.19 5 936 16.38 9 466 25.08 2 617 8.93
Effectiveness k 2 4 8 16 32 64 Avg.
Avg. 561 1 287 2 314 3 829 6 064 9 597 2 682
-Kway Best. t 548 2.86 1 236 5.29 2 241 7.81 3 735 11.69 5 949 17.15 9 449 26.02 2 614 9.23
Strong Avg. Best. 550 547 1 251 1 240 2 263 2 242 3 771 3 742 6 000 5 943 9 523 9 463 2 636 2 616
-Multitry Avg. Best. t 561 548 2.72 1 293 1 240 4.23 2 337 2 271 5.24 3 894 3 799 6.27 6 189 6 055 7.67 9 834 9 680 9.78 2 717 2 646 5.52
-Kway Avg. Best. 550 548 1 251 1 243 2 270 2 249 3 767 3 741 6 002 5 950 9 502 9 437 2 636 2 618
-Multitry Avg. Best. 550 548 1 254 1 243 2 276 2 262 3 810 3 781 6 090 6 055 9 681 9 636 2 658 2 642
Avg. 564 1 290 2 322 3 838 6 082 9 617 2 690
-MB Best. 548 1 239 2 249 3 747 5 948 9 478 2 619
-MB Avg. Best. 550 548 1 251 1 241 2 270 2 246 3 773 3 747 6 006 5 955 9 525 9 470 2 639 2 619
t 2.70 4.68 6.88 10.41 15.42 24.02 8.34
Avg. 582 1 312 2 347 3 870 6 110 9 646 2 724
-Flows Best. t 559 1.94 1 252 2.95 2 270 4.88 3 779 8.22 5 977 13.17 9 509 21.19 2 643 6.33
-Flows Avg. Best. 560 556 1 266 1 252 2 281 2 259 3 797 3 767 6 028 5 977 9 548 9 494 2 659 2 637
Table 11. Knockout tests: each configuration is the same as KaFFPa Strong minus the component shown at the top of the column. The first table shows detailed results for all k in a normal test. The second table shows the results for an effectivity test.
k 2 4 8 16 32 64 Avg.
Avg. 561 1 286 2 314 3 833 6 070 9 606 2 683
Strong Best. t 548 2.85 1 242 5.14 2 244 7.52 3 746 11.19 5 936 16.38 9 466 25.08 2 617 8.93
Effectiveness k 2 4 8 16 32 64 Avg.
Avg. 0.00 0.08 0.00 −0.10 −0.10 −0.09 −0.04
-Kway Best. 0.00 −0.48 −0.13 −0.29 0.22 −0.18 −0.11
t 2.86 5.29 7.81 11.69 17.15 26.02 9.23
-Multitry Avg. Best. t 0.00 0.00 2.72 0.54 −0.16 4.23 0.99 1.20 5.24 1.59 1.41 6.27 1.96 2.00 7.67 2.37 2.26 9.78 1.27 1.11 5.52
Strong -Kway -Multitry Avg. Best. Avg. Best. Avg. Best. 550 547 0.00 0.18 0.00 0.18 1 251 1 240 0.00 0.24 0.24 0.24 2 263 2 242 0.31 0.31 0.57 0.89 3 771 3 742 −0.11 −0.03 1.03 1.04 6 000 5 943 0.03 0.12 1.50 1.88 9 523 9 463 −0.22 −0.27 1.66 1.83 2 636 2 616 0.00 0.08 0.83 0.99
-MB -Flows Avg. Best. t Avg. Best. t 0.53 0.00 2.70 3.74 2.01 1.94 0.31 −0.24 4.68 2.02 0.81 2.95 0.35 0.22 6.88 1.43 1.16 4.88 0.13 0.03 10.41 0.97 0.88 8.22 0.20 0.20 15.42 0.66 0.69 13.17 0.11 0.13 24.02 0.42 0.45 21.19 0.26 0.08 8.34 1.53 0.99 6.33 -MB Avg. Best. 0.00 0.18 0.00 0.08 0.31 0.18 0.05 0.13 0.10 0.20 0.02 0.07 0.11 0.11
-Flows Avg. Best. 1.82 1.65 1.20 0.97 0.80 0.76 0.69 0.67 0.47 0.57 0.26 0.33 0.87 0.80
Table 12. Knockout tests: each configuration is the same as KaFFPa Strong minus the component shown at the top of the column. The first table shows detailed results for all k in a normal test. The second table shows the results for an effectivity test. All values are increases in cut relative to the values obtained by KaFFPa Strong.
graph fe_tooth fe_tooth fe_tooth fe_tooth fe_tooth fe_tooth 598a 598a 598a 598a 598a 598a fe_ocean fe_ocean fe_ocean fe_ocean fe_ocean fe_ocean 144 144 144 144 144 144 wave wave wave wave wave wave m14b m14b m14b m14b m14b m14b auto auto auto auto auto auto delaunay_n20 delaunay_n20 delaunay_n20 delaunay_n20 delaunay_n20 delaunay_n20 rgg_n_2_20_s0 rgg_n_2_20_s0 rgg_n_2_20_s0 rgg_n_2_20_s0 rgg_n_2_20_s0 rgg_n_2_20_s0 af_shell10 af_shell10 af_shell10 af_shell10 af_shell10 af_shell10 deu deu deu deu deu deu eur eur eur eur eur eur
k 2 4 8 16 32 64 2 4 8 16 32 64 2 4 8 16 32 64 2 4 8 16 32 64 2 4 8 16 32 64 2 4 8 16 32 64 2 4 8 16 32 64 2 4 8 16 32 64 2 4 8 16 32 64 2 4 8 16 32 64 2 4 8 16 32 64 2 4 8 16 32 64
KaFFPa Strong Best Avg. t 3 789 3 829 5.43 6 812 6 946 12.62 11 595 11 667 18.22 17 907 18 056 27.53 25 585 25 738 41.42 35 497 35 597 57.23 2 367 2 372 7.73 7 896 7 993 13.29 15 830 16 182 25.60 26 211 26 729 41.81 39 863 39 976 68.82 57 325 57 860 107.20 311 311 5.27 1 789 1 789 9.36 4 012 4 087 13.58 7 966 8 087 21.14 12 660 12 863 31.73 20 606 20 739 66.39 6 451 6 482 16.12 15 485 15 832 34.62 25 282 25 626 53.65 38 483 38 669 85.52 56 672 56 827 121.75 78 828 79 477 147.98 8 665 8 681 14.23 16 804 16 908 38.36 28 882 29 339 62.99 42 292 43 538 97.53 62 566 62 647 124.43 84 970 85 649 195.61 3 823 3 823 19.82 12 953 13 031 38.87 26 006 26 179 65.15 43 176 43 759 91.08 67 417 67 512 142.37 98 222 98 536 189.96 9 725 9 775 74.25 25 841 25 891 151.14 44 847 45 299 257.71 75 792 77 429 317.81 121 016 121 687 366.47 173 155 173 624 490.74 1 680 1 687 57.94 3 368 3 380 124.29 6 247 6 283 154.95 10 012 10 056 210.39 15 744 15 804 220.40 23 472 23 551 237.76 2 088 2 119 94.68 4 184 4 241 167.88 7 684 7 729 192.45 12 504 12 673 205.29 20 078 20 400 207.80 30 518 30 893 230.28 26 225 26 225 367.08 53 450 53 825 1 326.09 94 350 96 667 1 590.61 152 050 155 092 2 154.59 238 575 242 992 1 803.05 356 975 360 867 1 945.30 163 166 197.17 395 403 314.83 726 729 350.84 1 263 1 278 423.09 2 115 2 146 460.84 3 432 3 440 512.77 130 130 1 013.00 412 430 1 823.90 749 772 2 067.02 1 454 1 493 2 340.64 2 428 2 504 2 445.72 4 240 4 264 2 533.56
KaFFPa Eco Best Avg. t 4 159 4 594 0.13 7 378 7 438 0.38 11 995 12 670 0.58 18 812 19 182 0.81 26 945 27 320 1.27 37 353 37 864 1.80 2 388 2 388 0.37 8 141 8 190 0.59 16 565 16 764 0.89 27 639 27 941 1.48 41 553 42 012 2.20 60 519 60 838 3.14 311 311 0.20 1 801 1 809 0.34 4 675 4 826 0.43 8 794 8 991 0.71 14 487 14 898 1.25 22 241 22 590 2.01 6 616 6 625 0.52 16 238 16 334 0.92 26 606 26 934 1.40 40 312 40 992 2.10 59 423 59 866 2.90 83 510 84 464 3.85 9 017 9 100 0.39 18 464 18 834 0.84 30 753 31 248 1.51 45 605 46 647 2.10 65 301 65 871 3.06 89 886 90 743 4.03 3 826 3 826 0.90 13 368 13 401 1.34 26 958 27 230 2.07 45 143 46 377 3.04 70 875 71 369 4.29 103 705 104 460 5.48 9 739 9 837 2.30 26 594 26 858 3.25 46 263 48 104 5.47 79 129 80 116 7.31 126 261 127 037 9.86 181 173 182 964 11.87 1 725 1 744 2.55 3 393 3 414 4.19 6 328 6 404 5.11 10 291 10 375 5.37 16 306 16 502 6.85 24 383 24 547 7.86 2 177 2 177 3.96 4 308 4 313 7.34 8 123 8 324 7.63 13 281 13 675 8.16 21 311 21 897 8.83 33 166 33 603 9.85 28 700 28 700 12.53 54 500 55 165 22.35 111 975 112 650 24.81 162 250 164 383 22.85 259 450 260 911 24.48 382 321 385 210 25.08 181 185 10.22 407 438 14.84 781 809 17.18 1 376 1 418 17.34 2 230 2 338 20.57 3 724 3 800 24.91 214 246 61.35 468 496 102.19 831 875 108.79 1 595 1 646 112.81 2 747 2 777 120.06 4 733 4 830 143.04
KaFFPa Fast Best Avg. t 4 308 4 491 0.12 8 047 8 773 0.13 12 909 13 367 0.17 19 753 20 387 0.21 28 471 29 108 0.28 39 547 39 843 0.41 2 546 2 547 0.22 8 415 8 700 0.25 18 361 20 561 0.30 28 955 29 571 0.41 43 746 44 365 0.55 62 993 63 677 0.75 372 376 0.10 1 938 2 085 0.11 5 976 6 299 0.13 10 047 10 299 0.20 16 266 16 590 0.28 24 421 24 728 0.42 6 803 6 911 0.28 16 557 17 363 0.32 29 298 30 489 0.38 42 762 43 415 0.52 62 353 63 039 0.66 87 268 88 082 0.87 9 778 10 847 0.26 17 927 22 697 0.30 33 268 36 900 0.37 47 632 48 176 0.49 67 029 68 692 0.63 93 700 94 326 0.84 4 136 4 151 0.46 14 096 14 196 0.51 28 388 29 438 0.59 48 678 49 529 0.78 72 729 74 109 1.00 108 504 109 706 1.30 10 282 10 517 1.03 38 710 42 402 1.10 51 725 55 373 1.20 83 190 86 195 1.63 131 608 133 300 2.05 187 766 189 928 2.61 2 021 2 051 1.09 3 931 3 996 1.11 7 681 7 877 1.13 11 756 12 011 1.18 18 802 19 251 1.27 27 615 27 828 1.40 2 824 2 944 1.15 5 713 5 847 1.17 10 524 11 139 1.20 17 378 17 997 1.30 27 936 28 428 1.42 41 537 42 137 1.58 29 900 30 260 2.51 57 150 58 290 2.54 116 875 117 894 2.59 180 100 182 705 2.71 288 900 291 758 2.83 406 925 410 505 2.99 237 257 4.87 597 651 4.92 1 087 1 143 4.93 1 808 1 857 4.96 2 951 3 076 5.02 4 659 4 770 5.15 423 434 22.33 632 815 22.44 1 280 1 334 22.48 2 145 2 408 22.55 3 865 3 918 22.65 6 431 6 534 22.80
KaSPar Strong Best Avg. t 3 844 3 987 5.86 6 937 6 999 8.54 11 482 11 564 13.43 17 744 17 966 21.24 25 888 26 248 35.12 36 259 36 469 49.65 2 371 2 384 6.50 7 897 7 921 11.15 15 929 15 984 22.31 26 046 26 270 38.39 39 625 40 019 60.60 58 362 58 945 87.52 317 317 5.55 1 801 1 810 9.40 4 044 4 097 14.33 7 992 8 145 22.41 13 320 13 518 36.53 21 326 21 739 62.46 6 455 6 507 12.81 15 312 15 471 24.73 25 130 25 409 38.13 37 872 38 404 69.35 57 082 57 492 106.40 80 313 80 770 144.77 8 661 8 720 16.19 16 806 16 920 29.56 28 681 28 817 46.61 42 918 43 208 75.97 63 025 63 159 112.19 87 243 87 554 150.37 3 828 3 846 20.03 13 015 13 079 26.51 25 573 25 756 45.33 42 212 42 458 83.25 66 314 66 991 133.88 99 207 100 014 198.23 9 740 9 768 68.39 25 988 26 062 75.60 45 099 45 232 97.60 76 287 76 715 153.46 121 269 121 862 246.50 174 612 174 914 352.09 1 711 1 731 196.33 3 418 3 439 130.67 6 278 6 317 104.37 10 183 10 218 84.33 15 905 16 026 101.69 23 935 23 962 97.09 2 162 2 201 198.61 4 323 4 389 130.00 7 745 7 915 103.66 12 596 12 792 86.19 20 403 20 478 100.03 30 860 31 066 97.83 26 225 26 225 317.11 55 075 55 345 210.61 97 709 100 233 179.51 163 125 165 770 212.12 248 268 252 939 191.53 372 823 376 512 207.76 167 172 231.47 419 426 244.12 762 773 250.50 1 308 1 333 278.31 2 182 2 217 283.79 3 610 3 631 293.53 133 138 1 946.34 355 375 2 168.10 774 786 2 232.31 1 401 1 440 2 553.40 2 595 2 643 2 598.84 4 502 4 526 2 533.56
KaPPa Strong Best Avg. t 3 951 4 336 3.75 7 012 7 189 5.22 12 272 12 721 6.83 18 302 18 570 7.18 26 397 26 617 5.28 36 862 37 002 4.71 2 387 2 393 5.64 8 235 8 291 10.24 16 502 16 641 12.21 26 467 26 825 17.74 40 946 41 190 18.16 59 148 59 387 14.15 314 317 3.21 1 756 1 822 6.30 4 104 4 252 6.33 8 188 8 350 5.62 13 593 13 815 4.34 21 636 21 859 3.68 6 559 6 623 7.45 16 870 16 963 13.33 26 300 26 457 20.11 39 010 39 319 26.04 58 331 58 631 24.60 82 286 82 452 19.11 8 832 9 132 8.24 17 008 17 250 14.51 30 690 31 419 20.63 44 831 45 048 20.54 63 981 64 390 14.94 88 376 88 964 12.51 3 862 3 954 11.16 13 543 13 810 18.77 27 330 27 393 24.97 45 352 45 762 28.11 68 107 69 075 29.94 101 053 101 455 25.26 9 910 10 045 30.09 28 218 29 481 64.01 46 272 46 652 85.89 78 713 79 769 87.41 124 606 125 500 71.77 177 038 177 595 62.64 1 858 1 882 35.43 3 674 3 780 64.08 6 670 6 854 70.07 10 816 11 008 67.92 16 813 17 086 42.67 24 799 25 179 22.04 2 377 2 498 33.24 4 867 5 058 38.50 8 995 9 391 46.06 14 953 15 199 35.86 23 430 23 917 26.04 34 778 35 354 11.62 26 225 26 225 78.65 54 950 55 265 91.96 101 425 102 335 136.99 165 025 166 427 106.63 253 525 255 535 80.85 379 125 382 923 43.01 214 221 68.20 533 542 76.87 922 962 99.76 1 550 1 616 105.96 2 548 2 615 73.17 4 021 4 093 49.55 543 986 1 760 3 186 5 290
619 1 034 1 900 3 291 5 393
441.11 418.29 497.93 417.52 308.17
DiBaP Best Avg. t Best 4 390 4 785 0.99 3 945 7 492 8 081 1.11 7 464 12 186 12 532 1.79 12 638 19 389 19 615 2.86 19 179 26 518 27 073 5.06 27 852 37 271 37 458 8.78 39 013 2 414 2 435 1.90 2 409 8 200 8 200 2.40 8 214 16 585 16 663 3.59 16 949 26 693 27 131 6.14 28 932 40 908 41 456 10.97 43 960 58 978 59 371 18.50 64 071 348 1 067 0.62 398 1 994 1 994 0.70 1 964 5 208 5 305 1.24 4 448 9 356 9 501 1.97 9 025 15 893 16 230 3.09 14 971 24 692 24 894 6.02 22 270 7 146 7 146 2.38 6 702 16 169 16 550 3.17 16 843 26 121 26 871 4.54 28 674 39 618 40 066 7.77 42 591 57 683 58 592 13.03 62 627 81 997 82 216 23.23 87 475 8 994 10 744 2.03 9 037 17 382 17 608 2.53 19 454 29 893 32 246 3.74 32 592 45 227 45 596 6.33 48 233 63 594 64 464 10.51 69 458 87 741 88 487 18.61 95 627 3 898 3 941 3.53 3 861 13 494 13 519 4.73 13 408 26 743 26 916 7.10 27 664 44 666 45 515 12.76 49 015 67 888 68 957 22.30 73 291 99 994 100 653 37.38 109 021 10 094 11 494 6.95 10 243 26 523 27 958 9.93 28 269 48 326 48 346 14.24 49 596 80 198 81 742 24.60 83 506 124 443 125 043 40.77 131 481 175 091 175 758 66.23 190 464 1 994 2 265 2.91 1 859 3 804 3 804 3.05 3 688 6 923 7 102 5.02 7 174 11 174 11 382 8.01 11 107 17 343 17 408 13.60 17 818 25 884 26 148 23.94 25 982 2 596 5 580 10 812 16 311 26 262 38 401 26 225 26 225 3.74 26 225 56 075 56 075 4.93 56 075 107 125 108 400 7.53 107 025 168 450 171 940 11.98 168 850 255 850 258 795 19.74 268 000 382 675 387 624 34.20 395 900 265 608 1 109 1 957 3 158 4 799 369 727 1 338 2 478 4 057 6 518
Table 13. Detailed per instance basis results for the large testset.
Scotch Avg. 4 312 7 770 12 953 19 761 28 680 39 208 2 414 8 256 17 203 29 415 44 232 64 380 400 2 026 4 596 9 180 15 239 22 887 7 046 17 315 29 257 43 291 63 215 88 341 9 144 19 945 33 285 49 139 70 261 95 983 3 910 13 528 27 786 49 968 74 200 109 844 11 525 28 695 50 080 84 254 132 960 192 242 1 873 3 753 7 319 11 187 17 949 26 113 2 728 5 712 11 164 16 687 26 666 38 958 28 980 57 305 109 685 170 160 270 945 397 565 279 648 1 211 2 061 3 262 4 937 448 851 1 461 2 563 4 249 6 739
t 0.36 0.66 1.04 1.52 2.03 2.60 0.38 0.92 1.54 2.28 3.08 4.00 0.18 0.41 0.77 1.25 1.78 2.40 0.63 1.41 2.16 3.01 3.99 5.16 0.79 1.69 2.54 3.50 4.54 5.87 0.67 1.59 2.67 4.03 5.48 7.21 1.53 3.28 5.08 7.35 10.11 13.27 1.11 2.17 3.29 4.30 5.49 6.86 1.29 2.63 4.10 5.54 7.17 8.98 3.43 7.05 11.01 15.23 20.13 25.24 2.96 6.03 9.07 12.05 15.12 18.24 11.86 23.86 35.99 48.30 60.29 73.94
Best 4 319 7 853 12 976 20 145 28 699 39 164 2 485 8 351 17 501 29 377 42 986 62 293 523 2 126 5 369 9 886 15 456 24 448 6 753 17 119 27 892 42 643 62 345 85 861 9 136 20 652 33 174 47 686 68 645 93 232 3 981 13 881 28 009 47 828 73 500 105 591 10 611 29 131 50 188 83 717 134 554 188 572 2 042 3 970 7 804 12 320 18 860 27 849 2 941 5 870 10 411 17 773 27 392 42 274 27 575 60 750 115 475 185 325 286 600 423 432 271 592 1 209 2 052 3 225 4 985 412 902 2 473 3 314 5 811 10 264
Metis Avg. 4 695 8 155 13 728 20 196 28 909 39 403 2 530 8 737 18 019 30 149 43 910 62 687 524 2 183 5 502 10 015 15 908 24 737 6 837 17 636 28 475 43 399 62 792 86 426 9 499 22 060 34 384 48 594 69 469 93 592 4 220 14 070 29 373 49 342 74 476 107 296 10 744 30 828 52 740 87 104 135 459 189 695 2 105 4 121 7 929 12 471 19 304 28 419 3 112 5 980 12 002 18 221 28 328 42 666 30 230 61 975 118 725 188 795 288 250 428 881 296 710 1 600 2 191 3 607 5 320 454 1 698 3 819 8 554 7 380 13 947
t 0.09 0.10 0.10 0.11 0.12 0.13 0.17 0.18 0.19 0.20 0.22 0.24 0.13 0.13 0.14 0.15 0.17 0.19 0.25 0.26 0.27 0.28 0.30 0.34 0.23 0.25 0.27 0.27 0.29 0.33 0.39 0.40 0.42 0.43 0.46 0.50 1.01 1.02 1.05 1.08 1.14 1.23 1.31 1.32 1.33 1.33 1.38 1.38 1.81 1.82 1.80 1.80 1.81 1.86 3.72 3.76 3.73 3.75 3.78 3.83 6.18 6.07 6.02 5.93 5.92 5.96 33.00 32.46 33.01 33.85 32.84 32.86
k 2 4 8 16 32 64 Avg.
KaFFPa Strong Best. Avg. t 3 988 4 001 22.68 10 467 10 559 50.18 19 288 19 553 76.39 31 474 31 953 111.49 48 195 48 506 145.04 69 936 70 363 199.84 20 986 21 172 80.93
KaFFPa Eco Best. Avg. t 4 117 4 178 0.79 10 878 10 969 1.42 20 612 21 061 2.06 33 284 33 858 2.82 51 117 51 686 3.94 73 946 74 661 5.09 22 088 22 393 2.25
2 4 8 16 32 64 Avg.
KaPPa Strong Best. Avg. t 4 089 4 180 11.63 10 940 11 168 19.76 20 255 20 609 25.46 32 821 33 219 26.66 50 085 50 573 21.84 72 837 73 316 16.44 21 839 22 163 19.56
Best. 4 285 11 133 20 980 33 859 51 088 74 144 22 460
k 2 4 8 16 32 64 Avg.
KaFFPa Strong Best. Avg. t 2 812 2 828 31.44 5 636 5 709 87.25 10 369 10 511 123.31 17 254 17 525 168.96 26 917 27 185 208.25 40 193 40 444 270.30 12 054 12 182 121.50
KaFFPa Eco Best. Avg. t 2 925 2 966 1.16 5 891 5 996 2.83 11 111 11 398 3.82 18 354 18 731 4.84 28 690 29 136 6.41 42 880 43 385 8.10 12 763 12 988 3.82
2 4 8 16 32 64 Avg.
KaPPa Strong DiBaP Best. Avg. t Best. Avg. 2 977 3 054 15.03 6 190 6 384 30.31 11 375 11 652 37.86 18 678 19 061 39.13 29 156 29 562 31.35 43 237 43 237 22.36 13 323 13 600 28.16 -
DiBaP Avg. 5 155 11 341 21 451 34 389 51 773 74 676 23 461
t 2.25 2.79 4.31 7.19 12.14 21.17 6.07
t -
KaFFPa Fast Best. Avg. t 4 573 4 459 0.40 11 897 12 732 0.43 23 026 24 295 0.50 35 952 36 730 0.64 54 725 55 685 0.80 78 553 79 305 1.03 23 952 24 742 0.60
KaSPar Strong Best. Avg. t 4 013 4 047 24.94 10 548 10 610 32.09 19 332 19 507 44.11 31 676 32 000 65.43 48 770 49 254 94.42 71 506 72 024 126.59 21 185 21 364 54.97
Scotch Best. Avg. 4 238 4 430 11 336 11 581 21 391 21 805 35 007 35 562 53 628 54 323 77 379 78 042 23 033 23 505
Best. 4 543 11 906 22 416 36 275 54 669 78 415 23 945
t 0.71 1.53 2.46 3.54 4.75 6.14 2.56
Metis Avg. 4 722 12 355 23 195 37 006 55 437 79 200 24 568
t 0.39 0.40 0.42 0.43 0.46 0.50 0.44
KaFFPa Fast Best. Avg. t 3 276 3 382 0.55 6 829 7 408 0.80 13 149 13 856 0.89 20 854 21 508 1.08 32 527 33 155 1.29 47 785 48 344 1.58 14 562 15 124 0.98
KaSPar Strong Best. Avg. t 2 842 2 873 36.89 5 642 5 707 60.66 10 464 10 580 75.92 17 345 17 567 102.52 27 416 27 707 137.08 41 286 41 570 170.54 12 450 12 584 87.12
Scotch Best. Avg. 3 151 3 298 6 661 6 909 12 535 12 939 20 716 21 153 32 183 32 751 47 109 47 714 14 218 14 615
Best. 3 379 7 049 13 719 22 041 33 820 49 972 15 167
t 0.85 2.26 3.58 5.06 6.69 8.55 3.55
Metis Avg. 3 535 7 770 15 118 24 396 35 289 51 970 16 275
t 0.58 0.83 0.85 0.88 0.92 0.98 0.83
Table 14. Results for our large benchmark suite. The table on top contains average values for the comparison with DiBaP on our large testsuite without road networks and rgg. The table on the bottom contains average value for the comparisons with other general purpose partitioners on our large testsuite without the road network Europe for the case k = 2. The average values are computed as described in Section 6.
1.4 1.3 1.2
+ +
+ +
+
+
+
+
+
216
217
218
219
+
1.1
+
1.0
+
+
+ +
+ +
+ +
+ +
+ +
+ +
+
+
+
+
+
220
221
222
223
224
225
+
+ +
0.9
Average improvement relative to Kmetis
Delaunay Graphs KaFFPa−Fast KaFFPa−Eco KaFFPa−Strong
215
|V|
1.5 1.0
+
+
+
+
+
+
+
+
0.5
+
0.0
Average speedup relative to Kmetis
Delaunay Graphs KaFFPa−Fast KaFFPa−Eco KaFFPa−Strong
+ + +
+
+
+
+
+
+
+
+
+
+
+
+
+
+
+
+
+ +
216
217
218
219
220
221
222
223
224
225
+
+
+ 215
|V|
Fig. 12. Graph sequence test for Delaunay Graphs.
Graph/k 2 4 8 16 32 64 3elt 89 89 199 199 342 342 571 569 987 969 1 595 1 564 add20 678 594 1 197 1 177 1 740 1 704 2 156 2 121 2 565 2 687 3 071 3 236 data 188 188 378 383 659 660 1 170 1 162 2 002 1 865 2 954 2 885 uk 19 19 40 41 82 84 150 152 260 258 431 438 add32 10 10 30 33 66 66 117 117 212 212 498 493 bcsstk33 10 097 10 097 21 556 21 508 34 183 34 178 55 447 54 860 79 324 78 132 110 656 108 505 whitaker3 126 126 380 380 655 656 1 105 1 093 1 700 1 717 2 588 2 567 crack 183 183 362 362 677 678 1 109 1 092 1 720 1 707 2 620 2 566 wing_nodal 1 695 1 696 3 576 3 572 5 445 5 443 8 417 8 422 12 129 11 980 16 332 16 134 fe_4elt2 130 130 349 349 605 605 1 006 1 014 1 647 1 657 2 575 2 537 vibrobox 11 538 10 310 19 155 19 199 24 702 24 553 34 384 32 167 42 711 41 399 49 924 49 521 bcsstk29 2 818 2 818 8 070 8 035 14 291 13 965 23 280 21 768 36 125 34 886 58 613 57 054 4elt 138 138 320 321 534 534 938 939 1 576 1 559 2 623 2 596 fe_sphere 386 386 766 768 1 152 1 152 1 710 1 730 2 520 2 565 3 670 3 663 cti 318 318 944 944 1 752 1 802 2 865 2 906 4 180 4 223 6 016 5 875 memplus 5 596 5 489 9 805 9 559 12 126 11 785 13 564 13 241 15 232 14 395 17 595 16 857 cs4 366 367 938 940 1 455 1 467 2 124 2 195 2 990 3 048 4 141 4 154 bcsstk31 2 699 2 701 7 296 7 444 13 274 13 371 24 546 24 277 38 860 38 086 60 612 60 528 fe_pwt 340 340 704 704 1 437 1 441 2 799 2 806 5 552 5 612 8 314 8 454 bcsstk32 4 667 4 667 9 208 9 247 21 253 20 855 36 968 37 372 62 994 61 144 97 299 95 199 fe_body 262 262 598 599 1 040 1 079 1 806 1 858 2 968 3 202 5 057 5 282 t60k 75 75 208 211 454 465 818 849 1 361 1 391 2 143 2 211 wing 784 787 1 616 1 666 2 509 2 589 3 889 4 131 5 747 5 902 7 842 8 132 brack2 708 708 3 013 3 027 7 110 7 144 11 745 11 969 17 751 17 798 26 766 26 557 finan512 162 162 324 324 648 648 1 296 1 296 2 592 2 592 10 752 10 560 fe_tooth 3 815 3 819 6 870 6 938 11 492 11 650 17 592 18 115 25 695 25 977 35 722 35 980 fe_rotor 2 031 2 045 7 538 7 405 13 032 12 959 20 888 20 773 32 678 32 783 47 980 47 461 598a 2 388 2 388 7 956 7 992 16 050 16 179 25 892 26 196 40 003 40 513 57 795 59 098 fe_ocean 387 387 1 831 1 856 4 140 4 251 8 035 8 276 13 224 13 660 20 828 21 548 144 6 478 6 479 15 635 15 196 25 281 25 455 38 221 38 940 56 897 58 126 80 451 81 145 wave 8 665 8 682 16 881 16 891 29 124 29 207 43 027 43 697 62 567 64 198 86 127 88 863 m14b 3 826 3 826 12 981 13 034 25 854 25 921 42 358 42 513 67 454 67 770 99 661 101 551 auto 9 958 10 004 26 669 26 941 45 892 45 731 77 163 77 618 121 645 123 296 174 527 175 975 Table 15. Computing partitions from scratch � = 1%. In each k-column the results computed by KaFFPa are on the left and the current Walshaw cuts are presented on the right side.
Graph/k 2 4 8 16 32 64 3elt 87 87 198 198 335 336 563 565 962 958 1 558 1 542 add20 702 576 1 186 1 158 1 724 1 690 2 104 2 095 2 490 2 493 3 035 3 152 data 185 185 369 378 640 650 1 127 1 133 1 846 1 802 2 922 2 809 uk 18 18 39 40 78 81 141 148 245 251 418 414 add32 10 10 30 33 66 66 117 117 212 212 496 493 bcsstk33 10 064 10 064 20 865 21 035 34 078 34 078 54 847 54 510 78 129 77 672 108 668 107 012 whitaker3 126 126 378 378 652 655 1 090 1 092 1 680 1 686 2 539 2 535 crack 182 182 360 360 673 676 1 086 1 082 1 692 1 679 2 561 2 553 wing_nodal 1 678 1 680 3 545 3 561 5 374 5 401 8 315 8 316 11 963 11 938 16 097 15 971 fe_4elt2 130 130 342 343 597 598 996 1 007 1 621 1 633 2 513 2 527 vibrobox 11 538 10 310 18 975 18 778 24 268 24 171 33 721 31 516 42 159 39 592 49 270 49 123 bcsstk29 2 818 2 818 7 993 7 983 13 867 13 817 22 494 21 410 34 892 34 407 56 682 55 366 4elt 137 137 319 319 523 523 918 914 1 539 1 537 2 570 2 581 fe_sphere 384 384 764 764 1 152 1 152 1 705 1 706 2 483 2 477 3 568 3 547 cti 318 318 916 917 1 714 1 716 2 773 2 778 4 029 4 132 5 683 5 763 memplus 5 466 5 355 9 593 9 418 12 085 11 628 13 384 13 130 15 124 14 264 17 183 16 724 cs4 360 361 928 936 1 439 1 467 2 090 2 126 2 935 3 014 4 080 4 107 bcsstk31 2 676 2 676 7 150 7 181 13 020 13 246 23 536 23 504 38 048 37 459 58 738 58 667 fe_pwt 340 340 700 704 1 411 1 416 2 776 2 784 5 496 5 606 8 228 8 346 bcsstk32 4 667 4 667 8 742 8 778 20 223 20 035 35 572 35 788 60 766 59 824 92 094 92 690 fe_body 262 262 598 598 1 016 1 033 1 734 1 767 2 810 2 906 4 799 4 982 t60k 71 71 203 207 449 454 805 822 1 343 1 391 2 115 2 198 wing 773 774 1 605 1 636 2 471 2 551 3 862 4 015 5 645 5 832 7 727 8 043 brack2 684 684 2 834 2 839 6 871 6 980 11 462 11 622 17 211 17 491 26 026 26 366 finan512 162 162 324 324 648 648 1 296 1 296 2 592 2 592 10 629 10 560 fe_tooth 3 788 3 792 6 796 6 862 11 313 11 422 17 318 17 655 25 208 25 624 35 044 35 830 fe_rotor 1 959 1 960 7 128 7 182 12 479 12 546 20 397 20 356 31 345 31 763 46 783 47 049 598a 2 367 2 367 7 842 7 873 15 740 15 820 25 704 25 927 38 803 39 525 57 070 58 101 fe_ocean 311 311 1 696 1 698 3 921 3 974 7 648 7 838 12 550 12 746 20 049 21 033 144 6 438 6 438 15 128 15 122 25 119 25 301 37 782 37 899 56 399 56 463 78 626 80 621 wave 8 594 8 616 16 668 16 822 28 513 28 664 42 308 42 620 61 756 62 281 85 254 86 663 m14b 3 823 3 823 12 948 12 977 25 522 25 550 42 015 42 061 66 401 65 879 96 881 100 064 auto 9 683 9 716 25 836 25 979 44 841 45 109 75 792 76 016 120 174 120 534 171 584 172 357 Table 16. Computing partitions from scratch � = 3%. In each k-column the results computed by KaFFPa are on the left and the current Walshaw cuts are presented on the right side.
Graphi/k 2 4 3elt 87 87 197 197 add20 691 550 1 171 1 157 data 182 181 363 368 uk 18 18 39 39 add32 10 10 30 33 bcsstk33 9 914 9 914 20 216 20 198 whitaker3 126 126 378 378 crack 182 182 360 360 wing_nodal 1 669 1 668 3 524 3 536 fe_4elt2 130 130 335 335 vibrobox 11 486 10 310 18 856 18 778 bcsstk29 2 818 2 818 7 942 7 936 4elt 137 137 315 315 fe_sphere 384 384 762 764 cti 318 318 889 890 memplus 5 362 5 267 9 690 9 299 cs4 353 356 922 936 bcsstk31 2 670 2 676 7 088 7 099 fe_pwt 340 340 700 700 bcsstk32 4 622 4 622 8 441 8 454 fe_body 262 262 589 596 t60k 65 65 195 196 wing 770 770 1 597 1 636 brack2 660 660 2 731 2 739 finan512 162 162 324 324 fe_tooth 3 773 3 773 6 718 6 825 fe_rotor 1 940 1 950 6 999 7 045 598a 2 336 2 336 7 738 7 763 fe_ocean 311 311 1 686 1 697 144 6 361 6 362 15 321 15 122 wave 8 535 8 563 16 543 16 662 m14b 3 802 3 802 12 945 12 976 auto 9 450 9 450 25 310 25 399
8 330 1 703 629 76 63 33 922 647 667 5 346 581 23 948 13 575 516 1 152 1 684 12 078 1 435 12 865 1 405 19 601 1 014 445 2 456 6 634 648 11 185 12 353 15 502 3 902 25 078 28 493 25 151 44 360
330 1 675 628 78 63 33 938 650 667 5 350 583 23 930 13 614 516 1 152 1 708 11 555 1 467 12 941 1 405 19 678 1 017 454 2 528 6 671 648 11 337 12 380 15 544 3 941 25 025 28 615 25 292 44 520
16 32 64 558 560 952 950 1 528 1 539 2 112 2 081 2 440 2 463 2 996 3 152 1 092 1 086 1 813 1 777 2 852 2 798 139 139 242 246 404 410 117 117 212 212 486 491 54 692 54 323 77 564 77 163 107 832 106 886 1 087 1 084 1 673 1 686 2 512 2 535 1 077 1 080 1 682 1 679 2 526 2 548 8 266 8 316 11 855 11 879 16 111 15 873 986 991 1 600 1 633 2 493 2 516 33 113 31 235 41 812 39 592 48 841 48 200 21 971 20 924 34 452 33 818 55 873 54 935 901 902 1 520 1 532 2 554 2 565 1 688 1 692 2 433 2 477 3 535 3 547 2 735 2 725 3 957 4 037 5 609 5 684 13 349 13 078 14 992 14 170 16 758 16 454 2 083 2 126 2 923 2 958 4 055 4 052 23 202 23 254 37 282 37 459 57 748 57 534 2 748 2 772 5 431 5 545 8 136 8 310 35 014 35 208 59 456 59 824 91 110 91 006 1 701 1 723 2 787 2 807 4 642 4 834 801 818 1 337 1 376 2 106 2 168 3 842 3 998 5 586 5 806 7 651 7 991 11 240 11 358 17 137 17 256 25 827 26 281 1 296 1 296 2 592 2 592 10 604 10 560 17 230 17 404 24 977 25 216 34 704 35 466 19 935 20 132 31 016 31 450 46 006 46 608 25 560 25 585 38 884 39 144 56 586 57 412 7 457 7 618 12 373 12 720 19 764 20 667 37 505 37 433 56 041 56 463 78 645 79 296 42 179 42 482 61 386 61 788 84 247 85 658 41 538 41 750 65 087 65 231 96 580 98 005 75 195 75 066 119 125 120 001 171 355 171 459
Table 17. Computing partitions from scratch � = 5%. In each k-column the results computed by KaFFPa are on the left and the current Walshaw cuts are presented on the right side.