Salsalate activates brown adipose tissue in mice. Diabetes. 2015;64: 1544â1554. doi:10.2337/db14-1125. 14. Auvinen HE, Wang Y, Princen H, Romijn JA, ...
S1 Note: Experimental setup Supplemental material for “In vivo and in silico dynamics of the development of Metabolic Syndrome” by Y.J.W. Rozendaal, Y. Wang, Y. Paalvast, L.L. Tambyrajah, Z. Li, K. Willems van Dijk, P.C.N. Rensen, J.A. Kuivenhoven, A.K. Groen, P.A.J. Hilbers, N.A.W. van Riel
In this study we used male APOE*3-Leiden.CETP mice on a high-fat, cholesterol containing diet to study the onset and development of diet-induced Metabolic Syndrome. All data is available in S1 Data. Choice of animal model The APOE*3-Leiden.CETP mouse is a double transgenic animal. Through the genetic APOE*3-Leiden (E3L) mutation, E3L mice have a defective triglyceride-rich lipoprotein (TRL) clearance, which mimics the lower TRL clearance in humans. The E3L mice display an elevated basal cholesterol level and exhibit a human-like lipoprotein profile, develop atherosclerosis upon saturated fat and cholesterol feeding [1,2] and also respond in a human-like manner to drugs used in the treatment of cardiovascular diseases. [3–6] Another important difference between the murine and human lipoprotein metabolic system is the exchange and transfer of cholesteryl esters (CE) and triglycerides (TG) between HDL and (V)LDL particles through the cholesteryl ester transfer protein (CETP). Mice do not naturally possess the CETP gene and do therefore not respond to HDL-modulating interventions. By cross-breeding the E3L mice to mice expressing the human CETP gene [7], E3L.CETP mice show an even more human-like lipoprotein metabolism. The expression of the human CETP gene shifts the distribution of cholesterol from HDL towards (V)LDL. [1,8] E3L.CETP mice have the ability to reproduce obesity, diabetes, dyslipidemia and atherosclerosis and they respond to both lipid-lowering and HDL-raising interventions. [9–12] Previous studies using E3L.CETP mice revealed that male E3L.CETP mice upon feeding a high-fat diet develop obesity and diabetes. [10,13] Female E3L.CETP mice that are fed with a high-fat diet with additional cholesterol (the so-called ‘Western-type diet’) develop dyslipidemia and atherosclerosis. [1,9,12,14–21] The E3L.CETP mouse model can be used to study the associated processes in MetS in more depth. We expected this animal model to develop obesity, diabetes and dyslipidemia upon feeding male E3L.CETP mice a high-fat diet with additional cholesterol. Study outline All animal experiments were performed in accordance with the regulations of Dutch law on animal welfare, and the Animal Ethics Committee of the Leiden University Medical Center, Leiden, The Netherlands. Homozygous CETP transgenic mice expressing the human CETP gene under the control of its natural flanking regions (Jackson Laboratory, Bar Harbor, Maine, USA) [7] were crossbred with heterozygous APOE*3-Leiden (E3L) mice [22] to obtain E3L.CETP mice in our own animal facility. Dietary induction protocol In this study we used male E3L.CETP transgenic mice that were housed under standard conditions with a 12 h light/dark cycle (7AM-7PM), co-housed with 1-4 animals in conventional cages with free access to food and water, unless indicated otherwise. Animals were housed in a temperature-controlled environment (21 °C). At the age of 10.8 ± 2.2 w weeks, randomized according to body weight and plasma lipids (total cholesterol and triglyceride) and glucose level, mice were divided into three groups: mice were fed a low-fat diet (LFD; n=8), high-fat diet (HFD; n=12) or a high-fat diet with supplemental cholesterol (Sigma, 0.25 gm%) (HFD+C; n=8) for 12 weeks. The low-fat diet has a 20% energy content derived from lard and contains 3.8 kcal/g diet; the high-fat diets have a 60% energy content derived from lard and contains 5.2 kcal/g diet (OpenSource Diets, Research Diets, Inc. New Brunswick, USA). The specific composition of each diet is listed in Table A. Table A: Composition of the low-fat, high-fat and high-fat with cholesterol diets. LFD HFD HFD+C gm% kcal% gm% kcal% gm% kcal% protein 19 20 26 20 26 20 carbohydrates 67 70 26 20 26 20 fat 4 10 35 60 35 60 cholesterol 0 0 0.028 0 0.25 0 kcal/g 3.8 5.2 5.2 1
Responders and non-responders Only animals correctly expressing the genotype and responding to the high-fat diet (if applicable) were included in this study. We used the following selection criteria: 1) correct animal genotype (expressing the APOE*3-Leiden and CETP genes) and phenotype: baseline measurement (animals on chow-diet, hence before the start of the dietary induction): plasma triglycerides ≥ 1 mM and plasma total cholesterol ≥ 2 mM; and 2) responding to dietary induction: bodyweight ≥ 35 g after 8 weeks of HFD. Experimental details of the measurement protocol During the study, body weight and food intake were measured weekly (Fig. 1a-c). Body composition (lean and fat mass) was determined in conscious mice using an EchoMRI-100 (EchoMRI, Houston, Texas, USA) every other week. Before (0) and 4, 8, 12 weeks after dietary induction, blood samples were taken by tail vein bleeding into heparin and paraoxon (to inhibit lipase activity) coated capillary tubes, after 5 h of fasting with food withdrawn at 8.00 AM. The tubes were placed on ice and centrifuged, and the obtained plasma was snap frozen in liquid nitrogen and stored at -20°C until further measurements. Plasma was analyzed for cholesterol, triglycerides, lipoproteins, glucose and insulin (Fig. 1d-h). Plasma metabolites Blood plasma was assessed for glucose using Glucose reagent 1 and 2 (start reagent) (Instruchemie, Delfzijl, The Netherlands) with a 1 mg/mL glucose standard (Sigma-Aldrich, Saint Louis, Missouri, USA). Insulin was measured using the Ultra Sensitive Mouse Insulin ELISA Kit (Crystal Chem, Downers Grove, Illinois, USA). Besides the monthly 5 h fasting values, also oral glucose tolerance tests (OGTT) have been performed before (0) and after 6 and 11 weeks dietary induction in overnight fasted mice (7PM-9AM). The glucose (Fig. A a-c) and insulin (Fig. A d-f) responses were measured at 0, 5, 18, 35, 60 and 120 minutes after oral gavage (1 g glucose per kg body weight). Blood glucose is determined by tail bleeding using a portable glucometer (2 μL) and a half of capillary of blood (30 μL) is collected by tail bleeding for insulin measurements.
Figure A: Glucose (a-c) and insulin (d-f) response profiles to an Oral Glucose Tolerance Test after 0 (a,d), 6 (b,e) and 11 (c,f) weeks of dietary induction. The data are depicted using error bars representing mean ± standard deviation for each subgroup separately.
Circulating lipid species were also assessed monthly after 5 hours of fasting. Plasma triglycerides (TG) were measured using a total triglyceride set (Roche diagnostics) using precimat glycerol of 2.29 mM. Plasma free fatty acids were measured using the NEFA-HR(2) kit from Wako Diagnostics (Instruchemie, Delfzijl, The Netherlands). Plasma total cholesterol (TC) was measured using a total cholesterol set (Roche diagnostics) using a cholesterol calibrator of 200 mg/dL (Instruchemie, Delfzijl, The Netherlands). Plasma HDL cholesterol was measured using precipitation of ApoB-containing lipoproteins with PEG 6000#. Hepatic de novo lipogenesis Hepatic de novo lipogenesis (DNL) was assessed at the 3 month time point using a labelled acetate tracer experiment (Fig. 5d). Animals receive drinking water containing sodium-1-13C-acetate (2%) during the final 24 hours of the study (started at 8 AM). To subject the animals to a postprandial fast, food was removed the next morning at 8 AM while the acetate containing drinking water remained available. At 10 AM the 2
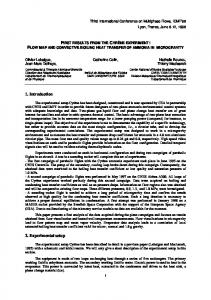
animals were sacrificed by CO2 inhalation and livers were quickly exercised and stored for further lipid analysis. Liver histology score Paraffin-embedded liver sections were stained with hematoxylin and eosin (H&E). According to the histological NAFLD scoring system for rodent models of Liang et al. [23] two key features of NASH: steatosis and inflammation, were determined. Briefly, steatosis was scored by hepatocellular vesicular steatosis, i.e. macrovesicular steatosis and microvesicular steatosis fractions separately. Inflammation was scored by analyzing the amount of inflammatory cell aggregates per field using a 100 X magnification (view size of 1.46 mm2) (Fig. B).
Figure B: Liver histology data of steatosis (a-b) and inflammation markers (c). The data are depicted using error bars representing mean ± standard deviation for each subgroup separately. Differences between groups were determined using one-way ANOVA test. When significant differences were found, Fisher’s LSD test was used as a post hoc test to determine the differences between two independent groups: * P