WCCI 2012 IEEE World Congress on Computational Intelligence June, 10-15, 2012 - Brisbane, Australia
IJCNN
Function approximation with uncertainty propagation in a VLSI spiking neural network Dane Corneil∗ , Daniel Sonnleithner∗ , Emre Neftci∗ , Elisabetta Chicca† , Matthew Cook∗ , Giacomo Indiveri∗ , Rodney Douglas∗ ∗ Institute
†
of Neuroinformatics University of Zurich and ETH Zurich Email:
[email protected] Cognitive Interaction Technology - Center of Excellence Bielefeld University, Germany
Abstract—The brain combines and integrates multiple cues to take coherent, context-dependent action using distributed, eventbased computational primitives. Computational models that use these principles in software simulations of recurrently coupled spiking neural networks have been demonstrated in the past, but their implementation in hybrid analog/digital Very Large Scale Integration (VLSI) spiking neural networks remains challenging. Here, we demonstrate a distributed spiking neural network architecture comprising multiple neuromorphic VLSI chips able to reproduce these types of cue combination and integration operations. This is achieved by encoding cues as population activities of input nodes in a network of recurrently coupled VLSI Integrate-and-Fire (I&F) neurons. The value of the cue is place-encoded, while its uncertainty is represented by the width of the population activity profile. Relationships among different cues are specified through bidirectional connectivity matrices, shared between the individual input node populations and an intermediate node population. The resulting network dynamics bidirectionally relate not only the values of three variables according to a specified relation, but also their uncertainties. When cues on two populations are specified, the standard deviation of the activity in the unspecified population varies approximately linearly with the widths of the two input cues, and has less than 6% error in position compared to the value specified by the inputs. The results suggest a mechanism for recurrently relating cues such that missing information can both be recovered and assigned a level of certainty.
I. I NTRODUCTION The combination of sensory input cues and the inference of missing information from noisy, incomplete sensory cues are fundamental computations carried out by the brain [1]. The brain performs these prodigious feats using networks of heterogeneous, spike-communicating neurons, which stand in stark contrast to the technology and algorithms employed by digital processors. Recent theoretical studies have demonstrated with simulations how such computations could be performed in a biologically plausible manner, using arrays of ideal neurons with real-valued outputs [2]–[4]. A class of neural networks using probabilistic population codes are capable of near-optimal manipulation of probabilistic distributions [2], [3], [5]. One attractive feature of this type of network is that the uncertainty of the input cues, typically encoded in the width of a population activity profile, is propagated in the network [2]. The propagation of cue
U.S. Government work not protected by U.S. copyright
uncertainty in neural populations is relevant for many tasks such as sensorimotor transformations [6], cue integration [2] and decision making [5]. Our contribution here is to develop an electronic VLSI emulation of a spiking neural network that communicates by asynchronous events to infer, in real-time, the value and the variability of a cue based on the other cues available to the system. The neural architecture is based on a recently proposed one [7] consisting of four networks of spiking neurons, three of which provided sensory input while the fourth encoded the relation between these inputs. The three input networks were configured as 1-D arrays of I&F neurons whose lateral excitatory and global inhibitory couplings implemented a soft Winner-Take-All (sWTA) network [8]. The recurrent pattern of connections in the sWTA is consistent with the observed connectivity of the neocortex [9] and has been proposed as an important neural computational primitive [10] that can be combined easily and stably in large networks [11]. These input sWTA populations provided place-encoded representations of their sensory variables. The relationship between the variables was specified by the bidirectional connectivity between the individual sWTA networks and the central 2-D WTA network. One shortcoming of this architecture, however, was that it disregarded the uncertainty of the cues. This was due to the hard WTA computations taking place in the intermediate node that caused only a single unit to become active. Here, we extend this architecture by allowing the intermediate node to select multiple winners in a sequential manner. The result is that the network conveys, in addition to the value of a variable, the information related to the widths of the neural activity profiles, causing them to be sharpened or broadened according to the widths of the activity profiles in all other nodes. As in the previous implementation, the recurrent excitation developed by the input sWTA networks, constrained by the patterns embedded in their interconnections with the central node, provides the gain necessary to recover an unspecified cue when the two others are specified (function approximation). Thanks to the bidirectional connections in the network, each node acts simultaneously as an input and an output node. The interaction of populations of neurons with various profiles of activation resembles the interaction of statistical
2990
distributions used in graphical probabilistic models such as Bayesian networks [3]. Consequently, the realization of these computations in distributed electronic hardware is a step towards a scalable technology for real-time probabilistic inference in generic probabilistic models. II. T HE M ULTI -C HIP S ETUP The neuromorphic network architecture described here is based on the one described in Corneil et al. [7], and is summarized below. The network is distributed across two different types of chips: a 2-D Integrate-and-Fire (IF2D) chip, which implements a 2-D array of I&F neurons, and a 2-D WinnerTake-All (WTA2D) chip, which implements a current-mode Winner-Take-All (WTA) network. These are neuromorphic chips which receive and transmit spikes using the Address Event Representation (AER) communication protocol [12]. The asynchronous infrastructure used to transmit spikes across chip boundaries makes use of dedicated AER communication and mapper FPGA boards, which allow the user to specify arbitrary network connectivity schemes [13]. This mapper board also allows the probability that an event is routed or discarded to be set for each connection. A. The 2-D Integrate-and-Fire (IF2D) Chip The IF2D consists of a 2-D sheet of 32 × 64 neurons, with three externally addressable AER synapse circuits each (2 excitatory, 1 inhibitory). The synapses are pulse integrators that can be stimulated by other neurons on the same chip, or by Address-Events from outside sources to produce biophysically realistic Excitatory Post-Synaptic Currents (EPSCs). In addition, there are local hard-wired synapse circuits that integrate spikes from nearest neighbor neurons on the same chip. There is no dedicated locally hard-wired inhibitory neuron pool. Instead, the global inhibition required for sWTA operation can be provided by making use of the AER inhibitory synapses of all the neurons in the array, via the AER mapping board. By activating both local recurrent excitatory connections and external recurrent inhibitory connections (all-to-all) to provide global inhibition, it is possible to produce the sWTA function, in which the winners are a small population of neighboring neurons that suppress or reduce the activity of all other neurons in the network. The chip can be configured to provide up to 32 independent sWTA networks consisting each of (up to) 64 neurons. The IF2D was fabricated using a standard AMS 0.35 µm CMOS process, and covers an area of about 15 mm2 . B. The 2-D Winner-Take-All (WTA2D) Chip The WTA2D chip comprises a grid of 32 × 32 cells. Each cell contains an AER excitatory input synapse, a current-mode WTA circuit, an output I&F neuron and an inhibitory synapse targeting the cell itself [14]. The AER excitatory synapse integrates the input spikes and produces an output current, which is proportional to the frequency of the input spike train. In contrast to the setup used in Corneil et al. [7], we use local excitation and self-inhibition in the WTA2D to perform sWTA functionality. Local excitation allows current to diffuse
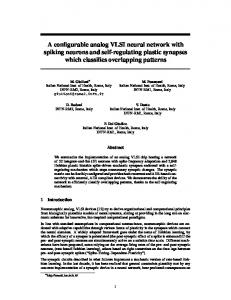
across neighboring cells, causing the WTA circuit to favor cells with neighbors that are also stimulated strongly. The current-mode WTA circuit then selects the cell receiving the strongest input and activates its corresponding output neuron. The inhibitory synapse integrates the spikes from the winning neuron, producing an inhibitory current, which is subtracted from the excitatory synapse current. This eventually causes de-selection of the winner, encouraging exploration across the subset of cells that are strongly stimulated. The number of cells that can be activated depends on the stimuli, the couplings in the current-mode WTA and the inhibitory feedback. Output Address-Events encode the position of the winning cell. Due to the nature of the current-mode WTA circuit, only one neuron is active at any given time. However, using the self-activated inhibitory synapse, the winning neuron can switch quickly between a subset of strongly activated cells. Combined with local excitation, this causes the WTA2D to exhibit characteristics similar to those of the sWTA function. The WTA2D chip was fabricated using a standard AMS 0.35 µm CMOS process and covers an area of about 10 mm2 . C. Network Architecture The organization of the network is illustrated in Fig. 1. We selected three distinct arrays of 32 neurons from the IF2D chip. These arrays formed the populations whose activities represent three cues, labeled X, Y and Z. Each array was configured as a sWTA network by activating the local recurrent firstand second-neighbor excitatory connections and the global inhibitory ones. Each population was bidirectionally coupled with the neurons in the WTA2D chip (population R). Specifically, the R neurons in the WTA2D chip were connected to the X, Y and Z neurons in the IF2D chip via their first AER excitatory synapse. All synapses in this group share the same weight parameter. However, using a probabilistic AER mapping protocol, a probability indicating the percentage of spike-events transmitted to the post-synaptic neuron can be assigned to each mapping. The connection probability allowed the strength of each coupling to be separately modulated. Each neuron in R is tuned according to two Gaussian functions centered on the neurons with corresponding indices in X and Y. Likewise, each neuron in X and Y is tuned according to a Gaussian function centered on the corresponding column or row in R (see Fig. 1). The reciprocal connection matrix between R and Z determines the user-specified relation. It is possible to implement any linear and non-linear relation between the variables [1], [2]. To demonstrate the functionality of our system, we focus here on the relation Z = (X + Y ) modulo(32) (see Fig. 1). Each tuning curve has a 100% probability of spike transmission at the center, with the probability decreasing with σ = 1.0 for neighboring presynaptic neurons. We generated input signals on a PC and provided them to the X, Y and Z populations on the IF2D chip by stimulating the target neurons via their second AER excitatory synapse.
2991
To reduce the effect of fabrication mismatch, we calibrated the inputs to neurons in populations X, Y and Z using the method described in Neftci et al. [15]. A similar method was used to determine systematic biases in the connections from the WTA2D chip to the IF2D populations. These biases were due to variation in the output firing rates from neurons in the WTA2D chip and in the synaptic efficacy of input synapses on the IF2D populations. The connection probabilities between the populations were adjusted in order to decrease this variation. The neurons in the WTA2D chip did not receive any external stimulation from the PC. The combination of global inhibition, local excitation and self-inhibition of the winning cell on the WTA2D causes it to sample over a subset of the most strongly stimulated cells. In general, with the given connection profiles, only cells which are stimulated by two or more external populations are able to fire. When inputs to R are broad, many cells share similar levels of activation, and the winning cell in R shifts constantly among a large subset. Conversely, when the inputs to R are sharp, only a small number of cells are provoked to fire. The spatial variance of the output from R determines the number of cells activated in populations X, Y and Z, allowing the three populations to communicate both the mean and the variance of cues through the R population. III. R EAL - TIME EXPERIMENTS Although this network architecture can be used to achieve several types of computations [1], [2], we focus here on function approximation: the recovery of an unspecified cue when other related cues are specified. We carried out 600 trials using the sum relation Z = (X +Y ) modulo(32)
Y
6
R X
Z
6
0 0 0 6 Fig. 1: Illustration of the network architecture. In this example the user-defined function is Z = (X + Y ) modulo(7). Each neuron in populations X and Y feeds into all neurons in the associated diagonal row in population R. The intensity of excitation is indicated by color intensity; neurons in R with greater excitation fire more frequently. According to the userdefined relation, each neuron in Z is connected to two vertical columns in R (except the last neuron, which is connected to only one column). External input signals are represented by the left and right black shapes. On the left, Gaussian inputs are centered around neuron 2 in both X and Y. On the right, a constant input is applied to Z. The firing activity in X and Y produces maximum activation at location [2, 2] on R, which is associated with neuron 4 in Z. Neuron 4 in Z is associated with the two columns outlined in black in R, which receive recurrent excitation after activity converges in Z.
(1)
We applied Poisson-distributed spike trains with Gaussian spatial distributions to neurons of populations X and Y, centered at 20 in X and 24 in Y (corresponding to a sum of 12). In addition, we applied Poisson-distributed spike trains to the neurons in Z, with uniform mean firing rates equal to the average of the firing rates across populations X and Y. The input to Z did not encode the correct value of Z given by the relation. We applied the external stimulation to all three populations simultaneously for 5000 ms and recorded spikeevents over this interval. For 200 trials, the width of the Gaussian inputs to X and Y were sampled evenly over σ = [0.8, 3.5], with the inputs to both populations sharing the same width in each trial. For another 200 trials, the input to X was sampled evenly over σ = [0.8, 3.5] while the input to Y was held at a constant width of σ = 0.8. Similarly, for 200 trials, the input to Y was sampled over σ = [0.8, 3.5] while the input to X was held constant at σ = 0.8. Within each trial, the input width did not change during the stimulation period. Gaussian inputs to X and Y were normalized, such that all populations received approximately the same average level of input stimulation across all trials.
For each trial, spikes were recorded over the stimulation period across populations X, Y and Z. The position of maximum activity in each population was determined by taking the circular mean of the spiking activity, obtained by mapping the neuron positions onto a circle. This corrects for the bias introduced by the flat stimulation to Z, and was consistent with the periodic boundary conditions defined by the modulus operator in the sum function. The neuron with the highest overall firing rate in each population was also used as a measure of activity position. The circular standard deviation of the population activities was used to measure the degree of spiking activity spread [16]. Specifically, the sample standard deviation was estimated as σ=
q ¯ −2ln(R),
(2)
where R¯ is the length of the sample mean resultant vector. Note that this value varies between zero and √ infinity, unlike ¯ which the square root of the sample circular variance 1 − R, varies between zero and one. This provides a better approximation of the standard deviation of the unwrapped distribution.
2992
TABLE I: P OPULATION ACTIVITY POSITIONS 3.5
Population
Input Activity Standard Deviations
0.27
Input Condition
X
Y
Z
Varying X and Y Varying X Varying Y
19.70 ± 0.02 19.44 ± 0.03 19.94 ± 0.00
23.91 ± 0.02 23.97 ± 0.00 24.00 ± 0.01
11.41 ± 0.03 11.12 ± 0.04 11.90 ± 0.02
0.24
3.0
0.21 2.5
0.18 0.15
2.0
0.12
TABLE II: F ITTED STANDARD DEVIATION GROWTH RATES
0.09 1.5
Population
0.06
X
Y
Z
Varying X and Y
m = 0.60 R2 = 0.96
m = 0.53 R2 = 0.94
m = 0.96 R2 = 0.82
Varying X
m = 0.60 R2 = 0.96
m = −0.02 R2 = 0.21
m = 0.43 R2 = 0.63
Varying Y
m = −0.02 R2 = 0.32
m = 0.53 R2 = 0.94
m = 0.51 R2 = 0.65
0.03
1.0 0
Input Condition
5
10
15 20 Neuron ID
25
30
0.00
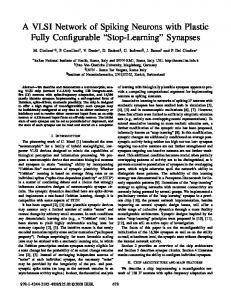
Fig. 2: Normalized activity in Z across 200 trials, with both inputs increasing in width from σ = 0.8 to σ = 3.5 simultaneously. The activity centers near Neuron 12, consistent with (20 + 24) modulo(32) = 12. As the inputs to X and Y increase in width, the activity profile in Z flattens and the mean firing rate decreases.
IV. E XPERIMENTAL R ESULTS The network accurately computed the value of the unspecified variable given the relation and communicated the uncertainties between the sWTA nodes. In each input condition, the center of activity in Z averaged over all trials lay between 11 and 12 (Table I). This corresponds to less than 6% error around the circular array. The neuron at position 12 in Z had the highest firing rate in 80% of trials. The standard deviation of activity in Z increased linearly with the widths of the inputs to X and Y (Fig. 3 (b) and Fig. 4). The trend held when the inputs were simultaneously widened and when one width was increased while the other was held constant. The increase was significantly steeper when the two inputs were widened simultaneously, reflecting sensitivity to uncertainty in one or both inputs. The relationships between the input widths and evoked activity in the three populations are reported in Table II, using the slopes and the coefficients of determination of the linear regression fits. All trends were extremely significant (p < 0.001) using the null hypothesis that m = 0. Several factors contributed to the trend of the standard deviation in Z. There was a nonlinear decrease in firing rates in Z with increasing input widths (see Fig. 3 (a)), causing the flat external stimulation to Z to progressively dominate over the recurrent stimulation. In addition, while the number of highly active neurons in Z did not increase significantly with wider inputs (as shown in Fig. 2), the sharpness of the representation decreased; activity was shared more equally between the highly active neurons, increasing the spread. Uncertainty encoding in Z was mediated by stimulation from R, which encoded variance through the number of
activated neurons. When narrow inputs were used (Fig. 5 (a) and (b)), activity in R was stable and concentrated among a small group of neurons, causing activity in Z to quickly converge to the correct value. The spatially localized activity evoked in Z fed back to R, increasing the number of active neurons over time. Recurrent activation produced a diagonal pattern in R according to the sum relation, as shown in Fig. 5 (b). When the inputs were broad (Fig. 5 (c) and (d)), activity in R fluctuated between adjacent clusters of excited cells. This affected both the level of activity and stability of activity in Z, and therefore the level of feedback to R. Both the mean activity position and maximum firing rates in Y were centered at the position of maximum input; neuron 24 had the highest firing rate in 97% of the trials. In X, the mean activity position was slightly lower than the input center, and the highest firing rate was at position 20 in 73% of the trials. Activity in both X and Z tended to be centered at a slightly lower position than the inputs would dictate. As expected, error in the two populations was correlated (p < 0.001). The tendency for activity to drift increased as the inputs became broader (see leftward shift in Fig. 2). V. D ISCUSSION One remarkable aspect of the brain is its ability to compute with highly variable cues provided by a variety of sensory streams and infer missing information. Here, we demonstrate a multichip system consisting of electronic emulations of spiking neural networks able to achieve such performance in a function approximation task. In this task, the network must recover an unspecified cue when the two others are specified, according to the relation encoded by the network connectivity patterns.
2993
8 Population X Population Y Population Z
8
Output Activity Standard Deviations
Mean Firing Rate on Population [Hz]
9
7 6 5 4 3 2 1
1.0
1.5 2.0 2.5 3.0 Input Activity Standard Deviations
7 6 5 4 3 2 1 0
3.5
(a) Normalized activity in all nodes
Population X Population Y Population Z
1.0
1.5 2.0 2.5 3.0 Input Activity Standard Deviations
3.5
(b) Activity standard deviations in all nodes
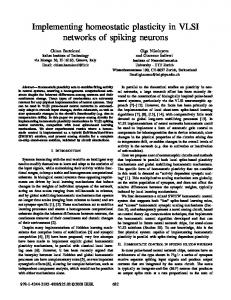
Fig. 3: Output activity when inputs are increased in width simultaneously. (a) Mean firing rates in X (green), Y (red) and Z (blue) with increasing input widths. The firing rates in all three populations decrease nonlinearly. (b) Population standard deviations in X (green), Y (red) and Z (blue) with increasing input widths. The standard deviations in all populations increase linearly. Due to local sWTA dynamics and recurrent stimulation from R, the widths in X and Y are significantly sharper and increase at a slower rate than their inputs.
Output Activity Standard Deviations
8
7
X Input Varied Y Input Varied Both Inputs Varied
6
m=0.96
5
m=0.51 m=0.43
4
3
0.5
1.0
1.5 2.0 2.5 3.0 3.5 Input Activity Standard Deviations
4.0
Fig. 4: Relationship between the standard deviation in Z and the input standard deviations. The activity standard deviation in Z as both inputs are widened simultaneously is shown in blue; the resulting standard deviations when only one of X or Y is widened are shown in green and red, respectively. The linear fits reflect a proportional representation of uncertainty. Activity in Z is determined by the activity evoked in R, which becomes weaker as the input cues grow wider (see Fig. 5 (b) and (d)).
In a previous instance of this multichip system [7], the network was able to compute the value of an unspecified variable, but could not assign an uncertainty to it given the uncertainty over the specified variables. Our implementation extends this system by combining the variabilities of the cues (encoded in the widths of the activities) with each other. The novel feature enabling this is the computation of the sWTA function in the intermediate node, instead of hard WTA [8]. This is achieved using the same hardware, but with the intermediate node configured with feedback inhibiting the winning neuron each time it spikes. As a result, the intermediate node responds to the subset of winning neurons, whose spatial extent depends on the input activity profiles. The results show that the neuromorphic setup allows both mean and variance information to be bidirectionally transmitted across the intermediate node. Although the experiments focused on relating the variables according to the sum relation, the same architecture can be generalized to compute any linear or nonlinear relation between three variables [1], [2]. Fabrication mismatch can strongly affect the performance of emulations of spiking neural networks. Here, the effect of mismatch in neuron firing rates was compensated by using a probabilistic mapping protocol. This adjustment is particularly important in recurrent networks, where uneven firing rates can significantly affect the network behavior. Despite these corrections, considerably different results were observed based on the portion of the input space stimulated; therefore, a single input combination was used to constrain the sources of variation. These variations are most likely due to mismatch in the current-mode WTA circuit on the WTA2D chip, causing systematic biases in the probability of a cell winning the
2994
180
30
Population Y Input
Population
Z
Y
140 120
20
100
15
80 60
10
40
5
X 0
160
25
R
1000
2000 3000 Time [ms]
4000
00
5000
20 5
(a) Raster plot (σ = 0.8)
15 10 20 Population X Input
25
30
(b) WTA2D activity map (σ = 0.8)
30
Population Y Input
Population
48
25
R
Z
Y
42 36
20
30
15
24
10
18 12
5
X 0
1000
2000 3000 Time [ms]
0
4000
00
5000
(c) Raster plot (σ = 3.5)
6 5
15 10 20 Population X Input
25
30
0
(d) WTA2D activity map (σ = 3.5)
Fig. 5: Activity comparison between narrow and wide inputs. [Left] Provoked activity in the four populations for (a) identical sharp inputs (σ = 0.8) and (c) identical wide inputs (σ = 3.5). The two-dimensional Population R is flattened. (a) Concentrated activation from X and Y produces stable activity over a small subset of neurons in R; this subset expands over time with greater recurrent activation from Z. Activity in Z is strong and peaked. (c) Diffuse activation from X and Y produces fluctuations in R, resulting in weak, flat activity in Z. [Right] Mean firing rates in Hz in Population R for (b) identical sharp inputs (σ = 0.8) and (d) identical wide inputs (σ = 3.5). Dotted white lines indicate the standard deviations of the inputs to Population X and Population Y. Concentrated inputs produce greater recurrent activation from Z, resulting in a diagonal pattern (due to the connection profile of the sum relation).
competition at any point in time. This input-side WTA2D variation may also have caused the leftward bias in activity convergence observed in X and Z (see Fig. 2). The bidirectional connections between nodes in the network allow each layer to act as an input or an output node. However, such recurrent excitatory connections between sWTA networks can lead to instabilities [11]. To avoid this problem in this network, it is sufficient to verify that each node is stable in isolation. This is because the WTA2D chip, which is the only link between the nodes, does not respond to its input in a linear fashion, but rather reaches a saturation value. This greatly helps in maintaining the stability of this recurrent
network. Therefore, several instances of this network can be stably combined to build relationships among a larger number of variables and perform generic processing in neuromorphic systems. The system presented here can offer an efficient technology for building probabilistic models, such as Bayesian networks or Factor Graphs. ACKNOWLEDGEMENT This work was supported by the EU ERC Grant “neuroP” (257219), the EU ICT Grant “SCANDLE” (231168), by the Swiss SNF Grant “nAttention” (121713), the Excellence Cluster 227 (CITEC, Bielefeld University), and by the ETH
2995
Research Grant ETH-23 08-1 and EU Project Grant FET-IP216593. The WTA2D chip was designed in collaboration with C Bartolozzi. We thank D. Fasnacht for the design of the AER mapper and the AER monitor/sequencer boards. R EFERENCES [1] E. Salinas and T. Sejnowski, “Correlated neuronal activity and the flow of neural information,” Nature Reviews Neuroscience, vol. 2, pp. 539– 550, 2001. [2] S. Deneve, P. Latham, and A. Pouget, “Efficient computation and cue integration with noisy population codes,” Nature Neuroscience, vol. 4, no. 8, pp. 826–831, 2001. [3] W. J. Ma, J. M. Beck, P. E. Latham, and A. Pouget, “Bayesian inference with probabilistic population codes,” Nature Neurosci, vol. 9, no. 11, pp. 1432–1438, Nov 2006. [4] M. Cook, F. Jug, C. Krautz, and A. Steger, “Unsupervised learning of relations,” Artificial Neural Networks–ICANN 2010, pp. 164–173, 2010. [5] J. Beck, et al., “Probabilistic population codes for bayesian decision making,” Neuron, vol. 60, no. 6, pp. 1142–1152, 2008. [6] E. Salinas and L. Abbott, “Coordinate transformations in the visual system: how to generate gain fields and what to compute with them,” Progress in brain research, vol. 130, pp. 175–190, 2001. [7] D. Corneil, et al., “Real-time inference in a VLSI spiking neural network,” in International Symposium on Circuits and Systems, ISCAS 2012. IEEE, 2012, to appear. [Online]. Available: http://ncs.ethz.ch/pubs/pdf/Corneil etal12.pdf [8] A. L. Yuille and D. Geiger, Winner-Take-All Networks. The MIT Press, Cambridge, Massachussets, 2003, ch. Part III: Articles, pp. 1228–1231. [9] T. Binzegger, R. Douglas, and K. Martin, “A quantitative map of the circuit of cat primary visual cortex,” J. Neurosci., vol. 24, no. 39, pp. 8441–53, 2004. [10] R. Douglas and K. Martin, “Neural circuits of the neocortex,” Annual Review of Neuroscience, vol. 27, pp. 419–51, 2004. [11] U. Rutishauser, R. Douglas, and J. Slotine, “Collective stability of networks of winner-take-all circuits,” Neural Computation, vol. 23, no. 3, pp. 735–773, 2011. [12] S. Deiss, R. Douglas, and A. Whatley, “A pulse-coded communications infrastructure for neuromorphic systems,” in Pulsed Neural Networks, W. Maass and C. Bishop, Eds. MIT Press, 1998, ch. 6, pp. 157–78. [13] D. Fasnacht and G. Indiveri, “A PCI based high-fanout AER mapper with 2 GiB RAM look-up table, 0.8 µs latency and 66 MHz output event-rate,” in Conference on Information Sciences and Systems, CISS 2011, Johns Hopkins University, March 2011, pp. 1–6. [Online]. Available: http://ncs.ethz.ch/pubs/pdf/Fasnacht Indiveri11.pdf [14] C. Bartolozzi and G. Indiveri, “Selective attention in multi-chip address-event systems,” Sensors, vol. 9, no. 7, pp. 5076–5098, 2009. [15] E. Neftci and G. Indiveri, “A device mismatch reduction method for VLSI spiking neural networks,” in Biomedical Circuits and Systems Conference BIOCAS 2010. IEEE, 2010, pp. 262–265. [Online]. Available: http://ncs.ethz.ch/pubs/pdf/Neftci Indiveri10.pdf [16] N. Fisher, Statistical Analysis of Circular Data. Cambridge University Press, 1993, pp. 32–33.
2996