Money laundering is hard to detect because the occurences are very infrequent ... if a computer system is able to suggest a limited number of transactions to be ...
Proceedings of the Federated Conference on Computer Science and Information Systems pp. 69–75
ISBN 978-83-60810-22-4
Graph Mining Approach to Suspicious Transaction Detection Krzysztof Michalak, Jerzy Korczak Institute of Business Informatics Wroclaw University of Economics, Wroclaw, Poland Email: {krzysztof.michalak,jerzy.korczak}@ue.wroc.pl
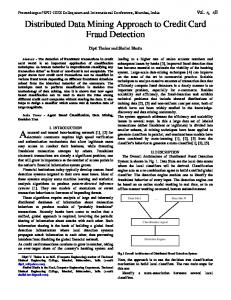
593,819 fraudulent credit card transactions detected in Australia worth in total $145,854,208 [7]. In the same year over 1.4 billion credit card transactions were made for a total amount of more than 195 billion dollars (values calculated using statistics from [8]). The same sources report 241,063 fraudulent credit card transactions totalling $85,215,615 in 2006 and a total number of over 1.1 billion transactions worth in total over 155 billion dollars. In the above-cited cases fraudulent transactions constitute only 0.02 − 0.04% of all transactions which means that data manifest extreme class imbalance. This in itself creates a significant challenge for many machine learning methods. Typically, the money laundering process is divided into three stages: placement, layering and integration [5]. Each of the stages involves various schemes of money transfering between bank accounts. These schemes can be identified as subgraphs in the transaction graph. Figure 1 shows two simple examples of subgraphs which represent transfering money via a number of intermediaries.
Abstract—Suspicious transaction detection is used to report banking transactions that may be connected with criminal activities. Obviously, perpetrators of criminal acts strive to make the transactions as innocent-looking as possible. Because activities such as money laundering may involve complex organizational schemes, machine learning techniques based on individual transactions analysis may perform poorly when applied to suspicious transaction detection. In this paper, we propose a new machine learning method for mining transaction graphs. The method proposed in this paper builds a model of subgraphs that may contain suspicious transactions. The model used in our method is parametrized using fuzzy numbers which represent parameters of transactions and of the transaction subgraphs to be detected. Because money laundering may involve transferring money through a variable number of accounts the model representing transaction subgraphs is also parametrized with respect to some structural features. In contrast to some other graph mining methods in which graph isomorphisms are used to match data to the model, in our method we perform a fuzzy matching of graph structures.
I. I NTRODUCTION INANCIAL institutions such as banks are legally obliged to monitor activities of their customers and to report events that may indicate involvment in a criminal act. In the case of bank transactions monitoring, one of the goals is to detect money laundering activities i.e. activities aimed at concealing the origin of illegally-obtained money. There are several difficulties in money laundering detection. People involved in money laundering obviously try to conceal the real purpose of money transfers used in this process. Therefore, one can expect that individual transactions will not clearly stand out from amongst other bank transfers. The probability of a fraud depends not only on parameters of individual bank transfer but also on relations with other transfers and the entities that send them. The volume and value of transactions reported as suspicious are very high. For example, the value of transactions reported to the anti-money laundering watchdog by Russian financial institutions in the first nine months of 2010 was 120 trillion roubles (2.44 trillion pounds, 3.8 trillion dollars) [9]. 5.6 million filings were made by banks, insurance companies and financials service companies in this period. In the area of fraud detection it is typical that events to be detected are in considerable minority compared to the overall amount of data. For example, in 2010 there were
F
c 2011 IEEE 978-83-60810-22-4/$25.00
Sender
Sender Fig. 1. activities
Intermediaries
Intermediaries
Receiver
Receiver
Examples of subgraphs which may indicate money-laundering
In the first case a larger amount is split to smaller transfers in order to decrease the probability that individual transactions will be reported as suspicious. The second case serves the purpose of obscuring the connection between the sender and the receiver. The entire money laundering operation may involve many such schemes, so identification of a suspicious subgraph may help in uncovering much larger network of ille-
69
70
PROCEEDINGS OF THE FEDCSIS. SZCZECIN, 2011
gal transactions. Money laundering operations are intertwined with many other transactions, including legal ones. Figure 2 shows a small subgraph of transactions (in which vertices are shaded in gray) that may raise suspicion because funds are transferred from one account to another via many independent transaction chains. It is clear that accounts participating in what may turn out to be illegal transaction structuring may as well be engaged in other, probably harmless activities.
adapt to training data with respect not only to transaction and account parameters but also with respect to the graph structure. Proposed model represents subgraphs similar in structure to the graph presented in Figure 3.
- accounts - transactions Fig. 3. Fig. 2. Suspicious transaction graph connected with other, possibly legal activities. Vertex labels are account identifiers, edge labels contain number of transactions between the two accounts and the total amount transferred.
II. P ROPOSED
METHOD
Money laundering is hard to detect because the occurences are very infrequent in the graph of all transactions and individual bank transfers involved in a money laundering scheme are structured so that they appear as legitimate. These obstacles are especially hard to overcome if the detection process is based only on features of individual transactions. Therefore, graph mining methods seem to be interesting, because they can detect complex dependencies between transactions. It is also possible to take into account properties and relations of entities involved in sending and receiving the transfers. We present a method for graph structure learning using a model which can be trained on a previously annotated graph of transactions and then can be matched against a graph of unannotated transactions in order to select a number of transactions for a more thorough checking by human expert. This is in agreement with the mode of operation of financial watchdog institutions which employ experts to scrutinize suspicious transactions. Because of a huge number of transactions the work of an expert can be made significantly more efficient if a computer system is able to suggest a limited number of transactions to be checked for indications of possible money laundering. The results of the expert’s work may in turn be used to train the system again. The work presented in this paper is a part of a larger research project carried out at our Institute aimed at developing various money laundering detection methods. One of the research topics in this project is money laundering detection in data warehouses [3], [4]. Suspicious transactions discovered in data warehouses can be used as training data for the method described in this paper. As described in the introduction, organizational schemes involved in money laundering may vary to a great extent with respect to the number of transactions used to conceal the nature of the activity. Therefore, we propose a model which can
General structure of a detected subgraph
In order to model such subgraphs, hierarchical three-level patterns are generated. Some of the parameters of the model are polygonal fuzzy numbers [1]. They are denoted using the hat (ˆ) symbol. In the proposed method we use simplified polygonal fuzzy numbers which use only 6 real numbers x1 , x2 , x3 , x4 , m2 and m3 . Membership function µxˆ of such fuzzy number x ˆ is presented in Figure 4 and is calculated as follows: 0 x−x1 m2 · x2 −x1 µxˆ (x) = m2 + (m3 − m2 ) · −x m3 · xx44−x 3 0
x−x2 x3 −x2
for for for for for
x ≤ x1 , x ∈ (x1 , x2 ] , x ∈ (x2 , x3 ] , x ∈ (x3 , x4 ) , x > x4 . (1)
where: x ˆ = hx1 , x2 , x3 , x4 , m2 , m3 i - polygonal fuzzy number.
µ
m3 m2 x1 x2 Fig. 4. and m3
x3
x4
x
Polygonal fuzzy number with components x1 , x2 , x3 , x4 , m2
The lowest level of the model is a TR pattern that describes a single transaction: TR = hˆ a, r(·), s(·)i , where:
(2)
KRZYSZTOF MICHALAK, JERZY KORCZAK: GRAPH MINING APPROACH TO SUSPICIOUS TRANSACTION DETECTION
a ˆ—polygonal fuzzy number representing transaction amount, s(·)—function assigning weights to classes to which entities sending transfers belong, r(·)—function assigning weights to classes to which entities receiving transfers belong. The middle level is a SER pattern that describes transaction chains in which transactions are connected in series: ˆ , SER = hm, ˆ δi
(4)
where: n ˆ —polygonal fuzzy number representing the number of transactions in a chain, ˆ ∆—polygonal fuzzy number representing the ratio of the sum of amounts received by the receiving account to the sum of amounts sent from the sending account. τ —acceptance threshold used for deciding which transaction subgraphs match the pattern. A complete pattern contains one set of parameters for each of the three levels. Using such patterns, transaction subgraphs are evaluated in the following manner. First, weights are assigned to individual transfers using parameters of the TR pattern. A transfer T of amount a sent by an entity belonging to a class cs to an entity belonging to a class cr is assigned a weight wTR which is calculated as: wTR (T ) = µaˆ (a) · s(cs ) · r(cr ) ,
(5)
where: TR = hˆ a, s(·), r(·)i - pattern to which the transaction is matched, µaˆ (·)—membership function of the fuzzy number a ˆ. Transaction chains are evaluated using parameters of the SER pattern. A transaction chain L of length m in which the ratio of amount transferred in the last transaction to the amount transferred in the first transaction equals δ is assigned a weight wSER which is calculated as: wSER (L) =
P
T ∈L
wTR (T ) · µm ˆ (m) · µδˆ(δ) , m
T —transaction which belongs to the transaction chain L, µm ˆ ˆ (·)—membership function of the fuzzy number m, ˆ µδˆ(·)—membership function of the fuzzy number δ. Subgraphs consisting of parallel paths are evaluated using parameters of the PAR pattern. A subgraph P containing n parallel paths in which the ratio of the sum of amounts received by the receiving account to the sum of amounts sent from the sending account equals ∆ is assigned a weight wPAR which is calculated as:
(3)
where: m—polygonal ˆ fuzzy number representing the number of transactions in a chain, ˆ δ—polygonal fuzzy number representing the ratio of amount transferred in the last transaction to the amount transferred in the first transaction. The top level is a PAR pattern that describes parallel transaction chains (which are described by the SER pattern) ˆ τi , PAR = hˆ n, ∆,
71
(6)
where: ˆ - pattern to which the transaction chain SER = hˆ n, δi is matched, TR—pattern used to match individual transactions,
wPAR (P ) =
P
L∈P
wSER (L) · µnˆ (n) · µ∆ ˆ (∆) , n
(7)
where: ˆ τ i - pattern to which the transaction subPAR = hˆ n, ∆, graph is matched, SER - pattern used to match transaction chains, L - transaction chain which belongs to the subgraph P , µnˆ (·) - membership function of the fuzzy number n ˆ, ˆ µ∆ ˆ (·) - membership function of the fuzzy number ∆. The entire PAT pattern includes all the parameters required to match graph elements at each of three levels: PAT = hTR, SER, PARi ,
(8)
ˆn ˆ τi . PAT = hˆ a, r(·), s(·), m, ˆ δ, ˆ , ∆,
(9)
ˆ n ˆ can be described by Fuzzy parameters a ˆ, m, ˆ δ, ˆ and ∆ 6 real numbers each. Functions r(·) and s(·) have discrete domains and thus are adequately represented by discrete sets of weights. The entire PAT pattern is thus described by 31 + 2k real numbers, where k is the number of entity classes. Model parameters (31 + 2k real numbers describing a PAT pattern) have to be adjusted based on a training data set containing transactions annotated by an expert. For optimization of parameters of PAT patterns we propose to use a genetic algorithm with the following properties. Specimen—a set of 31 + 2k real numbers interpreted as PAT pattern parameters, Mutation—each of the 31 + 2k real numbers in each of the specimens is mutated with equal probability Pmut . Mutation of the numbers that represent fuzzy number components x1 , x2 , x3 and x4 is controlled by additional parameters ∆x , mx and Mx defined separately for each fuzzy ˆ n ˆ First, a random parameter of the model (i.e. a ˆ, m, ˆ δ, ˆ and ∆). value � drawn with uniform probability from the range � ∆x d∆is − 2 , 2x . Then, value of the component xi is modified by adding d. As this modification may disrupt the order of fuzzy number components x1 , x2 , x3 and x4 and may also lead to violation of constraints mx ≤ x1 and x4 ≤ Mx a check (and possibly also a correction) must be performed. This correction is performed as follows: • if x1 < mx then x1 ← mx • for i = 1, 2, 3 : if xi+1 ≤ xi then xi+1 ← xi + 0.001 • if x4 > Mx then x4 ← Mx • for i = 3, 2, 1 : if xi ≥ xi+1 then xi ← xi+1 − 0.001
72
PROCEEDINGS OF THE FEDCSIS. SZCZECIN, 2011
Mutation of the numbers that represent fuzzy number parameters m2 and m3 , weights assigned to entity classes and the value of acceptance threshold τ is performed by adding a value drawn with uniform probability from the range [−0.005, 0.005] and ensuring that the result is in the range [0, 1]. Selection—a standard roulette-wheel selection procedure [6] is used. Crossover—a standard single-point crossover operator [2] is used. Probability of a crossover being performed on any two specimens is controlled by the parameter Pcross . Evaluation function—the evaluation function for a given specimen S is calculated in the following way: • from the specimen S a pattern PAT (S) = hTR(S), SER(S), PAR(S)i is constructed using 31 + 2k real numbers as parameters, • a set P is constructed containing those subgraphs G that match the pattern PAT (S) and have a weight wPAR(S) (G) > τ , • for each subgraph G ∈ P a total number of transactions tn (G) in this subgraph and a sum of weights of transactions tw (G) in this subgraph are calculated. Weights of transactions are based on annotations made by the expert. For example, transactions annotated as ”illegal” may have a weight 1.0, transactions annotated as ”legal” a weight 0.0 and transactions annotated as ”not classified” a weight 0.1. • evaluation of the specimen is calculated as: P wPAR(S) (G) · tw (G) F (S) = G∈P P . (10) G∈P tn (G) The specimen (or specimens) achieving the highest values of evaluation function F may be used to identify suspicious transactions in previously unseen data. III. E XPERIMENTS For experiments training and testing data sets containing transactions annotated by an expert are required. Because such data sets are hard to obtain due to confidentiality of banking data, the experiments performed so far were based on artificially-generated data. In order to build a data set containing transactions similar to those encountered in real-life we used a model which represents transactions in a ”minieconomy” during a period of one year. In this model, three classes of economic entities are defined: companies, individual persons and offices (tax offices and social security offices). Economic entity classes are characterized by probability distributions which are used to generate parameters for instances belonging to each class. Companies are characterized by the following probability distributions: • distribution of the number of employees: N (mE , σE ), • distribution of salary: N (mS , σS ), • distribution of the number of goods sold per year: N (mG , σG ),
•
distribution of prices of goods: N (mP , σP ).
A predefined number of companies nc is generated. For each company a number of employees nE is drawn form the Gaussian distribution N (mE , σE ). Then, nE persons are added to the model. For each of the 12 months in a year a salary as is drawn form the Gaussian distribution N (mS , σS ) and a transaction representing the payment (with the amount as ) is generated. Next, buying of goods is simulated. For each company a number of goods sold during the simulated year nG is drawn form the Gaussian distribution N (mG , σG ). For each good a price ap is drawn form the Gaussian distribution N (mP , σP ). A buyer is selected at random from all employees of all companies and a new transaction (with the amount ap - a payment for the good) is added. Generation of offices is controlled by the parameters nT the number of tax offices and nF —the number of social security offices. Offices are also characterized by two probability distributions: • •
distribution of tax rate: N (mT , σT ), distribution of social security fee rate: N (mF , σF ).
One tax office and one social security office are assigned at random to each company. The sum of payments Cp received by the company for goods sold in each month is calculated and a tax rate αT is drawn form the Gaussian distribution N (mT , σT ). Tax amount aT is calculated as aT = Cp ·αT /100 and a transaction sent by the company to the tax office account is generated. Social security fee aF is calculated as aF = Cs · αF /100 based on the sum of salaries in each month Cs and a social security fee rate αF which is drawn form the Gaussian distribution N (mF , σF ). The steps described above produce a set of transactions representing the usual activities observed in economy. To this set of transactions nML money laundering schemes are added. Each of these schemes consists of a sender, a number nB of intermediaries and a receiver. Transfers are sent from the sender to one intermediary and then to the receiver. Each parallel path goes through one intermediary only, so nB parallel paths are created. The generation of the money lanundering schemes is characterized by the following probability distributions: •
•
•
distribution of the amount sent from the sender to one intermediary: N (mQ , σQ ), distribution of the number of intermediaries (equal to the number of parallel paths): N (mB , σB ), distribution of the fraction of the amount received by the intermediary that is forwarded to the receiver: N (m∆ , σ∆ ).
Generated transactions are annotated in the following manner: • •
•
legal—tax and social security fee transactions, illegal—transactions belonging to the generated money laundering schemes, unknown—all the remaining transactions (salaries and payments for goods).
KRZYSZTOF MICHALAK, JERZY KORCZAK: GRAPH MINING APPROACH TO SUSPICIOUS TRANSACTION DETECTION
Using data generation method descibed above, we have generated four data sets: SM ALLA, SM ALLB , LARGEA , LARGEB . All data sets were generated using the same parameters for offices: nT = 5, nF = 5, mT = 15, σT = 1.5, mF = 20, σF = 2.0. Also, parameters of money laundering were the same: mQ = 5000, σQ = 1000, mB = 40, σB = 10, m∆ = 1.0, σ∆ = 0.1. These data sets contain three classes of companies that can be briefly characterized as large (L), medium (M) and small (S). The SM ALL and LARGE data sets differ in the number of companies in each class. Parameters controlling generation of companies for data sets SM ALLA and SM ALLB and for data sets LARGEA and LARGEB are summarized in Tables I and II respectively. TABLE I PARAMETERS CONTROLLING GENERATION OF COMPANIES FOR DATA SETS SM ALLA AND SM ALLB
73
TABLE III T HE NUMBER OF ACCOUNTS AND TRANSACTIONS OF EACH TYPE IN EACH OF THE DATA SETS
Object type
Number of objects SM ALLA
SM ALLB
LARGEA
LARGEB
Accounts companies offices personal Transactions legal unknown illegal
11 238 31 10 11 197 294 972 744 289 336 4 892
11 401 31 10 11 360 383 463 744 377 207 5 512
19 261 110 10 19 261 2 854 965 2 640 2 848 435 3 890
21 270 110 10 21 150 2 625 671 2 640 2 619 049 3 982
annot. ratio
0.0191
0.0166
0.0023
0.0025
TABLE IV PARAMETERS CONTROLLING MUTATION OF xi
COMPONENTS OF FUZZY
NUMBERS
Parameter nC mE σE mS σS mG σG mP σP
Company class large
medium
small
2 000 000 000 500 000 000 50 10
4 500 100 5 000 1 200 1 000 300 500 100
25 50 20 4 000 1 000 100 30 500 100
5 1 6 1 100 30
TABLE II PARAMETERS CONTROLLING GENERATION OF COMPANIES FOR DATA SETS LARGEA AND LARGEB
Parameter nC mE σE mS σS mG σG mP σP
Company class large
medium
small
2 000 000 000 500 000 000 50 10
8 500 100 000 200 000 000 500 100
100 50 20 4 000 1 000 1 000 300 500 100
5 1 6 1 1 000 300
5 1 10 3
The number of accounts and transactions of each type in each of the data sets is summarized in Table III. In the experiments, one of data sets in a LARGE/SM ALL pair was used for training and the other one for testing. A population of Npop = 20 specimens was trained for Ngen = 20 generations of genetic algorithm. Crossover and mutation probabilities were set to Pcross = 0.1 and Pmut = 0.01 respectively. Parameters controlling mutation of xi components of fuzzy numbers are summarized in Table IV. Specimen evaluation requires that transaction annotations are converted to numerical weights. In the experiments a weight 1.0 was assigned to “illegal” transactions,
Fuzzy number
Parameter ∆x
a ˆ m ˆ δˆ n ˆ ˆ ∆
mx
Mx
200
range not limited xi not mutated, fixed at 0, 1, 2 and 3, only m2 and m3 are mutated 0.1 0.5 1.5 2 3 100 0.1 0.5 1.5
a weight 0.0 to transactions annotated as “legal” and a weight 0.1 to transactions annotated as “not classified.” Tests were performed in 10 independent iterations for each pair of SM ALL and LARGE data sets. In each iteration, after the training has been completed, the best specimen (with the highest value of the evaluation function) was selected from the population and it was used for selecting suspicious transaction subgraphs from the testing data set. Only one, the best specimen, was used, because we wanted to limit the number of transactions marked as suspicious. In the real-life environment, transactions marked as suspicious are reviewed by human expert which obviously imposes limitations on the number of transactions that can be processed. The number of transactions that were actually legal, illegal and of unknown status (according to annotations) was used to measure the quality of the detection. Results are summarized in Tables VVIII. During the experiments execution time of test iterations was recorded. Measured values are summarized in Table IX. A meaningful comparison of execution times is only possible for tests performed on the same machine. Therefore, only three tests that were performed on the same computer are included in the table. For comparison, the number of accounts and the number of transactions in each data set are also presented in the table.
74
PROCEEDINGS OF THE FEDCSIS. SZCZECIN, 2011
TABLE V T HE NUMBER OF ” LEGAL ”, ” NOT CLASSIFIED ” AND ” ILLEGAL ”
TABLE VII T HE NUMBER OF ” LEGAL ”, ” NOT CLASSIFIED ” AND ” ILLEGAL ”
TRANSACTIONS MARKED AS SUSPICIOUS IN THE EXPERIMENT WITH TRAINING DATA SET SM ALLA , TEST DATA SET SM ALLB AND EACH ITERATION PERFORMED INDEPENDENTLY. P ERCENTAGE OF ” NOT CLASSIFIED ” TRANSACTIONS AMONG TRANSACITONS MARKED AS SUSPICIOUS : 15.98%
TRANSACTIONS MARKED AS SUSPICIOUS IN THE EXPERIMENT WITH TRAINING DATA SET LARGEA , TEST DATA SET LARGEB AND EACH ITERATION PERFORMED INDEPENDENTLY. P ERCENTAGE OF ” NOT CLASSIFIED ” TRANSACTIONS AMONG TRANSACITONS MARKED AS SUSPICIOUS : 27.05%
Iteration 1 2 3 4 5 6 7 8 9 10 TOTAL
Iteration
Number of transactions legal
unknown
illegal
0 0 0 0 0 0 0 0 0 0 0
0 9 8 0 0 0 0 11 7 0 35
26 9 8 30 26 26 46 11 7 30 219
1 2 3 4 5 6 7 8 9 10 TOTAL
Number of transactions legal
unknown
illegal
0 0 0 0 0 0 0 0 0 0 0
10 11 0 0 9 0 0 0 12 24 66
10 11 22 22 9 24 22 22 12 24 178
TABLE VI T HE NUMBER OF ” LEGAL ”, ” NOT CLASSIFIED ” AND ” ILLEGAL ”
TABLE VIII T HE NUMBER OF ” LEGAL ”, ” NOT CLASSIFIED ” AND ” ILLEGAL ”
TRANSACTIONS MARKED AS SUSPICIOUS IN THE EXPERIMENT WITH TRAINING DATA SET SM ALLB , TEST DATA SET SM ALLA AND EACH ITERATION PERFORMED INDEPENDENTLY. P ERCENTAGE OF ” NOT CLASSIFIED ” TRANSACTIONS AMONG TRANSACITONS MARKED AS SUSPICIOUS : 13.88%
TRANSACTIONS MARKED AS SUSPICIOUS IN THE EXPERIMENT WITH TRAINING DATA SET LARGEB , TEST DATA SET LARGEA AND EACH ITERATION PERFORMED INDEPENDENTLY. P ERCENTAGE OF ” NOT CLASSIFIED ” TRANSACTIONS AMONG TRANSACITONS MARKED AS SUSPICIOUS : 21.05%
Iteration 1 2 3 4 5 6 7 8 9 10 TOTAL
Number of transactions legal
unknown
illegal
0 0 0 0 0 0 0 0 0 0 0
10 0 10 0 0 0 0 10 9 0 39
10 34 10 30 32 36 34 11 9 36 242
IV. C ONCLUSION In this paper we presented a graph mining method intended for detection of suspicious transactions. Contrary to data mining methods based solely on transaction features the method proposed in this paper takes into consideration those dependencies between individual transfers that may be indicative of illegal activities. We expect this feature to be a significant advantage, because single transactions are often tailored by criminals in order to be as innocent-looking as possible. Results of the experiments suggest that the method proposed in the paper has several advantageous properties: • in the experiments the proposed method managed to avoid marking as suspicious of any transactions that were annotated as ”legal”. Although it is not clear at this point to what extent this quality will persist in the case of other data sets, this is a desirable behaviour for a suspicious transaction detection method;
Iteration 1 2 3 4 5 6 7 8 9 10 TOTAL
Number of transactions legal
unknown
illegal
0 0 0 0 0 0 0 0 0 0 0
0 9 0 9 0 10 0 0 10 10 48
26 9 28 9 28 10 24 26 10 10 180
more than 2/3 of transactions marked as suspicious were actually involved in money laundering schemes; • as shown in Table IX computation time doubled with the similar—twofold increase in the number of accounts. The difference in transaction number between the same two data sets was about 10 times. This is beneficial, because the volume of transactions in historic record increases more rapidly than the number of bank customers; The fact that the proposed method did not mark any legal transactions as suspicious is promising. It is easy to understand that reporting transactions which are considered legal by human experts most probably means raising a false alarm. A much harder question is, how large percentage of transactions that are unannotated by human expert (or annotated as ”not classified”) should be marked as suspicious by the algorithm, In the case of artificial data used in this paper it is obvious that all ”not classified” transactions were, •
KRZYSZTOF MICHALAK, JERZY KORCZAK: GRAPH MINING APPROACH TO SUSPICIOUS TRANSACTION DETECTION
TABLE IX E XECUTION TIME ( IN SECONDS ) OF TEST ITERATIONS . A LL TESTS PRESENTED IN THE TABLE WERE PERFORMED ON THE SAME MACHINE .
Training data set accounts transactions Test data set accounts transactions Iteration 1 time Iteration 2 time Iteration 3 time Iteration 4 time Iteration 5 time Iteration 6 time Iteration 7 time Iteration 8 time Iteration 9 time Iteration 10 time Average time
SM ALLB 11 401 383 463 SM ALLA 11 238 294 972 1 108 1 191 1 197 1 126 1 162 1 156 1 189 1 166 1 185 1 172 1 165
LARGEA 19 261 2 854 965 LARGEB 21 270 2 625 671 2 110 2 088 2 027 2 146 2 109 2 116 2 060 2 130 2 128 2 075 2 099
LARGEB 21 270 2 625 671 LARGEA 19 261 2 854 965 2 204 2 119 2 067 2 098 2 173 2 165 2 451 2 141 2 409 2 096 2 192
in fact, legal. Therefore, the percentage of ”not classified” transactions among transacitons marked as suspicious can be interpreted as a false positive ratio. In real-life scenario, however, some of the ”not classified” transactions contained in the training data set will actually be illegal (i.e. involved in a money laundering schemes) because it is never possible to identify all illegal activities. Nevertheless, statistically, most of the ”not classified” transactions are legal. It is thus hard to decide at this point, to what extent the learning model should be trained to avoid reporting transactions similar to ”not classified” examples from the training set. Further work may concern improving the precision of the detection (in order to avoid too many legal transactions being submitted to human experts for evaluation) but also improving the completness of the results (ensuring that as many illegal transactions as possible are marked as suspicious). Also, improvement in computational speed may be important, especially because computation time may be a factor limiting the possibility of searching for more complex subgraph patterns. In order to achieve the above mentioned goals further work may be conducted in some of the following directions: • training a population of positive and negative patterns. Currently, specimens represent only such patterns that identify suspicious subgraphs. Learning patterns that represent legal transaction subgraphs may help in reducing the false positive ratio; • using decision rules designed by experts to improve detection quality. Apart from knowledge extracted from annotated graphs, rules, for example excluding tax transfers from suspicion, may help in reducing the search space that must be processed; • interacting with human expert, for example using the number of transactions confirmed by the expert to be
illegal as a criterion in model training. Another possibility is to allow the expert who uses the system to adjust some parameters by hand. For example, parameters controlling fuzzy number mutation (∆x , mx and Mx ) may be tuned in order to ensure that the model obtained during training satisfies certain constraints; • using Genetic Multi-Objective Optimization (GMOO) in order to balance conflicting requirements (maximizing the number of detected frauds, but at the same time limiting the number of transactions suggested for review by human expert); • implementing computationally-intensive parts of the algorithm (for example, evaluation function calculation) using CUDA architecture in order to take advantage of massive parallelism available on modern GPUs; • allowing more complex subgraph patterns to be used. One of the possible approaches can be to implement evolving graph structure (not only evolutionary optimization of subgraph model parameters); • alternative methods for searching for matching subgraphs. Currently all matching subgraphs are evaluated at each level of the hierarchical pattern. Using non-deterministic methods may be hard to avoid, especially if more complex subgraph patterns will be used. Another important aspect of further research is to obtain real-life data from financial instututions and test the proposed method on such data. R EFERENCES [1] Th. Fetz, J. Jager, D. Koll, G. Krenn, H. Lessmann, M. Oberguggenberger and R. Starkm “Fuzzy Models in Geotechnical Engineering and Construction Management” Computer-Aided Civil and Infrastructure Engineering, vol. 14, no. 2, pp. 93–106, 1999. [2] O. Hasancebi and F. Erbatur, “Evaluation of crossover techniques in genetic algorithm based optimum structural design” Computers & Structures, vol. 78, no. 1-3, pp. 435–448, 2000. [3] J. Korczak, W. Marchelski and B. Oleszkiewicz, “A New Technogical Approach to Money Laundering Discovery using Analytical SQL server,” in: Advanced Information Technologies for Management AITM 2008, J. Korczak, H. Dudycz and M. Dyczkowski (eds.) Research Papers no. 35, pp. 80-104, Wroclaw University of Economics, 2008. [4] J. Korczak, B. Oleszkiewicz, “Modelling of Data Warehouse Dimensions for AML Systems,” in: Advanced Information Technologies for Management AITM 2009, J. Korczak, H. Dudycz and M. Dyczkowski (eds.) Research Papers no. 85, pp. 146-159, Wroclaw University of Economics, 2009. [5] E. M. Truman and P. Reuter, “Chasing Dirty Money: The Fight Against Anti-Money Laundering”, Peterson Institute for International Economics, 2004 [6] J. Zhong, X. Hu, J. Zhang and M. Gu, “Comparison of Performance between Different Selection Strategies on Simple Genetic Algorithms,” in: Proceedings of the International Conference on Computational Intelligence for Modelling, Control and Automation and International Conference on Intelligent Agents, Web Technologies and Internet Commerce Vol-2 (CIMCA-IAWTIC’06) - Volume 02, pp. 1115–1121, IEEE Computer Society, 2005. [7] “Debit and Credit Card fraud requires vigilance” http://www. moneyreview.com.au/debit-and-credit-card-fraud-requires-vigilance/ [8] “Reserve Bank of Australia - Payments Data” http://www.rba.gov.au/ payments-system/resources/statistics/index.html [9] “Russia reports $3.8 trillion in suspect transfers: report,” http://www.reuters.com/article/2010/12/06/us-russia-economy-moneyidUSTRE6B516Z20101206
75