Knowledge Extraction and Recurrent Neural Networks: An Analysis of an Elman Network trained on a Natural Language Learning Task Ingo Schellhammer*#, Joachim Diederich*, Michael Towsey*, Claudia Brugman** * Neurocomputing Research Centre, Queensland University of Technology, QLD, 4001, Australia # Dept of Information Systems, University of Muenster, D-48149 Muenster, Germany **School of Languages, University of Otago, New Zealand
[email protected] In this paper we focus on the extraction of grammatical rules from trained Artificial Neural Networks and, in particular, Elman-type recurrent networks (Elman, 1990). Unlike Giles & Omlin (1993 a,b) who used an ANN to simulate a deterministic Finite State Automaton (FSA) representing a regular grammar, we have extracted FSA’s from a network trained on a natural language corpus. The output of k-means cluster analysis is converted to state-transition diagrams which represent the grammar learned by the network. We analyse the prediction and generalisation performance of the grammar.
Abstract We present results of experiments with Elman recurrent neural networks (Elman, 1990) trained on a natural language processing task. The task was to learn sequences of word categories in a text derived from a primary school reader. The grammar induced by the network was made explicit by cluster analysis which revealed both the representations formed during learning and enabled the construction of state-transition diagrams representing the grammar. A network initialised with weights based on a prior knowledge of the text’s statistics, learned slightly faster than the original network.
2. Methods 1. Introduction Since their renaissance in the mid-1980s, Artificial Neural Network (ANN) techniques have been successfully applied across a broad spectrum of problem domains such as pattern recognition and function approximation. However despite these capabilities, to an end user an ANN is an arcane web of interconnected input, hidden, and output units. Moreover an ANN solution manifests itself entirely as sets of numbers in the form of activation function parameters and weight vectors. As such a trained ANN offers little or no insight into the process by which it has arrived at a given result nor, in general, the totality of "knowledge" actually embedded therein. This lack of a capacity to provide a "human comprehensible" explanation is seen as a clear impediment to a more widespread acceptance of ANNs. In order to redress this situation, recently considerable effort has been directed towards providing ANNs with the requisite explanation capability. In particular a number of mechanisms, procedures, and techniques have been proposed and developed to extract the knowledge embedded in a trained ANN as a set of symbolic rules which in effect mimic the behaviour of the ANN. A recent survey conducted by Andrews et al. (1995) offered an insight into the modus operandi of a broad cross-section of such techniques.
Schellhammer, Diederich, Towsey and Brugman
73
2.1.
The data
The data for these experiments were obtained from a first-year primary school reader published circa 1950’s (Hume). To keep this initial task simple, sentences with embedded structures (relative clauses) and a length of more than eight words were eliminated. The resulting corpus consists of 106 sentences ranging from three to eight words in length, average length 5.06 words. The words were converted to 10 lexical categories, including a sentence boundary marker. The categories, their abbreviations as used in the text and their percent frequencies are shown in Table 1. The resulting data consist of a string of 643 categories in 106 sentences. There are 62 distinct sentence sequences of which 43 occur only once, the rest being replicated. The maximum replication of any sequence is eight-fold. Where sequences, such as PR,VB,AR, are referred to in the text, AR is the current input, VB the previous input (at time step t-1) and PR the input at time step t-2.
2.2.
The network
Elman simple recurrent networks (SRN), with ten input and ten output units representing the sparse coded lexical categories, were trained on the category sequence. The task was to predict the next lexical category given the current category.
Knowledge Extraction and Recurrent Neural Nets
Ingo Schellhammer, Joachim Diederich, Michael Towsey and Claudia Brugman (1998) Knowledge Extraction and Recurrent Neural Networks: An Analysis of an Elman Network trained on a Natural Language Learning Task. In D.M.W. Powers (ed.) NeMLaP3/CoNLL98: New Methods in Language Processing and Computational Natural Language Learning, ACL, pp 73-78.
The networks were trained by standard backpropagation with momentum and state unit activations were NOT reset to zero on presentation of a sentence boundary. Two networks were trained, one having two hidden units and the other nine, until prediction error stopped declining. The network with two hidden units had learned 51% of the training data and that with nine hidden units had learned 69% of the data. By way of comparison, 48%, 62%, 72% and 76% correct predictions could be obtained using bi-, tri-, 4and 5-gram models of the training data respectively. At the end of training, the networks performed one pass through the data without learning in order to recover their hidden unit activations. Cluster analysis of the 642 output vectors was performed by graphical means for the two-hidden unit case and by k-means clustering for the nine-hidden unit case. Clusters from the latter case were used to prepare FSA’s.
AR CC IN JJ NN PR PS RB VB /S
2.4. Weight Initialisation with Domain Knowledge From an examination of bigram probabilities derived from the data sequence, it was determined that output categories NN and /S have the highest predictive rate. This knowledge can be used to initialise an Elman network with non-random weights in the expectation that training error should decline more rapidly than if the all the weights are initialised randomly. We initialised an Elman net having 11 hidden units with random weights between –0.1 and 0.1, and then manually set to a value of +4.0 some of the weights linking the hidden layer to the input units coding for NN and /S. We refer to these as the set links. In different trials, we set 0, 1, 5, 8, or 11 of both the NN and /S links in such a way as to minimise the number of hidden units having two set links. Zero set links means that none of the original random weights were changed.
TABLE 1: Percent frequencies of the ten lexical categories in the text. Lexical Category % frequency Article Conjunction Preposition Adjective Noun Pronoun Possessive (‘s) Adverb Verb Sentence boundary
(v) Each automaton was tested on the string of 643 categories used to train the original network. They were scored for total correct predictions, the fraction of missing transitions and score on the non-missing transitions. (vi) In some experiments, low frequency transitions (having less than 5 occurrences) were pruned from the automaton and the resulting automaton again tested for its performance on the original data sequence. Missing transitions were handled by jumping to a predefined ‘rescue’ state and producing a predefined ‘rescue’ output. In the default instance, the rescue state was the state, whose preceding inputs had earliest position in the sentence. The rescue output was always NN, the category having highest frequency.
8% 1% 7% 4% 30% 10% 2% 1% 20% 17%
2.3. Cluster Analysis and Preparation of Finite State Automata
3. Results
(i) K-means cluster analysis software was used to label the 642 hidden unit activation vectors with cluster numbers between 1 and k. Each vector was thus
3.1. Graphical cluster analysis network having two hidden units.
assigned to a state, S ti , where 1 ≤ i ≤ k and t uniquely identifies the time step for each member of cluster i. (ii) For every current input, xt and previous state, S ti −1 , there is a transition to a new state, S ti with a resulting output, ot. A transition table was created from this data. (iii) If the same input lead to more than one transition from a given state, the transition having highest frequency was chosen. Similarly, if any transition brought about by a given input, generated more than one possible output, the most frequent output was chosen. (iv) The transition rules so derived were used to construct deterministic FSA’s having k states corresponding to the k clusters. We generated ten FSA’s with k taking values in the range 6 to 22.
Schellhammer, Diederich, Towsey and Brugman
74
of the
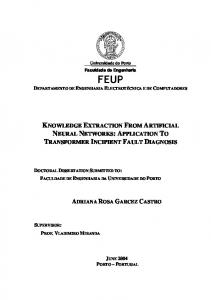
Graphical cluster analysis for the 2-hidden unit case is shown in Figure 1. Clusters are labeled with the current input. There is marked separation of clusters representing the high frequency inputs, NN, VB, /S, PR and IN. There is overlap of those clusters representing low frequency inputs. Although only 51% of the training set was learned by the network, there is evidence of further clustering based on the current and previous inputs. For example, Figure 2 shows cluster formation when NN is the current input and either AR, NN, PR, PS, VB or /S is the previous input. The PR,NN sub-cluster could be further broken down into sub-subclusters, representing the three input sequences /S,PR,NN and IN,PR,NN and VB,PR,NN.
Knowledge Extraction and Recurrent Neural Nets
1
Unit 2
0.8 0.6 0.4 0.2 0 0
0.2
0.4
0.6
0.8
1
Unit 1
AR CC IN JJ NN PR PS RB VB /S
Figure 1: Hidden unit activations (of an Elman network with two hidden units) labeled according to which of the ten input categories is the current input producing that activation. The activations tend to be clustered according to the input. Clusters representing high frequency categories such as NN, VB and /S are more dispersed and broken into sub-clusters that represent both the current and previous inputs. VB,NN
0.5
/S,NN
unit 2
0.4
AR,NN /S,PR,NN
0.3
PS,NN NN,NN
0.2
VB,PR,NN
0.1
IN,PR,NN
0 0
0.2
0.4
0.6
0.8
1
unit 1
Figure 2: Hidden unit activations of an Elman network (with two hidden units only) when the current input category is NN and the previous category is either VB, /S, AR, PR, PS or NN.
3.2.
Analysis of the FSA’s
The performance of FSA’s having 6 to 22 states is displayed in Table 2. The second column gives the total number of transitions permitted by the FSA. The third column gives the percent prediction score on the training data. Best score is 60% which compares with 69% of the training data learned by the original Elman network from which the hidden unit activations were obtained. The total prediction score tends to increase with the number of states. The fourth column of Table 2 gives the percentage of the 642 transitions in the data not permitted by the FSA’s. The number of missing transitions is small, in all
Schellhammer, Diederich, Towsey and Brugman
75
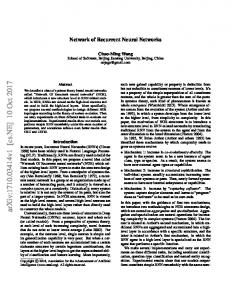
but two cases less than 2%. When a missing transition occurs, the FSA defaults to a ‘rescue’ state. The percent correct predictions for non-missing transitions are shown in the rightmost column of Table 2. They are little different from the total scores in most cases, simply because the number of missing transitions is so few. The transition diagram for the 8-state FSA is shown in Figure 3. The table in the top right of the figure shows: (i) the number of visits to each state when the FSA is tested, (ii) the percentage of correct predictions associated with a transition to that state and (iii) the average word-position in the sentence of the inputs leading to that state.
Knowledge Extraction and Recurrent Neural Nets
P R /N N V B /IN
S3
P R /V B S /N N
S1
V B /N N V B /V B
N N /P S
sta te
fr e q .
% correct
p o s i ti o n
S1 S2 S3 S4 S5 S6 S7 S8
152 96 155 42 34 64 53 46
5 5 .9 2 % 8 6 .4 6 % 4 9 .6 8 % 8 3 .3 3 % 7 0 .5 9 % 7 9 .6 9 % 9 2 .4 5 % 8 6 .9 6 %
1 .3 0 3 .0 6 3 .3 5 4 .3 8 5 .5 0 5 .6 7 5 .6 8 6 .4 6
N N /V B
S2
J J /N N A R /N N
I N /A R N N /S
P S /N N
J J /N N
S4
A R /N N P R /N N
S7
S8 N N /S
N N /S
S6
S5
I N /N N
I N /A R
Figure 3: The FSA having 8 states. The double circle indicates an accept state. If the FSA is in an accept state and the input is /S (end of sentence) then it returns to the start state, S1, with the output of NN.
Transitions with thick arrows have a frequency count >20, transitions displayed with thin arrows have a frequency count of 5 to 20 and transitions with a frequency count