Available online at www.sciencedirect.com
ScienceDirect Procedia - Social and Behavioral Sciences 174 (2015) 4026 – 4031
INTE 2014
Least square support vector machine and minumum redundacy maximum relavance for diagnosis of breast cancer from breast microscopic images Sevcan Aytac Korkmaza, Mustafa Poyrazb a b
Engineering Faculty, Department of Electrical-Electronic Engineering, Firat University,23100, ElazÕ÷, Turkey Engineering Faculty, Department of Electrical-Electronic Engineering, Firat University,23100, ElazÕ÷, Turkey
Abstract In these days, there are many various diseases, whose diagnosis is very hardly. Breast cancer is one of these type diseases. In this study, the aim is to determine cancerous lesions taken from light microscopic. Here, totally 180 that be 3x60 breast microscopic images set are taken from FÕrat University Medicine Faculty Pathalogy Laboratuary. In this study, 23 features are used. These features are totally obtained 92 (23x4) features by rotating for variety angles (i.e., breast microscopic images. In this paper, new method is found. This method are called as Minimum Redundancy Maximum Relavance_Least Square Support Vector Machine (mRMR_LSSVM). In this study, the structure of this method composes from three steps. These are feature select step, classification step and testing stage. In feature select step have found optimal feature subset using minimum redundancy and maximum relevance via mutual information (mRMR). In classification step is used LSSVM. For validation of the proposed method is found the accuracy rate. This accuracy rate, with (mRMR_LSSVM). was obtained %100 in breast microscopic images. © 2015 The Authors. Published by Elsevier Ltd. This is an open access article under the CC BY-NC-ND license © 2014 The Authors. Published by Elsevier Ltd. (http://creativecommons.org/licenses/by-nc-nd/4.0/). Peer-reviewunder underresponsibility responsibility of the Sakarya University. Peer-review of the Sakarya University Keywords :Breast microscopic images; Least square support vector machine; minimum redundancy and maximum relevance
* Corresponding author: Tel.: 05067927759 E-mail address:
[email protected]
1877-0428 © 2015 The Authors. Published by Elsevier Ltd. This is an open access article under the CC BY-NC-ND license (http://creativecommons.org/licenses/by-nc-nd/4.0/).
Peer-review under responsibility of the Sakarya University doi:10.1016/j.sbspro.2015.01.1150
Sevcan Aytac Korkmaz and Mustafa Poyraz / Procedia - Social and Behavioral Sciences 174 (2015) 4026 – 4031
4027
1. Introduction Breast cancer is one of the cancers, which is frequently encountered in women, and it is the second major cause of death after lung cancer (Ferlay et. al, 2007). However, early diagnosis decreases mortality rate up to 41% (Roder et. al, 2008). Early stage detection and treatment results in a 98% survival rate, however this plummets to 27% if metastases have spread to distant organs (American Cancer Society, 2009). Today early cancer diagnosis cannot be achieved exactly. Even though there are lots of studies realized on breast cancer diagnosis, required result cannot be obtained (Roder et. al, 2008). For this reason, multi-modality solutions may be developed by means of information such as thermography, radiography, mammography, histology images and electrical and mechanical features of cells, etc. Thus, requirement of classifying the histology and mammography images available comes out with the aid of algorithms developed in the computer environment. In this study, total 180 (3x60) breast microscopic images have been examined, which are specified as 60 normal (nm), 60 benign (bm) and 60 malign (mm). Then mutual information based maximum relevance and minimum redundancy algorithm is utilized to select some of effective features (C. Ding et. al, 2003). Breast microscopic images are determined from FÕrat University Medicine Faculty Pathology Laboratuary. Features of breast microscopic images have been selected by m(RMR). Breast microscopic images are classified as normal, benign and malign with, mRMR_LSSVM method. Invasive breast cancers are a heterogeneous group of tumours that show a wide variation with regard to their clinical presentation, behaviour, and morphological spectrum. At least 18 different histological breast cancer types (ie pathological entities) are described by the World Health Organization (WHO). Invasive ductal carcinoma not otherwise specified (IDC NOS) accounts for the large majority of breast cancers (50–80%). IDC NOS is a diagnosis by default, being defined by the WHO as a tumour that fails to exhibit sufficient morphological characteristics to be classified into one of the histological special types. Approximately 25% of invasive breast cancers are recognized as ‘special types’, and characterized by distinctive growth patterns and cytological features (Lee, et. al, 2003). In one study, classification based on subdivisions of a whole slide image containing a high concentration of cancer cell nuclei consistently agreed with the grade classification of the entire slide (Weigelt, et. al, 2008). In another study, A prospective study of the Doppler color flow features of 55 proved breast cancers was performed. On a three-level scale of low to marked vascularity, visual assessment of the color flow images classified 82% of the cancers as moderately or markedly vascular (minimal: 14%, moderate: 29%, marked: 53%) (Weigelt, et. al, 2008). The minimum redundancy maximum relevance for feature select is proposed in Section 2. The structure of LSSVM for classifier is given in Section 3. Experimental results and Discussions of method mRMR_LSSVM is introduced in Section 4. Accurcy rate is given Section 5. Finally, the conclusion is presented in Section 6, respectively. 2. Selection based on Mutual Information with Max-Relevance and Min-Redundancy Table 1 includes all the features examined. Using feature selection based mutual information algorithm, subset features can be selected from features space. Table 1. List of features used to represent breast cancer histology images Ftr No f1 f2 f3 f4 f5 f6 f7 f8 f9 f10 f11 f12
Feature (Ftr) Name
Autocorrelation Correlation1 Correlation2 Dissimilarity Cluster prominence Cluster shade Sum variance Sum average Sum entropy Homogeneity1 Homogeneity2 Maximum probability
Ftr No f13 f14 f15 f16 f17 f18 f19 f20 f21 f22 f23
Feature (Ftr) Name Sum of squares Energy Entropy ønverse difference Moment Difference variance Contrast Local homogeneity Cluster shade Inverse diff. normalized Inverse diff. moment normalized Difference Entropy
4028
Sevcan Aytac Korkmaz and Mustafa Poyraz / Procedia - Social and Behavioral Sciences 174 (2015) 4026 – 4031
Mutual information (C. Ding et. al, 2003) between fi and ci can be given by (3)
Then max relevance is represented as (4)
And then minumum redundancy is given in (5)
Fusing the above two constraints we can get “minimum-Redundancy-Maximal-Relevance” m(RMR) criterion as (6)
where is mutual information values between individual feature fi and class c; c is target class ; near-optimal features.
is the
3. Least Squares Support Vector Machine (LSSVM) The standard LS-SVM algorithm was introduced as follows. Assume a set of training set is given like , with the input and the output The following regression model is constructed by using nonlinear mapping function , which maps the input data to a higher dimensional feature space: (7)
where w is the weight vector and b is the bias term. As in SVM, it is necessary to minimize a cost function C containing a penalized regression error, as follows: (8)
subject to the constraints (9)
where r is the regularization parameter which balances the model’s complexity and the training errors, and the random errors. And then, Lagrange function is adopted to solve this optimization problem. L
is (10)
where is Lagrange multipliers called support value. The solution of the above equation can be obtained by partially differentiating with respect to each variable
,
Sevcan Aytac Korkmaz and Mustafa Poyraz / Procedia - Social and Behavioral Sciences 174 (2015) 4026 – 4031
4029
(11)
and
(12)
where is the kernel function, and must follow Mercer’s theory. The common examples of kernel function contain linear, polynomial, radial basis function (RBF) kernel and multi-layer perceptron (MLP). In our work, RBF kernel was selected as the kernel function as /
(13)
The LS-SVM regression model can be obtained as (14)
When using SVM or LS-SVM, there are three crucial problems need to be solved, namely, the determination of the optimal input feature subset, proper kernel function, and the best kernel parameters. However, no systematic methodology is available for a prior selection of kernel function. In this paper, RBF kernel was used as the kernel function of LS-SVM, as it was a nonlinear function and a more compact supported kernel, and could reduce the computational complexity of the training procedure while giving good performance under general smoothness assumptions. Proper parameter setting plays a crucial role in building a good LS-SVM regression model with high prediction accuracy and stability. We employed Grid search Technique and Leave One Out Cross-Validation to find out the optimal parameter values, namely, regularization parameter gam (c) and the RBF kernel function parameter sig2 (r2) which is the bandwidth in the case of the RBF kernel. Grid search is a two-dimensional minimization procedure based on exhaustive search in a limited range. In each iteration, one leaves one point, and fits a model on the other data points. The performance of the model is estimated based on the point left out. This procedure is repeated for each data point. Finally, all the different estimates of the performance are combined. The assumption is made that the input data is distributed independent and identically over the input space (Pelckmans et. al, 2003). [Pelckmans].
4. Accuracy Rate For mRMR_LSSVM Method Accuracy rate founded for breast microscopic images with mRMR_LSSVM are as
Accuracyhis=
(19)
where i is number testing images. c is types that should be of images. Accuracyhis is accuracy rate for breast microscopic images. 5. Experimental results and Discussions of mRMR_LSSVM method For implementation of mRMR_LSSVM methods for diagnosis of breast cancer from breast microscopic images, we taken breast microscopic images from Firat University Medicine Faculty Pathology Laboratuary. These breast
4030
Sevcan Aytac Korkmaz and Mustafa Poyraz / Procedia - Social and Behavioral Sciences 174 (2015) 4026 – 4031
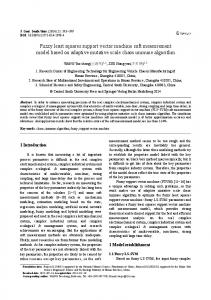
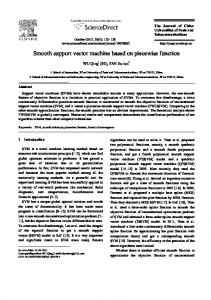
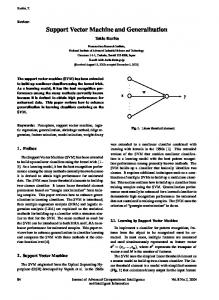
microscopic images which are normal breast microscopic (nbm), benign breast microscopic (bbm), and malign breast microscopic (mbm) are given in Fig.1 (a), (b), (c). mRMR_LSSVM for diagnosis of Breast Cancer from breast microscopic images is offered. Some of samples out of totally 180 (3x60) breast microscopic images are given in Fig. 1.
(a)
(b)
(c)
Fig.1. Examples for (a) normal breast microscopic (nbm1), (b) benign breast microscopic (bbm1) and (c) malign breast microscopic (mbm1) of breast cancer These breast microscopic images are used for 90 training and 30 testing. So, 30nhis, 30bhis and 30 mhis are used for training. 30nhis, 30bhis and 30mhis are used for testing. In this study, 23 features are used. These features are totally obtained 92 (23x4) features by rotating for variety angles (i.e., 0°,45°,90°,135°) breast microscopic images given in the Fig 1. From these 92 features, for each of normal, benign and malign breast microscopic images are selected 10 features using mutual information based maximum relevance and minimum redundancy. Breast microscopic images are classified as normal, benign, and malign. Afterwards, of the breast microscopic images, whether or not it is normal, benign or malign, are found using mRMR_LSSVM method. mRMR_LSSVM method are founded accuracy rate %100 in breast microscopic images. Table 2.The diagnosis achievement results obtained by mRMR_LSSVM method Accuracy Diagnosis (%) Test Results
nmam
bmam
mmam
mRMR_LSSVM
TN=30 FP=0
TP=30 FN=3
TP=30 FN=0
Accuracymam %100
6. Conclusion So far, in every field of health have been made different studies. And many systems have been developed (A. ùengür, 2008). In this work, total 180 are used breast microscopic images. These images are used for 90 training and 90 testing. So, 30nhis, 30bhis and 30 mhis are used for training. 30nhis, 30bhis and 30mhis are used for testing taken from FÕrat University Medicine Faculty Pathalogy Laboratory. These breast microscopic images are used for 90 training and 90 testing. As feature selection method have used minimum redundancy and maximum relevance via mutual information (mRMR). In this paper, new method are found. This method are called as Minimum Redundancy Maximum Relavance_Least Square Support Vector Machine (mRMR_LSSVM). This method is found to be as good as the previous classification techniques. As a next step to mammography and histology images taken
Sevcan Aytac Korkmaz and Mustafa Poyraz / Procedia - Social and Behavioral Sciences 174 (2015) 4026 – 4031
4031
from the same patient could participate atomic force microscopic images. Thus, a cancer diagnosis can be made more powerful. References Ferlay, J., Autier, P., Boniol, M., Heanue, M., Colombet, M., & Boyle, P., "Estimates of the cancer incidence and mortality in Europe, " Annals of oncology, 18(3), 581-592, 2007. Roder, D., Houssami, N., Farshid, G., Gill, G., Luke Downey, P., "Population screening and intensity of screening are associated with reduced breast cancer mortality: Evidence of efficacy of mammography screening in Australia, " Breast Cancer Research and Treatment, 108(3), 409–416, 2008. American Cancer Society, "Global cancer facts and figures, " Atlanta:American Cancer Society, Inc, 2009b. Birdwell, R., Bandodkar, P., & Ikeda, D., "Computer-aided detection with screening mammography in a university hospital settings," Radiology, 236,451–457, 2005. Jemal, A., Bray, F., Center, M. M., Ferlay, J., Ward, E., & Forman, D., "Global cancer statistics, " CA: a cancer journal for clinicians, 61(2), 6990, 2011. Petushi, S., Garcia, F. U., Haber, M. M., Katsinis, C., & Tozeren, A."Large-scale computations on histology images reveal grade-differentiating parameters for breast cancer." BMC Medical Imaging 6.1. 2006. Lee, Kyoung-Mi, and William Nick Street. "An adaptive resource-allocating network for automated detection, segmentation, and classification of breast cancer nuclei topic area: image processing and recognition." Neural Networks, IEEE Transactions on 14.3 (2003): 680-687. Weigelt, B., Horlings, H. M., Kreike, B., Hayes, M. M., Hauptmann, M., Wessels, L. F. A., ... & Peterse, J. L. "Refinement of breast cancer classification by molecular characterization of histological special types." The Journal of pathology 216.2 (2008): 141-150. Weigelt, B., et al. "Refinement of breast cancer classification by molecular characterization of histological special types." The Journal of pathology 216.2 (2008): 141-150. C. Ding and H.C. Peng, “Minimum redundancy feature selection from microarray gene expression data,” Proc. Second IEEE Computational Systems Bioinformatics Conf. pp. 523-528, 2003 Pelckmans, K., Suykens, J. A. K., Van Gestel, T., De Brabanter, J.,Lukas, L., Hamers, B. et al. (2003). LS-SVMlab Toolbox User’s Guide(version1.5).http://www.esat.kuleuven.ac.be/sista/lssvmlab/tutorial. R.O. Duda, P.E. Hart, Pattern Classification and Scene Analysis, Wiley,New York, 1973. J.M. Keller, M.R. Gray, J.A. Givens Jr., A fuzzy k-nearest neighbor algorithm, IEEE Trans. Syst. Man Cybern 15 (4) (1985) 580–585. A. ùengür, “An expert system based on principal component analysis, artificial immune system and fuzzy k-NN for diagnosis of valvular heart diseases” Computers in Biology and Medicine 38 (2008) 329 – 338.