Model-Based Parameter Estimation in Electromagnetics: Part I. Background and Theoretical Development' Edmund K. Miller 3225 Calle Celestial Santa Fe,NM 87501-9613 Tel: and Fax: (505) 820-7371 E-mail:
[email protected]
Keywords: Parameter estimation; modeling; signal samplingand reconstruction; samplingmethods 1. Abstract
Electromagnetics (EM), as is true of other scientific disciplines, utilizes solution tools that range from rigorous analytical formulations to approximate,engineeringestimates.Onegoal in EM, especially for design applications where specific performance is desired, is that of expendingonlyenough solution effortto theproblem obtain a quantitative result commensuratewith requirements. Includedamong the possible approaches for achieving such a goal is model-basedparameter estimation (MBPE). MBPE is used to circumvent the requirementof obtaining all samples of desired observables (e.g., impedance, gain, RCS, etc.) from a first-principles model (FPM) or from measured data (MD) by instead using a reduced-order, physically-based approximation of the sampled data, called a fitting model (FM). One application of a fitting model is interpolating between, or extrapolating from, samples of first-principles-modelor measured data observables,to reduce the amount of data needed. A second is to use a fitting model in first-principles-modelcomputations by replacing needed mathematical expressions with simpler analytical approximations, to reduce the computational costof the first-principles model itself. As an added benefit, the fitting models can be more suitable for design and optimization purposesthan the usual numerical data that comes from afirst-principles model or measureddata, because the fitting models can normally be handled analytically rather than via operations onthe numerical samples. This article first provides a background and motivation for using MBPE in electromagnetics,focusingonthe use of fitting models that are described byexponential andpole series. How data obtainedhom various kindsof sampling procedures can be used to quantify such models,i.e., to determine numerical values for their coefficients is also presented. It continues by illustrating applications of MBPE to various kinds of EM observables. It concludes by discussing how MBPE might be used to improve the efficiency of first-principles models based on frequency-domain integral equations (IEs). 2. Background and motivation
Most EM phenomena, whether observed in the time domain (TD) or the frequency domain (FD), or as a function of angle or 'Editor's note: PartsI1 and 111of this article will appear in the April and June issuesof the Muguzine, respectively. 42
1045-9243/98/$10.0001998IEEE
IEEE Antennas and Propagation Magazine,
Vol. 40,No. 1, February 1998
required to compute the X,x X, interaction coefficients of an integral-equation first-principles model, this reduced-rank, parametric description can be substituted for the first-principles model in appropriate applications. Such reduced-order models-theanalytic forms of which are known, andwhich are therefore completely specified when their associated parameters are quantitatively determined-provide the basis for MBPE. Although MBPE is discussed here specifically with respect to some representative EM applications, it should be understood to be a very general procedure that is applicable to essentially any process, physical or otherwise, for which a reduced-order, parametric model can be deduced. Also, it must be noted that MBPE is not “curve fitting” in the sense that term is normally used, which also can involve finding the parameters that fit some function to given data. The essential difference between MBPE and curve fitting is that the former uses a fitting model based on the problem’s physics, while the latter need not do so. That is why MBPE might be characterized as “smart” curve fitting. When curve fitting includes the goal of finding the correct fitting model for the process that generated the given data, this approach can also be described as “system identification.” It’s worth emphasizing that MBPE is not limited to physical processes, but forms the basis for variously named analytical procedures (e.g., Kummer’s method, Richardson extrapolation, and Romberg quadrature [3]). The purpose of these procedures is to speed the numerical convergence of mathematical representations involving integrals and infinite sums, and they involve an integrand function or a sequence of partial sums that can be regarded as a generalized “signal.” In discussing a non-linear procedure he developed for a similar purpose, Shanks [4] referred to such phenomena as “physical” and “mathematical” transients. In essence, any process that uses or produces a sequence or set of samples is a candidate for MBPE, using as a fitting model whatever mathematical representation is appropriate as a reducedorder representation of that process and determining the parameters of the fitting model by whatever computational procedure produces robust-enough results. This article begins by discussing two fitting models, given by exponential and pole series, respectively, that are widely encountered in electromagnetics. These are related to each other by the Laplace transform, and they arise whenever wave-equation problems are encountered. As a paradigm for the general problem, we use the time-frequency transform pair for this purpose, and first illustrate use of MBPE for time waveforms that are described by sums of complex exponentials. As an example of the other half of the transform pair, we then consider using MBPE for spectral estimation, not, however, as is most-often the case in signal processing where time samples provide the starting data, but instead when the original data comes from sampling infrequency.It is demonstrated that the parameters of the time-frequency models can be obtained numerically, either from samples of the process being modeled-which we call “function sampling”-or alternatively from samples of the time or frequency derivatives of the process, which we call “derivative sampling.” We then demonstrate applications of MBPE to a variety of EM problems where the goal is to minimize the number of first-principles-model samples that are needed to represent EM observables of interest. A discussion of some possibilities for using MBPE to reduce the complexity of first-principles-model computations, and to thereby reduce their computational cost, concludes the article. This article is excerpted and adapted from three articles by the author that appeared in the ACES NewsIetter and Journal [5,6, 71.
3. Waveform-domain and spectral-domain modeling Although Maxwell’s equations are usually first encountered in the time domain, traditionally most subsequent analysis has been
IEEE Antennas Propagation Magazine, and
done in the frequency domain. However, this situation is changing with the increasing computer power available. Each of these two domains describes the same physical problem, in principle, and either is capable of providing the sought-for EM behavior. Therefore, it seems reasonable to seek solutions in that domain and using that formulation best suited to the problem at hand. Medium or object non-linearity, dispersion, inhomogeneity, anisotropy, etc. might be the determining factor in choosing a model. Whatever approach is taken to solve a problem, it must be noted that once the problem’s sampled observables have been obtained, it is often necessary to examine their behavior in the transform domain. As noted, the two most frequently used domains for formulating and solving EM problems, and for many other physical phenomena as well, are the time domain and frequency domain, for which generic descriptions are given by exponential and pole series, respectively. More generally, it should be noted that the same transform relationship exists between other observable pairs that are also described by exponential and pole series, as listed in Table I. Thus, the terms “waveform domain” (WD) and “spectral domain” (SD) are used for phenomena that are described by exponential series and pole series, as a generalization of their more specific and familiar time-domain and frequency-domainforms. Series comprised of complex exponentials or complex poles can represent the kinds of wave-equation solutions that arise in EM and similar physical phenomena, because they occur as solutions to the kinds of differential equations that describe the problem physics. Thus, they might be regarded as providing natural “basis” functions for developing numerical solutions to such problems. One example of this is demonstrated by SEM [8,2], which exploits the fact that the EM behavior of conducting objects is described in part by complex-frequency resonances, or poles. While the pole terms alone do not describe the entire response, a summation of poles can be a good approximation to that response, and provides a concise way to represent it. For our purpose-which is to reduce the number of samples of first-principles-model observables that are needed in the first place, as well as to develop more efficient firstprinciples models-the fitting model need not be exact, so long as it provides an acceptably accurate and parsimonious representation. This is an important distinction of a fitting model, as compared with what is required of a first-principles model. The generic waveform-domain and spectral-domain fitting models can be expressed as f ( x ) = fPb) +f
7
(1)
‘ ( X ) = F , ( X ) + F , ( X ) =Xc- S~ a+ ‘ n p ( X ) ,
(2)
n p W=
Ra exP(sa4 + f n
J4
and
for a = 1,. ..,P , where x represents the waveform-domain independent variable, and X is its spectral-domain, or transformed, counterpart. For the time-frequency transform pair, x would be the time variable, t, and X would be the complex frequency, s, in general, but which for practical purposes may be limited to radian frequency zw . Note that while the exponential or pole-series contributions-designated respectively by fp(x) and Fp(X)- represent what we might call the “resonant” response, there is, in general, a non-pole component as well, denoted by &(x) and F n p ( X ) .The additional non-pole term in the waveform and spectral models is included to account for the fact that the complete response is not entirely described by the exponential or pole terms. This is true except for the time domain at “late” times, when an object is no
Vol. 40, No. 1, February 1998
43
Table 1. Various waveform- and spectral-domain field expressions. Domain Waveform (Exponential) Spectral (Pole)
Variables x g
IX
Model
Parameters (both domains)
-f (,x ),
Residues
F I\ X I)
Poies
Comments
p Time
t
Complex frequency
S
-
F(#)= 2 M , / ( ~ - sa) -
Frequency
M, = amplitude of a th mode
M, exp(s,t)
f ( t )=
f(s) =
sa = io, - D, = complex resonance of a th mode Model lb: FrequencyiTime M, = amplitude of a th mode M, exp(t,s)
F ( t )=
M,/(t
Time
t
Frequency
w i/c
Model 2a: Frequency/Space Sa =amplitude of a th source f(w)= XS, exp(gwR,)
Space
R
F ( R )=
Space
R i/c
sa/[g
Related to profiling, or inverse R, =position of a th source ‘imaging along view direction [15] along line of view Model 2b: Space/Frequency Sa = amplitude of a th source f ( ~=) S, exp(gRw,)
Space
( -~R,)]
w,
F ( ~= )
a th source Observing field of multi-frequency sources over range of spatial angles
P
I p ik I X
A basis for direction finding [ 161 q, =incidence angle of a th plane wave with respect to line P,/{g[cos P - cos Pal) of observation Model 3b: Angleispace f(p) = exp[gx, COS(pa)] S, = amplitude of a th source
f (x) =
1
CS,
q x )=
sa/[g(,x- x, )]
I
X , = position of a th source along linear array .
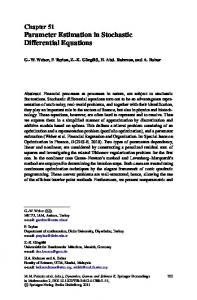
longer excited by an incident field, asat the “early” time, the response is not purely resonant. For the frequency domain, the separation between the driven and source-free behavior is not so clearly demarcated, because essentially all frequency components are affected by both time behaviors. The fitting-model parameters-the complex resonances (or poles), sa, and the modal amplitudes (or residues), R, (or their rational-hnction counterparts, which occur as polynomial coefficients)-are quantified by fitting samples of the relevant observable to the desired model, &(x) or F’(X) . Once these parameters are available from one domain, they can be used to obtain the observable they represent in the transform domain, as well. The various fitting models and their estimated parameters provide a mathematically-concise and physically insightful wayto characterize electromagnetic and other wave-equation phenomena. The relationship between the model parameters and observables in the two domains is illustrated conceptually in Figure 1. Given that exponential and pole series are especially appropriate fitting models for EM applications of MBPE, there remain the important questions of how first-principles models should be sampled, and how the fitting models themselves can be most
44
= frequency of
Model 3a: SDace/Anele p, =amplitude of a th lncldent plane wave
Space
Angle
Superposition of sinusoidal signals
ta =peak time for a wavefom
CS,/[~(@ -
Frequency
Angle
- t,)
Provides a way to find SEM poles from transient or spectral data [141
Can be used forpattern synthesis; imaging linear source distrib. [17]
effectively employed. Each of these questions is considered in the next sections. It must be noted that exponential- and pole-series models are not the only physics-based fitting models that can be used in electromagnetics. However, because of their ubiquitous presence in first-principles formulations and EM observables; they are the ones we choose to emphasize here. A wide variety of farfield problems, suitable for waveform-domain fitting models, ‘is surveyed by Miller [9], and some other kinds of fitting models are discussed in Section 9.
4. Sampling first-principle models and observables in the waveform domain
It was mentioned above that function and derivative sampling of the first-principles model can be employed in both the waveform domain and the spectral domain, a point to be expanded upon here and in Section 5 . Furthermore, it will also be shown that a given fitting model can use essentially any combination of function and derivative samples, so long as the sampling satisfies whatever constraints are imposed by the fitting model. One constraint of a waveform-domain fitting model requires that the sampling be done in uniform steps. of the independent variable, x. Aside from such
IEEE Antennas and Propagation Magazine,
Vol. 40,No. 1, February 1998
WAVEFORM DOMAIN
-
NEGATIVE DAMPINGM I S
Figure 1. Illustrations of the relationship between the waveform-domain (left-hand plot) and spectral-domain (right-hand plot) observables, and the two setsof parameters, Ra and sa, common to them both (the bottom plot). The pole locations are shown in quadrant I1 only, since they usually occur in complex-conjugate pairs, reflected about the damping axis, and have only negative real parts.
constraints,thefitting model only needs enough information from theadvantage of being obviously and directly connected to the thefirst-principles model or measured data to permit the fittingphysicalprocessbeing modeled. It begins by assuming the availmodel parameters to be computed to the needed accuracy. This abilityof uniformly-spaced samples of an exponential series, i.e., means that there can be a great deal of latitude available in using MBPE.This is an advantage, on the one hand, but one presenting, A = f ( 4= f(ih) on the other, an array of options that can sometimes obscure how =CR,exp(s,ih), a = l t o p , ~ = O ; , . . , D - I ,(3) to obtain thebest results from its use. where dic is the sampling interval, and there are a total of D,samples. Rewriting Equation(3), we get
4.1 Waveform-domain function sampling Our starting point for function samplinginthe waveform domainprovided is by Prony’s method. The presence of this procedure can be discerned in much of modern signal processing, eventhoughitwas developed originallyinthe late eighteenth century [lo]. Although other signal-processing approaches may yield better results, especially for noisy signals (e.g., pencil-offunction-based methods [ 11, 12, 13]), all begin at the same starting point, using a series of discrete data samples. Prony’s method has
IEEE Propagation Antennas Magazine, and
f, = C R , ( X , ) , i i=O,,.,,D-l, Where
,
(4)
x, = exP(sah).
The equations represented by Equations (3) and (4), above, can be written explicitly as
Vol. 40, No. 1, February 1998
45
= RI + RZ+...+Rp, fi = RIX, + RZXz+...+RpXp, f2 = RI(Xl)’ + R2(X2)2+~~~+Rp(Xp)2,
fo
(5 a) (5b)
(5c)
f D - , = R1(Xl)D-l+R2(X2)D-1+...+Rp(Xp)D-’, (5d) where a polynomial relationship clearly exists in the pattern of the X , terms in each succeeding equation. This form suggests that the X , might satisfy a polynomial of the form
A ( X )= a o+ a I ~ + a 2 x 2 + . . . + a p x P
=(x-X,)(x-x2)...(x-xp) =JJ(x-xa)= 0, a = l , ...,P ,
(6)
which is known as the characteristic equation. Upon multiplying the equation for fo by a o , that for fi by al , etc., through f p , and adding the resulting equations, we obtain
foao + fial +. . .+f p a p = 0,
(7a)
where A(Xl)= A ( X 2 )=.”= A ( X p )= 0 has been used. Repeating this sequence of operations by multiplying by a o , f 2 by al , etc., leads to
h a o + f2al+...+f p + l a p= 0 .
(7b)
Continuing these steps to generate a total of D - P equations, we obtain
fino + h a ,+. ’ .+fP+2aP = 0 fD-p-laiJ
+ fD-pal+.‘.+fD-,ap
(7c) (74
= 0.
Equation (7) forms the- basis for finding the coefficients of the characteristic equation. Note, however, that Equation (7) is homogeneous and requires some additional information, or a constraint on the characteristic-equation coefficients, for the solution to be completed. Various constraints have been suggested for this purpose, among them being
x(.$) 2
= 1, i = OJ,. . ., P (energy constraint),
(84
ap=1
(linear predictor constraint), (8b)
ai = 1
(non-causal constraint).
(8c)
Prony’s method employs a p = 1 , leading to the “linear-predictor” equation Lao + fi+lal+...+h+P-laP-l =-A+!?>
(94
so-called because knowledge of the P predictor coefficients and the past P samples of the process that generated f ( x ) yields, or “predicts,” the next sample as a weighted sum. If some intermediate coefficient were to be set to unity instead, then Equation (9a) would take the form
f,ao +f,+la~+...+fzi-lai-~+f2i+lai+l+...+S,+pap 46
>
(9’)
where fZi is given as a weighted sum of “earlier” and “later” samples. The energy constraint is not often employed, because it leads to a non-linear system of equations. The parameters of the exponential-series fitting model now become accessible by first solving Equation (7)’with a p = 1 for the P predictor coefficients, and then finding the roots of the characteristic equation, from which s, =
(lis)log(X,)
(10)
follows. The residues can be subsequently found using variousapproaches, the most straightforward of which is to solve Equation (5) directly. As an alternative, the matrix-pencil approach can be used [ l l , 12, 18, 191, of which Prony’s method is a special case. We note that the number of data samples must be such that D 2 2 P , since P R, s and Ps, s are needed to quantify the exponential model of Equation (3). Alternatively, we observe that there are P characteristic-equation coefficients to be found, so that D - P 2 P is required in Equation (7). Since the value of P is itself often not known, some experimentation is usually needed to determine it. One approach is to examine the singular-value spectrum of the data matrix. While there is a definite lower limit to the number of data samples that are needed, it may happen that many more samples are available than this because a longer data record is available, and/or the sampling interval is shorter than the minimum required. Such over-sampling represents redundant information that can be used to reduce noise effects. Also, it should be appreciated that uniform sampling in x of f ( x ) is required for the estimation procedure outlined above to be realized. Non-uniform sampling in x would not produce the integer exponents in Equation ( 5 ) that permit the polynomial of Equation (6) to be utilized. Many variations of the above procedure can be identified, differing most significantly in how the data samples might be “preprocessed” prior to accomplishing the actual parameter estimation. For example, rather than starting with the data samples themselves, auto-covariance estimates might be used instead, primarily as a means of reducing noise effects. Although the autocovariance samples might be defined in various ways, for a finitelength data sequence they basically involve replacing the individual S, s by sums of shifted, two-sample products of the data. This is essentially equivalent to solving the data matrix using a pseudoinverse, a process that also replaces data samples by product sums, since the matrix then solved is a product of the original matrix by its transpose. Other approaches for reducing noise effects are also available. If multiple measurements of the same process can be made, and if the noise is uncorrelated, averaging will improve the signalto-noise ratio of the data samples. Alternately, these separate data sets might be used to obtain multiple sets of parameter estimates that can then be averaged. The problem of dealing with noisy, uncertain, and incomplete data is an important one, which goes beyond the scope of this tutorial discussion, since the primary concern here is the situation where noise is not a limiting factor. However, a fitting model can also be used to reduce the effects of noise or uncertainty in over-sampled data, as is illustrated in Section 6.3, and which is a goal of most signal processing.
4.2 Waveform-domain derivative sampling Derivative sampling of waveform-domain data proceeds in a fashion analogous to that used for function sampling. The same
IEEE Antennas and Propagation Magazine,
Vol. 40, No. 1, February 1998
fitting model is used for each, but rather than obtaining samples of the process as function a ofx, we instead use fn = d n f ( x ) / h n
=CRa(s,)nexp(s,x),a=l
,..., n = o,...,D-1.
(11)
Making a change of variables like that done above for function sampling, we rewrite Equation (1 1) as
f, = z R h ( ~ , ) ~ , a = l , P; . . .n, = O ,...,D-1,
(12)
where Rh = R, exp(s,x) , i.e., the variation in f, due to whatever value is used for the observation variable x is absorbed in the residue. Upon explicitly writing some of the individual equations implicit in Equation (12), we obtain
fo = R,+ R2+. - + R p , fi = RI(Sl)1 + R2(s2)!+...+Rp(sp)1
fz
=
4.3 Combining waveform-domain function sampling and derivative sampling As a generalization of the above discussion, it should be noted that it is also possible to combine function and derivative sampling of waveform-domain data. Letting h,, represent the nth derivative of f ( x ) at x = xi leads to '
= RI(SJ2 + Rz(s2)?+. ..+Rp(sp)2
fD-1
Thus, either function sampling or derivative sampling can be used to estimate the parameters of an exponential series. While function sampling might be achieved analytically, numerically, or experimentally, derivative sampling is limited to the former two approaches, as there seems to be no practical way of measuring, say, the time derivatives of a transient waveform. Derivative sampling is none-the-less relevant, as significant computational advantages can arise from using derivative information in the spectral domain, as is discussed hrther in Section 14.2. Although a similar advantage might also be found for using derivatives in waveform-domain modeling, it's mentioned here to emphasize the symmetry that exists between function and derivative sampling, and between the waveform domain and the spectral domain.
(13)
+ R2(sz)D-1+"'+Rp(sp)D-'.
Again, a polynomial model is suggested by the terms appearing in Equation (13). If we assume that
h,n=~R,(s,)"(X,)',
where it is assumed that there are F derivatives at each of d sample locations in x, and where n = 0 is the usual function sample. The same number of derivatives is not needed at eachsample point, but this restriction makes the development more straightforward. The following equations are then obtained
B(s)=4+qs+9s2+...+bpsP
f0,O = Rl
(14)
=rI(s-s,); a = 1 , ...,P ,
= 0,
+ Rz+* *+Rp, *
f0,l = Rl(sl)' + Rz(sz)l+.**+Rp(sp)',
and multiply the first equation in Equation (13) by 4 , the second by 4 , etc., and add the resulting equations together, we obtain
fob0 +.fib+...+ fpbp
a = l , ...,P; i = O ,...,D; n = O ,...,F (16)
fO,F = R I ( S J F
+ R2(s2)F+."+RP(sP)F
fi,o = RI(X1)' + R2(X2)'+...+RP(XP)l,
(154
A,l
= R h I ) l ( 4 Y +R2(sz)'(X2)1+,.+RP(SP)l(XP)lY
(17)
since B ( q ) = B(sz)=...= B(sp)= 0. Continuing this process by successively repeating these steps starting with the equation for A , A, A , etc., we get
fi,F = Rl(S)F(Xl)I+ Rz(~z)F(X2)'+...+RP(~P)F(~P)' 9
D fD,O =Rl(Xl)D +R2(X2)D+'"+RP(XP)
A4 +fZ4+-+fP+lbP f2bo +
f34
9
= 0, +. .'+fP+zbP = 0 9
9
fD,l = iPI(sl)'(~l)D+RZ(s2"X2)D~''+RP(~P)l(XP)D,
(15b) fD-p-260 +fD-P-l4+"'+fD-2bp = 09 f&p-]bo + fD-pbj+"'+ f~-lbp= 0.
The set of equations in Equation (15) provides a basis for solving for the coefficients of the B(s) polynomial. As found above for waveform-function sampling, Equation (1 5) is also homogeneous in the B(s) coefficients, and thus requires additional information, or a constraint, to solve it. Lacking any convincing reason to do otherwise, we choose to set bp to unity, which results in righthand-side entries for the successive equations of Equation (15) given by -f P + ] ,-f P c 2 , .. . , -fD-1, respectively. The resulting relationships then defined by Equation (15) again take the form of a predictor equation, but where now P lower-order derivatives and the P predictor coefficients provide a derivative one order higher, although other coefficient constraints would lead to other relationships. Again, we need D 12P for a solution.
f D , F = Rl(sl)F(X1)D +Rz(s2)"(X2)D+"'+RP(sP)F(XP)D
*
The polynomial that might be used to reduce this system of equations is not as obvious as was the case for function sampling or derivative sampling, alone. At least two distinct choices might be considered:
s(X,s) = A( X ) B ( s )
(18a)
P2(X,s)=C ( X , s ) ,
(1 8b)
and
the difference being the number of independent coefficients for given highest-order terms in X and s. The product form of Equation (18a), for example, which might be viewed as a separation-ofvariables form, yields D + F coefficients, whereas that of Equa-
l€€€ Antennas and Propagation Magazine,Vol. 40,No. l,February 1998
-
47
'
-
tion (18b) has instead DF . Thus, expanding S ( X , s ) in terms of A ( X ) and B(s),we obtain
Proceeding as before, successively multiplying the data-sample equations by the set of coefficients from the chosen polynomial model, equations in the characteristic-equation coefficients can be derived. For example, if we were to use the product-form polynomial in A ( X ) and B(s) as in Equation (lsa), equations like the following would be obtained:
q ( ~ , s )= (ao+ a l ~ + a 2 ~ 2 + , , . + a D _ +a+?) 1~D-'
+ 4 s + b$2+..+bF-ISF-1 + b,uSF) (1%) = aobo + alboX + ao4s + a2boX2+ alq& + aoqs2+...+aDbFXDsF .(bo
aObOfO,O
~albOfi,O+"'+aD-lbF-lfD-l,F-l +fD,F
=o.
(lgC)
= 0,
Thus, the initial solution of the data matrix would provide intennediate results in, terms of the coefficient products, which could be subsequently solved for the individual Coefficients, themselves. The approach just described has apparently not been implemented.
where the cross-term (in X and s) coefficients involve various products and sums of the A ( X ) and B(s) coefficients, for a total of D + F + 2 independent coefficients. If, on the other hand, we use Equation (1 8b),we would have
P2( X,s) = C0,O + C1,OX + cO,1s + C2,OX = 0 , 9b)
2
2
+ c1,1Xs + cO,2s +'
'
5. Sampling first-principle models and observables in the spectral domain
D F
'+cD,FX s (1
The use of spectral-domain data for MBPE is conceptually similar to sampling in the waveform domain, but because the fitting model for the former is the transform of the latter, significant differences arise. This is now shown, where spectral-domain function and derivative sampling are described, respectively.
which has a total of DF + 1 coefficients. Clearly, either approach leads to a linear system of equations for the polynomial coeffi-. cients, but without testing it's not obvious which of these, or possibly another, might be better.
5.1 Spectral-domain function sampling
Anticipating encountering a similar question in spectraldomain sampling, where various combinations of function and derivative sampling have been found to be successful, some fundamental questions arise concerning the most effective sampling strategy in the waveform domain. First, a minimum of 2P samples are required of a waveform signal having P pole terms, whatever combination of function and derivative sampling has been used to generate them. Second, the sample spacing must satisfy the Nyquist rate for the highest-frequency component of the signal, Le., 6 I 1 / 2f ,, , where f,, is the maximum frequency, at least in a generalized sense, noting that this restriction is irrelevant when all samples are taken at a single frequency. Finally, the data samples must be spaced such as to obtain a polynomial model. A uniform spacing 6 is generally used, but any sequence of sample spacings that are related as integer multiples of 6 could be used, in principle.
Spectral-domain function sampling begins with the fitting model given by Equation (2), and assumes the availability of samples denoted by
F;:=F(x,)=CR,/(X,-S,)+F;,(X,), a = i ,...,P . (20) In contrast to waveform sampling, there is no requirement that the sampling points Xibe uniformly spaced. However, in contrast to waveform sampling, where the fitting model can be a purely exponential series at late times, spectral sampling cannot avoid the presence of the non-pole term, which is generally unknown. Fortunately, an approximation to the Fnp term can be realized by generalizing the pole series in Equation (20)'[20]. First, note that, as written, the pole series can be developed into a particular rational function, where the denominator order exceeds that of the numerator by one. A general rational function hasno specified connection between the orders of the polynomials which comprise it, however. The capability of a pole series to model resonances can be retained, while changing the numerator-polynomial order relative to that, of the denominator. Note that the special case of using rational functions as a model is alsoknownasPad6 approximation [21] when the function and derivative sampling is done at a single point, although. the term has been applied to the more general approach considered here [22].
A critical question in considering alternate sampling strategies, both those that involve function sampling as well as function and derivative sampling, is "how much information is provided by each additional sample?' Some sampling strategies are clearly less effective. For example, if 2P samples were to be used but at an arbitrarily closer spacing 6' n + d + 1, can be handled in various ways, one of which is to employ a pseudoinverse for the solution. Another approach would be to employ overlapping windows of different data sets, to compare the performance of their respective fitting models. A third would be to progressively increase the number of data samples while retaining the same number of fitting-model coefficients, and comparing the fitting-model spectra to observe their trends. Derivative sampling can also be performedin the spectral domain, as can various combinations of function and derivative sampling. One result is that the samples can be spaced more widely when derivative information is available. A more important consideration is that in some circumstances, a derivative sample can be obtained for a computational operation count that is of order l / X i of the first function sample alone. Thus, if a derivative sample provides information commensurate with that provided by a function sample, an obvious computational advantage arises from using derivative samples to decrease the number of X i sample points that are needed. Using derivative sampling in the context of a frequency-domain first-principles model is discussed more fully in Section 14.2. 5.2 Spectral-domain derivative sampling
N i = N ( X i ) = NO + NIXi + N2(Xi)2+...+N,(Xi)n. (22d)
-
There are d + n + 2 unknown coefficients in the two polynomials D ( X ) and N ( X ) and, as for waveform-domain modeling, a constraint or additional condition is needed to make the sampled equations inhomogeneous. Again, there is no unique choice for this constraint, but if we set Dd = 1, then the following equations result:
FODO+ X,F,D,+...+Fo(X,)d-'Dd-l -NO
- XONl-.**-(XOInNn
d
The set of possible sampling strategies concludes with derivative sampling in the spectral domain, which was called "Frequency-Derivative Interpolation" (FDI) [23] when first presented. In this case, we rewrite Equation (21a) as
X)D(F(
X ) = N (X ) .
(21a' )
Upon differentiating with respect to X t times, this leads to (omitting the explicit Xdependence)
F'D + FD' = N' FO
9
DO + X,F;4+...+F;(X,)d-1Dd-l -N~-x,N,-..-(x,)~N,
= - ( x J ~ F(23) ;,
FD-IDO+ XD-IFD-IDI+...+FD-](XD-l)d-'Dd-l d
-No-XD_lNi-...-(XD-l)"N, =-(XD-l) FD-1, where D t n + d + 1 is again required. Note that the matrix coefficients are now comprised of a product of a data sample and the frequency at which the sample is taken raised to a power, in contrast to the time-domain situation where the data samples alone are the data-matrix coefficients. Also observe that the poles in the spectral domain arise directly as the roots of D ( x ) , whereas in the waveform domain, the poles are natural logarithms of the roots of the characteristic equation, Equation (6). The exponentiation of the sampling frequencies suggests that large numerical dynamic ranges in the matrix coefficients may result if d and n are very large. One way to avoid this is to scale the frequency, so that, for example, if the sampling range is centered at 1 GHz, a scaling of log in the frequencies leads to nominal scaled values near unity. It is also possible to center the spectral-domain model about a frequency in
where Cr,s= r f [ s ! ( r - s ) ! ]is the binomial coefficient, and we require both that the t + 1 samples F(O),..., F(') be such that t + 1 1 n + d + 1, and that one of the coefficients is set to unity for a unique solution to be obtained. Clearly, these also become a linear system of equations for the polynomial coefficients, which can be expressed in the form
IEEE Antennas and Propagation Magazine,Vol. 40, No. 1, February 1998
49
where the substitution X’ = X - X , has been made, with X, being the sampling frequency, so that all hequency-dependent terms drop out from the final equations, and Do has been set to unity. The subscripted F quantities in the above matrix are
10. R. Prony, “Essai Experimental et Analytique sur les Lois de la Dilatabilite de Fluides Elastiques et sur Celles del la Force Expansive de la Vapeur de L’alkool, a Differentes Temperatures,” J. I’Ecole Polytech. (Paris), 1, 1795, pp. 24-76.
F, = F(,)/m!. A technique called “Asymptotic Waveform Expansion” (AWE) was reported for circuit modeling’[24] shortly after hequency-derivative interpolation was presented, and in one implementation it leads to equations identical to Equation (25) [25]. It is worth noting that AWE was motivated by a need to develop transient responses from spectral-domain data, and it explicitly determines the fitting-model poles for this purpose using a Laplace transform.
11. T. K. Sarkar, J. Nebat, D. D. Weiner, and V. K. Jain, “Suboptimal Approximatiodldentification of Transient Waveforms from Electromagnetics Systems by Pencil-of-Function Method,” IEEE Transactions on Antennas and Propagation, AP-28, 12, 1980, pp. 928-933.
A still more general sampling strategy can be employed, where two or more frequencies are used at each of which a variable number of frequency derivatives can be independently specified. This leads to a more complicated system of equations 1201, but one which is, numerically, simply still another way to compute the fitting-model parameters, i.e., the fitting model and the data used for its quantification in the spectral domain can be independently specified. The computational advantages of using spectral-domain derivative sampling from a CEM viewpoint are discussed in Section 14.2.
17. References 1. J. T. Cordaro and W. A. Davis, “Time Domain Techniques in the Singularity Expansion Method,” IEEE Transactions on Antennas and Propagation, AP-23, 1980, pp. 358-367. 2. C. E. Baum, “Emerging Technology for Transient and Broadband Analysis and Synthesis of Antennas and Scatterers,” Proceedings of the IEEE, 64, 12,1976, pp. 1598-1616.
3. A. Ralston, A First Course in Numerical Analysis, New York, McGraw-Hill Book Co., 1965. 4. D. Shanks, “Non-Linear Transformations of Divergent and Slowly Convergent Sequences,” Journal of Mathematics and Physics, the Technology Press, Massachusetts Institute ofTechnology, Cambridge, MA, 1955, pp. 1-42. 5. E. K. -Miller, “Model-Based Parameter Estimation in Electromagnetics: I-Background and Theoretical Development,” Applied Computational Electromagnetics Society Newsletter, 10, 3, November 1995.
6. E. K. Miller, “Model-Based Parameter Estimation in Electromagnetics: II-Applications to EM Observables,” Applied Computational Electromagnetics Society Newsletter, 11, 2, 1996, pp. 3556. 7. E. K. Miller, “Model-Based Parameter Estimation in Electromagnetics: III-Applications to EM Integral Equations,” Applied Computational Electromagnetics Society Journal, 10, 3, 1995, pp. 9-29. 8. S. A. Schelkunoff and H. T. Friis, Antennas: Theory and Practice,” New York, John Wiley & Sons, Inc., 1952, Chapter 9.
9. E. K. Miller, “Model-Based Parameter-Estimation Applications in Electromagnetics,” in B. de Neumann (ed.), Electromagnetic Modeling and Measurements for Analysis and Synthesis Problems, Kluwer Academic Publishers, NATO AS1 Series E: Applied Sciences, 199, 1991, pp. 205-256.
50
12. T. K. Sarkar and 0. Pereira, “Using the Matrix Pencil Method to Estimate the Parameters of a Sum of Complex Exponentials,” IEEE Antennas and Propagation SocieQ Magazine, 37, 1, 1995, pp. 48-55. 13. Y . Hua and T. K. Sarkar, “Generalized Pencil-of-Functions Method for Extracting the Poles ofan Electromagnetic System from its Transient Response,” IEEE Transactions on Antennas and Propagation, AP-37, 2, 1989, pp. 229-234. 14. A. J. Poggio, M. L. Van Blaricum, E. K. Miller, and R. Mittra, “Evaluation of a Processing Technique for Transient Data,” IEEE Transactions on Antennas and Propagation, AP-26, 1, 1978, pp. 165-173. 15. E. K. Miller and D. L. Lager, “Inversion of One-Dimensional Scattering Data Using Prony’s Method,” Radio Science, 17, 1982, pp. 211-217. 16. C. J. Benning, “Adaptive Array Beamformiug and Steering Using Prony’s Method,” Proceedings 19th Annual Symposium on USAF AntennaResearch and Development Program, University of Illinois, Allerton, 1969. 17. E. K. Miller and D. L. Lager, “Imaging of Linear Source Distributions,” Electromagnetics, 3, 1983, pp. 21-40. 18. R. S. Adve and T. K. Sarkar, “Generation of Accurate Broadband Information hom Narrowband Data Using the Cauchy Method,” Microwave and Optical Technology Letters, 6, 10, 1993, pp. 569-573. 19. R. S. Adve and T. K. Sarkar, “The Effect of Noise in the Data on the Cauchy Method,” Microwave and Optical Technology Letters, 7, 5 , 1994, pp. 242-247. 20. E. K. Miller and G. J. Burke, “Using Model-Based Parameter Estimation to Increase the Physical Interpretability and Numerical Efficiency of Computational Electromagnetics,” Computer Physics Communications, 68, 1991, pp. 43-75. 21. W. H. Press, S. A. Teukolsky, W. T. Vettering and B. P. Flannery, Numerical Recipes, Second Edition, Cambridge, Cambridge University Press, 1992.
22. V. I. Kukulin, V. M. Krasnopol’sky and J. Horacek, Theovy of Resonances: Principles and Applications, Praha, Czechoslovakia, Academia, and Nordrecht, The Netherlands, Kluwer Academic Publishers, 1989. 23. G. 5. Burke and E. K. Miller (1988), “Use of FrequencyDerivative Information to Reconstruct an Electromagnetic Transfer Naval Postgraduate Function,” FourthAnnualACESReview, School, Monterey, CA, March 22-24.
IEEE Antennas and Propagation Magazine,Vol. 40,No. 1, February 1998
24. L. T. Pillage andR.A. Rohrer, “AsymptoticWaveform Evaluation for TimingAnalysis,” IEEE Transactions on Computer-Aided Design, 1990, pp. 352-366.
40. I. J. Gupta, I. J., “High-Resolution Radar Imaging Using 2-D Linear Prediction,” IEEE Transactions on Antennas and Propagation, AP-42, 1994, pp. 31-37.
25. C. J. Reddy, Private Communication, 1997.
41. R. J. Lytle and D. L. Lager,“Using the Natural-Frequency Concept in Remote Probing of the Earth,” Radio Science, 7, 3, 1976, pp. 245-250.
26. G. J. Burke, G. J., Private Communication, 1992. 27. J. T.de Beer and D. C. Baker, “An Examination of the Effect of MechanicalDeformationontheInputImpedance of HF LPDA’s Using MBPE,” Applied Computational Electromagnetics Society Journal, 10, 3, 1995, pp. 30-37. 28. G. J. Burke, E. K. Miller, S. Chakrabarti,and K. Demarest, “UsingModel-BasedParameterEstimationtoIncrease the Efficiency of Computing Electromagnetic Transfer Functions,” IEEE Transactions on Magnetics, MAG-25, 4, 1989, pp. 2807-2809, July. 29. L. R. Fermelia, G. Z. Rollins and P. Ramanujam, “The Use of Model-BasedParameterEstimation(MBPE)fortheDesign of Corrugated Horns,” IEEEInternationalSymposium on Antennas and Propagation and URSI National Radio Science Meeting URSI Abstracts, University of Michigan,l993, p. 388. 30. K. Kottapalli, T. K. Sarkar, R. Adve, Y. Hua, E. K. Miller, and G. .I. Burke, “Accurate Computation of WidebandResponse of Electromagnetic Systems Utilizing Narrowband Information,” Computer Physics Communications, 68, 1991, pp. 126-144. 31. K. Krishnamoothy, T.K. Sarkar, X. Yang, E. K. Miller and G. J. Burke,“Use of Frequency-DerivativeInformationtoReconstruct the Scattered Field of a Conducting Cylinder Over a Wide Frcqucncy Band,” Journal of Electromagnetic Waves and Applications, 5, 6, pp. 653-663, 1991. 32. S. D. Lin, S. D., “Interpolation Techniques for Noisy Spectral Data,” PhD Dissertation, Mississippi State University, 1991. 33. E.K.Miller,“UsingModel-BasedParameterEstimationto Estimate the Accuracy of NumericalModels,”in 12th Annual Review of Progress in Applied Computational Electromugnetics, Naval Postgraduate School, Monterey, CA, 1996, pp. 588-595.
34. A. R. Roberts and D. A. McNamara, “Interpolating Radiation Patterns Using Prony’s Method,” Proceedings of the Symposium on Antennas and Propagatiotr and Microwave Theory and Techniques, University of Stellenbosch, Stellenbosch, SouthAfrica, October, 1994, pp. 15 1-1 54. 35. 0. M. Bucci and G. Franceschetti, “On the Spatial Bandwidth of Scattered Fields,” IEEE Transactions on Antennas and Propagation, AP-35, pp. 1987, 1445-1455. 36. C. A. Balanis, Antenna Theory, New York, Harper and Row, 1982, pp. 679’684. 37. Mathur, Private Communication, Ohio University, 1995. 38. MP.HurstandR.Mittra,“ScatteringCenterAnalysisVia Prony’s Method,’’ IEEE Transactions on Antennas and Propagation, AP-35, 1987, pp. 986-988. 39. J. J. Sacchini, “Development of Two-Dimensional Parametric Radar Signal Modeling and Estimation Techniques with Application to Target Identification,” PhDDissertation,Ohio State University, 1992.
IEEE Propagation Antennas and
42. C. R. Tai, “Transients on Lossless TerminatedTransmission Lines,” IEEE Transactions on Antennas and Propagation, AP-26, 1978, p. 556. 43. E. K. Miller, “A Variable Interval WidthQuadrature Technique Based on Romberg’s Method,” Journal of Computational Physics, 5, 1970, pp. 265-279. 44. E. K.Miller, “An Approximate Formula for the Admittance of a Long, ThinAntenna,” IEEE Transactions on Antennas and Propagation, AP-16, 1968, pp. 127-128. 45. E. K. Miller, “Admittance Dependence of the Infinite Cylindrical Antenna Upon Exciting Gap Thickness,” Radio Science, 1967, pp. 1431-1435. 46. T.H.Lehman, “A Statistical Theory of Electromagnetic Fields inComplexCavities,” EMP Interaction Note IN-494, Phillips Laboratory, Kirtland AFB, NM, 1993. 47. R. Smith, Private Communication, Kaman Sciences, Colorado Springs, CO, 1990. 48. A. W. Oppenheim and R. W. Schafer, Digital Signal Processing, Englewood Cliffs, NJ, Prentice-Hall, Inc., 1975. 49. G. J. Burke and E. K. Miller, “Modeling Antennas Near to and Penetrating a LossyInterface,” IEEE Transactions on Antennas and Propagation, AP-32, 1984, pp. 1040-1049. 50. E. K. Miller, J. N. Brittingham, and J. T. Okada,“BivariateInterpolationApproach for EfficientlyandAccuratelyModeling Antennas Near a Half Space,” Electronics Letters, 13, 1977, pp. 690-691. 51. K.R. Demarest, E. K.Miller, K. Kalbasi,andL-K WU, “A Computationally EfficientMethod of Evaluating Green’s Functions for 1-, 2-, and 3D Enclosures,” IEEE Transactions on Magnetics, MAG-25,4, 1989, pp. 2878-2880. 52. R. Coifman, V. Rokhlin and S. Wandzura, “The Fast Multipole Method for the Wave Equation: A Pedestrian Prescription,” IEEE Antennas and Propagation Magazine, 34,3, 1993, pp. 7-12. 53. F. X. Canning, “Transformations That Produce a Sparse Moment Matrix,” Journal of Electromagnetic Waves and Applications, 4, 1990, pp, 983-993. 54. Chew, W. C. (1993), “FastAlgorithms for WaveScattering Developed at the University of Illinois’ Electromagnetics Laboratory,” IEEE Antennas and Propagation Magazine, 35, 4, 1993, pp. 22-32. 55. G. Vecchi, P. Pirinoli, L. Matekovits and M. Orefice, “Singular Value Decomposition in Resonant Printed Antenna Analysis,” in Proceedings of Joint 3rd International Conference of Electromagnetics in Aerospace Applications, 1993, pp. 343-346.
Magazine, Vol. 40,No. 1, February 1998
51
64. C. E. Baum, “Toward an Engineering Theory of Electromagnetic Scattering: The Singularity and Eigexxnode Expansion Sfethods,” P. L. E. Uslenghi (ed.), Electromagnenc S c u t t e r i ~ ~ Sen. g, York, Academic Press, 1978, Chapter 15, pp. 5-1-651.
56. E. K. Miller,, F. J. Deadrick, G. 5. Burke and J. A. Landt, “Computer-Graphics Applications in Electromagnetic Computer Modeling,” Electromagnetics, 1, 1981, pp. 135-153. Data From the 57. E. H. Newman, “Generation ofWideband Method of Moments by Interpolating the Impedance Matrix,” IEEE Transactions on Antennas and Propagation, AP-36, 12, 1988, pp. 1820-1824.
18. Some abbreviations I
d DSA EFIE FD FDI FDIE FM FPM GM MME MD MBPE
58. G. W. Benthien and H. A. Schenck, “Structural-Acoustic Coupling,” in R. D. Ciskowski and C. A. Brebbia (eds.), Boundary Element Methods in Acoustics, Computational Mechanics Publications, 1991.
59. K. Virga and Y. Rahmat-Samii, “Wide-Band Evaluation of Communications Antennas Using [Z] Matrix Interpolation with the Method of Moments,” in IEEE Internatiqnal Symposium on Antennas and Propagation Digest, Newport Beach, CA, 1995, pp. 1262-1265.
n
60. R. M. Shubair and Y. L. Chow, “A Simple and Accurate Complex Image Interpretation of Vertical Antennas Preient in Contiguous Dielectric Half-spaces,” IEEE Transactions 0% Antennas and Propagation, AP-41, 1993, pp. 806-812.
NEC
oc
oci
OC, RCS’
61. D. G. Fang, J. J. Yang, and G. L.Delisle, “Discrete Image Theory for Horizontal Electric Dipoles in a Multilayered Medium,”Proceedings, IEE 135, 1988, pp. 297-303.
w SEM
Romberg’s Method Singularity Exparision Method. Spectral Domain STatistical,ElectroMagneti~s
SD STEM TD
62. K. W. Brown andA. Prata, ‘‘EfficientAnalysis of Large Cylindrical Reflector Antehas Using a Nonlinear Solution of the Electric Field Integral,Equation,” in IEEE International Symposium on Antennas and Propagation Digest, Seattle, WA, 1994, pp. 42-45. 63. R. C. Hall and J. R. Mosig, “The Analysisof Arbitrarily Shaped Aperture-Coupled Patch Antennas,” IEEE Transactions on Antennas and Propagation, AP-44, 1996, pp. 608-614.
Order of rational-function denominator polylomial Discrete-Source Approximation Electric-Field Integral Equation Frequency Domain Frequency-Derivative Interpolation Frequency-Domain Integral Equation Fitting Model First-principles mudel Generating Model’ Maximum Mismatch Errsr Measured Data ‘ Model-Based Parameter Estimation Order of rational-fiinctionnumerator polynomial Numerical Electromagnetics Code Operation Count for numerical solution Operation Count at frequency f, Total Operation Count summed over frequency Radar Cross Section ’
m. X, ’
Xsi
’
,
Time Domain Waveform Domain , Generic number ofspati,alunknowns Number of spatial unknowns at frequency fl ,
-
.
11111111111111111111lllllllllllllllllllllllllllllllllllllllllllllllllllllllllllllllllllllllllllllllllllllllllll
’
USNC/URSI Student Paper Winners The winners of theStudentPaperAwardsattheNational Radio Science Meeting, January 5-8, 1998, Boulder, Colorado. The US NationalCommitteefortheInternationalUnion of Radio Science presented the awards. First place was won by Steven C. Reising.(l), of the STAR Laboratory, Stanford University, for his paper, “ELF RadioAtmospherics as a Proxyfor Sprite Occurrence.” Second place was ’awarded to Charles A. Moses (c), of the Moore Schoolof Electrical Engineering, University of Pennsylvania, for his paper (fith Sader Engheta), “TheoreticalElectromagneticStudy of theWirehledium.” Third place was awarded to RobertA: Hoferer (r), of the Electrical Engineering Department, University of California, Los Angeles, for his paper (with Yahya Rahmat-Samii), ‘‘RF Characterization of an Inflatable Parabolic Torus Reflector Antenna for Space-BorneApplications.”
52
IEEE Propagation Antennas Magazine, and
,Val. 40,‘No. 1, Februaiy 1998