Jul 17, 2017 - bHoneywell Prague Laboratory, Honeywell, s.r.o Prague, Czech Republic. Abstract ... A non-linear cleaning model is used to represent.
Model-based predictive maintenance in building automation systems with user discomfort Nathalie Cauchia , Karel Macekb , Alessandro Abatea a Department
of Computer Science, University of Oxford, Oxford, United Kingdom Prague Laboratory, Honeywell, s.r.o Prague, Czech Republic
b Honeywell
Abstract This work presents a new methodology for quantifying the discomfort caused by non-optimal temperature regulation, in a building automation system, as a result of degraded biomass boiler operation. This discomfort is incorporated in a model-based dynamic programming algorithm that computes the optimal maintenance action for cleaning or replacing the boiler. A non-linear cleaning model is used to represent the different cleaning strategies under taken by contractors. The maintenance strategy minimizes the total operational costs of the boiler, the cleaning costs and the newly defined discomfort costs, over a long-term prediction horizon that captures the short-term daily thermal comfort within the heating zone. The approach has been developed based on real data obtained from a biomass boiler at a Spanish school and the resulting optimal maintenance strategies are shown to have the potential of significant energy and cost savings. Keywords: Predictive maintenance, Biomass boiler modelling, Temperature regulation, Thermal comfort, Dynamic programming, Energy savings
1
2 3 4 5 6 7 8 9 10 11 12 13 14 15 16 17 18 19 20 21 22 23 24
1. Background & motivation The European Union aims to increase the contribution of renewable energy sources by up to 20% by 2020 [1] and it is stipulated that biomass fuels will account for 56% of renewable energy generation [2]. Many research initiatives are being carried out to take advantage of biomass potential as a renewable energy source [3]. Biomass boilers provide a cleaner alternative to conventional gas boiler. However, this comes at a cost of being more subject to soot accumulation due to fouling. Heat transfer surface fouling is a continuous issue that negatively impacts heat exchanger operation by reducing the boiler efficiency and increasing the cost of operation [4]. Thus, optimal cleaning strategies are required to minimise the effect of fouling. This can be achieved by employing predictive maintenance strategies. Predictive maintenance is defined as maintenance strategy that is able to forecast the trend of performance degradation [5]. The work in [6] addressed this issue by applying mathematical modelling to deduce the optimal maintenance policy that incorporates periodic inspection and replacements. A reliability-centred predictive maintenance policy for a continuously monitored system subject to degradation due to imperfect maintenance is proposed in [7]. In the context of heating devices for building automation systems (BAS), [8] devised an algorithm that optimises the frequency of the cleaning process, in order to improve boiler performance. Similarly, the work in [9] has applied more accurate first-principle modelling and optimised the duration and timing of the cleaning process. [10] suggested the synthesis of predictive maintenance strategies based on dynamic programming: this technique is further expanded by including a combination of forecasting and optimisation methods in [11]. Predictive maintenance of devices has been widely studied towards potential energy saving goals in BAS, however the effect of discomfort on occupants and its related costs has been broadly ignored [12, 13, 14]. Numerous contributions highlighting the effect of discomfort [15, 16] have stressed the importance of accounting for the cost of indoor thermal comfort. This contribution studies the problem of quantifying discomfort due to non-optimal temperature regulation, in BAS, as a consequence of degraded boiler operation, and that of using this cost within a predictive Preprint submitted to Elsevier
July 17, 2017
38
maintenance optimisation problem. Predictive maintenance strategies are computed based on a total costs including contributions due to operation, maintenance, and (new in this work) discomfort. Optimal strategies are computed using Dynamic Programming (DP) and comprise three alternative maintenance actions (No Action, Clean, and Replace). Unlike related studies in literature [11] focusing on long-term horizons (and weekly time steps), in order to account for discomfort this study needs to consider also daily horizons and intra-day temperature dynamics: we put forward a daily discomfort metric that can be embedded in the overall longer-term contributions to the cost function. A daily time step further allows for capturing trends that represent the output power consumed by the building. This leads to devising predictive maintenance strategies over larger horizons (for instance over 5 years) that newly account also for discomfort costs. This article has the following structure: Section 2 introduces an approach for quantifying discomfort, which is followed by the synthesis of optimal maintenance policies in Section 3. This includes the embedding of discomfort metric within the policy synthesis architecture. The framework is applied to a Spanish school case study which is presented in Section 4. The resulting algorithms are demonstrated under different scenarios in Section 5, which also discusses the total energy and discomfort savings obtained by the scheme.
39
2. Discomfort as a consequence of degraded temperature control
27 28 29 30 31 32 33 34 35 36 37
40 41 42 43 44 45 46 47 48 49 50 51 52 53
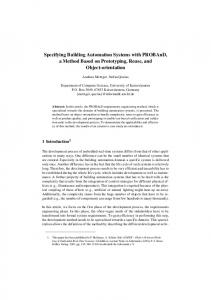
In this study, we consider a correctly sized biomass boiler with a hopper, supplying thermal energy to a zone. The boiler has a fixed schedule and is turned on during the start of the working day and switched off at the end. When in operation, the boiler combusts biomass fuel in order to generate heat in the heat exchanger and consequently supply heat to the building. This combustion process causes soot accumulation in the heat exchange chamber, a process known as fouling, which degrades the boiler efficiency with time. During the transient when the boiler is switched on, a lag in the time taken to reach the building set point is witnessed with degradation of boiler efficiency. Discomfort can thus be seen as a function of the additional time taken to reach a temperature set point due to the degradation of the boiler efficiency, which otherwise operates properly. [17] has also made use of this notion to quantify occupant comfort. Consider Figure 1, where Tz is the zone temperature (namely the temperature in the building). When the boiler efficiency η is lower than ηmax , the zone temperature takes a longer time to reach the lower bound of the comfort region δ. This introduces discomfort during the switching ON phase of the boiler. This discomfort is captured in the form of a time delay expressed as the difference between the time taken for the zone temperature to reach the comfort region with the current η level and the time taken to reach the comfort level when the boiler operates using the maximum efficiency ηmax (tη − tηmax ). Thus, to properly η = η max η < η max
TSP
o
26
Zone temperature ( C), Tz
25
Tz (t0 )
tηmax
tη
Time
Discomfort Region
Figure 1: The effect of boiler degradation on the zone temperature and the introduced discomfort, during the transient operation of a boiler as it transitions from the OFF to the ON state. Here Tz (t0 ) is the initial temperature, TSP is the zone temperature set-point, δ represents the acceptable comfort region and the discomfort region is tη − tηmax .
2
δ
54 55
capture the effect of discomfort due to boiler degradation the following rule is applied: Account for discomfort only when: Tz < TSP −
δ and bon = 1, 2
(1)
where Tz represents the zone temperature, TSP is the required temperature set point, δ represents the width of the considered comfort region, and bon = 1 represents the boiler in the ON state. 56 57 58 59 60
In order to capture the total time taken to reach the temperature set point within the zone and to apply the defined rule to compute the associated discomfort, we consider a thermal model representing the zone dynamics. Whilst this model accounts for the intra-day temperature dynamics, the discomfort metric is a daily value that can be employed in the cost function alongside operational and maintenance costs (as discussed later). In this work, the thermal model being used is a first-order model that is given by Cr
61 62 63 64 65 66 67 68
Tout − Tz d(Tz ) = + ηbon Pin + Pocc + Prad . dt Row
(2)
Here Tz is the zone temperature, Tout is the outside air temperature, Pin is the biomass boiler input power with bon representing the when the boiler is on, Prad is the heat gained from solar radiation, Pocc is the heat gained due to occupants, Cr is the zone capacitance, Row is the thermal resistance of the zone envelope, and η ∈ [0, 1] is the daily boiler efficiency, which is the dual of the boiler degradation (1 − η). The values of the parameters Cr and Row are estimated from data using maximum likelihood [18, 19] or Kalman filtering [20]. To compute the total time to reach the temperature set point (TSP ) following an OFF/ON boiler transition, (2) is solved analytically, considering the initial time to be t0 and bon = 1, (as per (1)): � �� � � �� Z tη � � � � −tη t0 Tout (τ ) tη τ Tz (tη ) = exp Tz (t0 ) + ηPin Row exp − exp + dτ exp Cr Row Cr Row Cr Row C R Cr Row r ow t0 � � Z tη τ Pocc (τ ) + exp dτ Cr Row Cr t0 � � � Z tη τ Prad (τ ) + exp dτ , Cr Row Cr t0 (3)
69 70 71 72 73 74 75 76 77 78 79 80 81 82
where tη is the final time step and indicates the time at which the lower comfort temperature value is reached (Tz (tη ) = TSP − 2δ ) and where we assume next for simplicity that t0 = 0. In order to reason about longer-term device degradation and the corresponding maintenance actions, we intend to map the continuous temperature dynamics into daily discrete discomfort values that quantify the effect of boiler degradation on thermal comfort. To perform such a mapping, the following choices and observations are made: Define the daily time steps as n = {1, . . . , N }, with N being the final time step. (TSP − 2δ ) represents the required minimal temperature for comfort (cf. (1)). Cr , Row are fixed and given parameters based on the characteristics of the zone heated by the boiler. We represent the term Pin by a new variable Pmn , which is fixed during a day. Pmn represents the mean of the total input power Pin supplied to the boiler over the course of the day and captures the switching on and off of the biomass boiler during the day as a simple daily variable. 5. Tz (t0 ) = Tout [n] and Pocc = Prad = 0, which captures a worst-case discomfort due to the boiler degradation during the heating season. Here Tout [n] represents the worst case equilibrium temperature in the zone reached during the interval when the boiler is switched off.
1. 2. 3. 4.
3
83 84
85 86 87
88 89
90 91 92 93 94 95 96
6. We have access to the daily demanded output power Qout [n] and input power Qin [n] from which η[n] is computed as, Qout [n] η[n] = . (4) Qin [n] z 7. As the efficiency, η → 0 (degradation level is too high) and Tout = Tz , dT dt → 0, hence the boiler will be supplying negligible heat gain to the room and Tz will not reach the required minimal temperature for comfort (TSP − 2δ ). This leads to a maximum discomfort, which is denoted with value discT imemax .
Solving (3) for tη[n] (for each daily time step n), the resulting total time required to reach comfort zone is then given by " # −η[n]Pmn Row tη[n] = Cr Row ln . (5) (TSP − 2δ ) − (η[n]Pmn Row + Tout [n]) 2.1. Computation of discomfort time In order to capture the daily discomfort (for day n), the continuous-time thermal model described above is employed to predict the daily temperature evolution, and the total discomfort time (discT ime) is set as the difference between the time taken to the reach set point comfort zone when operating at maximum efficiency (tη[n] = tηmax ) and the time taken to reach the set point with the efficiency level at day n (tη[n] ). More precisely, the value of tηmax is computed by using (5) with η[n] = ηmax , while the value of tη[n] is computed by again applying (5) with the current η[n]. The quantity discT ime is then: ( (T − δ )−T min{tη[n] − tηmax ), discT imemax } η[n] > SPPmn2Row out discT ime[n] = (6) discT imemax , Otherwise. (T
97 98 99
− δ )−T
The condition η[n] > SPPmn2Row out is introduced to capture discomfort both when the boiler is able to reach the required comfort level and when it is not. When the comfort level is never reached, this condition is not met and the maximum possible discomfort time, discT imemax , which is set to 12 hours, is assigned.
106
Remark 1. Note that when the zone temperature exhibits oscillatory dynamics due to either sufficiently high degradation levels in the boiler (equivalently, sufficiently low boiler efficiency) or when the boiler has been improperly sized and does not supply enough heat to the zone, the zone dynamics do not converge to the set-point as shown in Figure 1. Consequently, the discomfort computation reasoning would need to be further elaborated using the same line of reasoning. In this case, the boiler is assumed to be properly sized and the constant discT imemax is used to give an adequate discomfort penalty when the comfort region is never reached.
107
3. Synthesis of the optimal maintenance strategy
100 101 102 103 104 105
108 109 110 111 112 113 114
We first formalize the fouling process as a dynamic system and select a daily time step such that (i) the transient discomfort metric can be captured and (ii) the overall longer-term contributions of the heating demand can be embedded. We will represent the daily time steps as n = {1, . . . , N }, with N representing the final time horizon. We have access to the daily demanded output power Qout [n] and input power Qin [n] from which we also gain access to the aggregated daily biomass boiler efficiency level η[n] (cf. (4)). The possible states are (Qout , η) ⊂ R2 , and we succinctly represent states as x. The set of all maintenance actions is u[n] ∈ U, U = {0, 1, 2}, where: 0 No Action, U = 1 Clean, (7) 2 Replace.
4
115
As suggested in [11], the following dynamics for Qout , Qout [n + 1] = γQout [n] + (1 − γ)h[n]r[n],
(8)
where h[n] is a boolean function representing the heating season, ( 1 Heating season, h[n] = 0 Otherwise, 116
117 118
119 120 121 122 123 124 125 126 127
and r[n] captures the long-term trend of Qout , � � � � � � � � 2πn 2πn 4πn 4πn r[n] = β0 + β1 cos + β2 sin + β3 cos + β4 sin , 365 365 365 365 where βi , i = {0, . . . , 4} are parameters: this will be further discussed in Subsection 4.1. The efficiency model η is set up as η[n] + αQout [n] u[n] = 0, η[n + 1] = g(η[n]) u[n] = 1, ηmax u[n] = 2.
(9)
(10)
The model depends on the control action performed (u[n]). When no cleaning is performed (u[n] = 0), the efficiency degrades based on the value of Qout [n] and on the previous η[n]. In this case, the parameter (α < 0), related to boiler fouling, is estimated from sampled boiler data, representing Qout and η, by applying the standard lscov Matlab function. If on the other hand cleaning (u[n] = 1) is performed, η[n] is updated based on a given function g(η[n]), which represents the chosen cleaning model. Computation of g(η[n]) will be further discussed in Subsection 4.1. Finally, when a replacement occurs (u[n] = 2), the efficiency level is restored to ηmax . During each period n, the associated costs are a function of the dynamical system and action performed and is expressed as C(x[n], u[n]) = C op (x[n]) + C maint (u[n]) + C disc (x[n]) = pin
128
129 130 131 132
133 134 135 136
Qout [n] + pmaint u[n] + pdisc discT ime[n]. η[n]
(11)
The function is composed of three separate costs, as follows: 1. Operational costs. This is the cost associated with the working of the boiler, with pin representing the monetary fuel costs. The higher the demanded output power and fuel costs, and the lower the efficiency, the higher the operational costs. 2. Maintenance costs. This is due to either the cleaning or to the replacement of the boiler with u[n] = 1, pclean pmaint = preplace u[n] = 2, (12) 0 Otherwise. Here, pclean and preplace represent the constant monetary costs of cleaning and replacement, respectively. 3. Discomfort costs. This cost is due to degraded thermal regulation due to boiler degradation. It is a function of the monetary discomfort cost, pdisc , and of discT ime[n], which is computed using (6). We are interested in the optimal maintenance strategy that minimizes the total costs over a time interval, n = {1, . . . , N }. The optimal maintenance policy is obtained by computing the decision rule 5
π[n] : (Qout , η) → U for all n = {1, . . . N − 1}, such that the total cost N X
C(x[n], u[n])
(13)
n=1 137 138 139 140
is minimised, subject to the state evolution model (representing the dynamics of the system) x[n + 1] = f (x[n], u[n]), and to the control action u[n] = π[n](x[n]), where π[n] is the policy. This can be solved by applying Dynamic Programming (DP) [21, 22]. The DP algorithm starts from the final time horizon N and backward recursively computes value functions V , which are minimized during each time step, V [n](x[n]) = min C(x[n], u[n]) + V [n + 1](x[n + 1]),
(14)
u[n]∈U
142
The optimal policy π[n] is obtained as a look-up table (LUT) expressing the optimal input action to perform for a given Qout and η pair. The employed algorithms are further elaborated in Subsection 4.3.
143
4. Case Study
141
144 145 146 147 148 149 150
We consider data from a real building, involving the heating of a school in Spain by a properly-sized biomass boiler [23]. The school is only operated on weekdays and the heating system is switched on from 08:00 to 15:00, between the first week of November and the last week of February (a total of 14 weeks), with the exception of the last week in December and the first week in January when the building is closed. The biomass boiler input (Pin,d ) 1 and output power (Pout,d ) have been logged for one year, with a 15-minute sampling time. The daily trend of power demand by the boiler, the daily supplied power, and the the mean daily boiler input power are computed using the quantities Qout,d [n] =
nq X k=(n−1)q+1
151 152 153 154
155 156 157 158 159 160 161 162 163
164 165 166 167 168
Pout,d [k],
Qin,d [n] =
nq X k=(n−1)q+1
Pin,d [k],
Pmn,d [n] =
nq X k=(n−1)q+1
Pin,d [k] . q
(15)
Here n = {1, . . . , 365} represents the daily time steps, k is an index representing the aggregation of the 15-minute sampled data per day, and q = 4 × 24 represents the total number of records per day. The boiler efficiency is defined as the ratio between the output power demand and the input power, and it can be derived from Qout,d and Qin,d as Qout,d [n] ηd [n] = . (16) Qin,d [n] Daily weather measurements of the outside air temperature Tout,d [n] have also been recorded. The zone capacitance Cr and Row are given having a value of 54.56J/K and 0.023K/W , while the required set-point TSP and comfort region δ are given as 21o C and ±1o C, respectively. We are interested in optimally scheduling the maintenance of the biomass boiler using the framework presented in Section 3, so that maximal cost savings are attained. Costs relate to energy usage in regular (possibly degraded) daily operation of the boiler, to device maintenance actions, and to occupant discomfort due to boiler degradation within the heating zone. We have selected a prediction horizon of N = 5 × 365 (5 years) and considered daily contributions to the overall costs. The case study and all algorithms are implemented in Matlab R2016b. 4.1. Model of boiler degradation The dynamics for the underlying degradation model are based on two variables representing the evolution of demanded output power Qout and efficiency η respectively (cf. Sec 3). The models assume that the zones are not used during the weekends, and are built based on one year of training data obtained from the Spanish school data set. 1 Throughout
this paper we denote data with variables of the form xd , while models variables as x.
6
169 170 171 172 173 174 175
Model for output power demand. We make use of (8) and create a classifier h[n] that for a given n, a value of one is assigned during the heating season and zero otherwise. Next, we construct the long-term trend r[n] by regressing Spanish school data of Qout,d corresponding to when the heating demand is positive, by means of use of frequency-domain linear regression [24]. This results in (9) with βi , i = {0, . . . , 4} correspond to the values in Table 1 and are obtained by fitting the model using the lscov Matlab function. The resulting parameters are in the order of 105 due to the magnitude of Qout,d values (104 ) which the function is trying to model. The resulting fit has a standard deviation equivalent to 17.01% of the mean. Table 1: Values of regressed parameters βi
Parameter Value (×105 ) 176
ι
178 179
180 181 182 183
β1 -0.581
β2 1.664
β3 0.392
β4 0.291
The parameter γ ∈ [0, 1] is estimated by minimizing the following objective function, namely γ = arg min
177
β0 -1.079
365 X
2
(Qout,d [n] − ιQout,d [n − 1] − (1 − ι)h[n]r[n]) ,
(17)
d=2
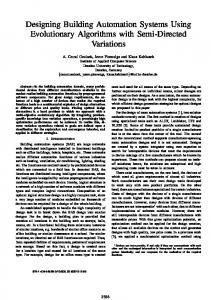
over the whole training data set (365 days). The resulting value is γ = 3.125 × 10⁻¹⁰ , which is due to the overall mean difference between Qout,d and r[n] and leads to a small contribution of the auto-regressive term. Model for efficiency. The efficiency model η is set up using (10). In our case when u[n] = 0, using ηd and Qout,d we get α = −1.074 × 10⁻⁷ kWh−1 . The small order of magnitude of α (10−7 ) is a direct consequence of the large magnitude of Qout which is in the order of 104 . This model corresponds to a 13% efficiency drop over one heating season. If cleaning u[n] = 1 is performed, η[n] is updated based on a given function g(η[n]) as in Figure 2. The trend is computed by fitting the curve, � � � � � � � � a exp − η[n]−b1 2 + a exp − η[n]−b2 2 η[n] < ηmax 1 2 c1 c2 g(η[n]) = (18) ηmax Otherwise,
190
to training data obtained from the rule that the effect of cleaning varies between 7 and 15% depending on the current efficiency level and up to the maximum efficiency level (ηmax ) [25]. Here, a1 = 0.654, b1 = 0.681, c1 = 0.428, a2 = 1.402, b2 = 1.723 and c2 = 0.661. Figure 2 shows that for an initial η[n] >= 0.5, cleaning results in an approximate improvement of 15% (η[n + 1] ≈ 1.15η[n]), whilst for an initial 0.1 < η[n] < 0.5, cleaning results in an approximate 7% of overall improvement (η[n + 1] ≈ 1.07η[n]). For η[n] < 0.1, the cleaning effect saturates to 0.08. When a total replacement occurs (u[n] = 2), the efficiency level is restored to ηmax = 0.8.
191
4.2. Regression functions for prediction of the time spent in discomfort
184 185 186 187 188 189
192 193 194 195 196 197 198 199 200
We are interested in optimally scheduling maintenance based on the dynamic fouling model, composed using the states (Qout , η), and the total costs (operational, maintenance and discomfort costs). Using the state-space models we obtain the operational and maintenance costs directly (cf. (11)). However, to compute the discomfort costs, we need to predict discT ime over the required time horizon using (6). discT ime is a function of the dynamic variables η, Tout and Pmn and the fixed variables Cr , Row , δ and TSP (these are given). Consequently, to predict discT ime using the fouling model, we need to construct models which relate the Qout to Tout and Qout to Pmn . The Spanish data set contains the following variables, Qout,d , Qin,d , Tout,d and Pmn,d , which allows us to construct the required regression functions to relate Qout to Tout and Qout to Pmn . 7
η after cleaning
0.8 0.6 0.4 0.2 0
0 5 · 10−2 0.1
0.15
0.2
0.25
0.3
0.35
0.4
0.45
0.5
0.55
0.6
0.65
0.7
0.75
0.8
η before cleaning Figure 2: The imperfect cleaning model g(η[n]), incorporating the effect that for high initial values of η the effect of cleaning is large, while for low initial values of η the effect of cleaning is low. The value of η following cleaning saturates at a maximum value of η = 0.8 and at a minimum value of ηmin = 0.08.
201 202
203
Regression models relating Qout and Tout . Two candidate regression models that relate Qout and Tout are found by considering the recorded Spanish weather data. • Candidate 1: The linear model Tout [n] = β
204
205
207 208
θ
209
eγ
Qout [n]−µ σ
ψ
−α
.
(20)
Here, µ and σ are the mean and standard deviation of Qout,d . The exponential model is considered in this section due to the exponential relationship between Qout and Tout obtained by considering the linear relationship between Qout and Pout and then the exponential relationship between Pout and Tout as can be seen from (3). For both models, the unknown parameters can be estimated by solving, min
210
(19)
• Candidate 2: - The exponential model Tout [n] =
206
Qout [n] − µ + ζ, σ
L X (v[n] − w[n, θ])2 .
(21)
l=1
Here θ are the parameters to be estimated, l is an index representing the training data having a total length L = 365 and v[n] = Tout,d [n]. For the case of the linear model w[n, θ] = β Qoutσ[n]−µ + ζ with γ
211 212 213 214 215
216 217 218
219 220
Qout,d [n]−µ
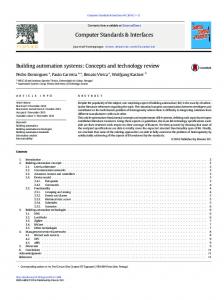
σ −α θ = [β, ζ]T , while for the case of the exponential model w[n, θ] = e with θ = [γ, α, ψ]T ψ and with µ = 9.84 × 10³ , σ = 5.78 × 10³ representing the mean and standard deviation of Qout,d respectively. The resulting parameter values from this minimisation are β = −0.3743 and ζ = 1.847 for the linear model, γ = −0.4932, α = 0, ψ = 0.4840 for the exponential model. The resulting fit for both candidates is shown in Figure 3.
The exponential model is chosen as the best model to compute the value of Tout from Qout as it achieved the lowest RMSE (the linear model achieved an RMSE value of 2.378, whereas the exponential model has an RMSE value of 2.278). Regression models relating Qout and Pmn . A similar approach is carried out to regress the relationship between Qout and Pmn such that predictions of the total time in discomfort can be made. In this case, as 8
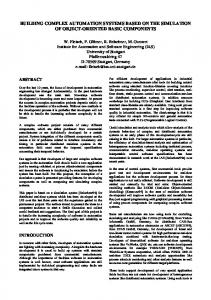
221 222
intuitive only a linear model is considered, and the recorded data for the mean input power during a day, Pmn,d is used (cf. (15)). The resulting model is given by Pmn [n] = β1 Qout [n] + ζ1
(22)
225
where β1 = 4.262 × 10⁻² and ζ1 = 210. The parameters are estimated once again using (21) with θ = (β1 , ζ1 )T , v[n] = Pmn,d [n] and w[n, θ] = β1 Qout,d [n] + ζ1 . The resulting fit is shown in Figure 4. The model fitness has a RMSE value of 99.6.
226
4.3. Solution of the dynamic programming problem
223 224
227 228 229 230 231 232 233 234
Using the defined state evolution models and cost functions the optimal maintenance problem is solved by employing the DP framework. We consider two modalities for performing the soot cleaning actions: on-load and off-load [26, 27]. The biomass boilers can be cleaned while it is running by being fitted with retractable soot blowers which perform cleaning (on-load). Alternatively and conventionally, soot cleaning can be performed when the boiler is disconnected (off-load). Two algorithms are proposed each representing a different type of cleaning modality (on-load and off-load cleaning). Algorithm 1 considers the off-load scenario incorporating a total of one time delay to perform a cleaning action, while Algorithm 2 assumes that the maintenance actions are carried out instantaneously, which is the case when on-load cleaning is carried out. Algorithm 1: Dynamic Programming Algorithm for off-load cleaning input : model (Qout , η) output: V function for given parameters, π(x[n]) decision rule for each given state 1 Start at final time step N 2 V [N ](x[N ]) ← ∞ 3 forall the n = N − 1 : 1 do 4 if u = 0 then 5 V [n](x[n]) = {C op (x[n]) + C discc (x[n]) + Vn+1 (f (x[n], 0))} 7
else V [n](x[n]) = minu[n]∈{1,2} {C(x[n], u[n]) + C((0, 0), u[n]) + Vn+1 (f (x[n], u[n]))}
8
π[n](x[n]) = arg minu[n]∈U {C(x[n], u[n]) + Vn+1 (f (x[n], u[n]))}
6
235
237
For both algorithms, one must discretise the state space over the selected minimum and maximum bounds ([η min = 0.03, η max = 0.8] and [Qout max = 2.5 × 10⁴ , Qout min = 0]). The value function for each of the Outside temperature, Tout
236
Qout vs Tout Exponential Fit Linear Fit
10 5 0 0
0.2
0.4
0.6
0.8 1 1.2 1.4 1.6 Output power consumption, Qout
1.8
2
2.2 ·10
2.4 4
Figure 3: Resulting model fit between Qout and Tout . The exponential function is seen to have a better fit to the data.
9
Mean power, Pmn
Qout vs Pmn Linear fit 1,000
500 0.8
1
1.2
1.4 1.6 1.8 2 Output power consumption, Qout
2.2
2.4
2.6 4
·10
Figure 4: Resulting model fit between Qout and Pmn .
Algorithm 2: Dynamic Programming Algorithm for on-load cleaning input : model (Qout , η) output: V function for given parameters, π(x[n]) decision rule for each given state 1 Start at final time step N 2 V [N ](x[N ]) ← ∞ 3 forall the n = N − 1 : 1 do 4 V [n](x[n]) = minu[n]∈U {C(x[n], u[n]) + Vn+1 (f (x[n], u[n]))} 5 π[n](x[n]) = arg minu[n]∈U {C(x[n], u[n]) + Vn+1 (f (x[n], u[n]))}
241
discretised states is then computed at each time step, recursively (cf. (14)). In the case of off-load cleaning one needs to incorporate the effect that maintenance actions take up to one day to be carried out. This is introduced as an additional cost penalty into the value function computation step corresponding to a day where Qout = 0 since the boiler is not running (cf Algorithm 1 Line 7).
242
5. Case study: results
238 239 240
243 244 245 246 247 248
We synthetise optimal maintenance strategies, using the developed algorithm for both on-load and offload cleaning, with a prediction time horizon considered set to N = 5 years. First, we consider two experiments to show the effect of discomfort monetisation on the resulting policy. For each experiment, we use the following prices (i) pin = e0.27/kg 2 (ii) pclean = e108.90, preplace = e5000 3 and (iii) pdisc = e100/day [23]. In all cases, we encode the resulting control actions as follows - Dark Blue: Replace boiler; Light Blue: Clean Boiler; White: No Action.
249 250 251 252
253 254 255
256 257
Experiment 1: Presence vs absence of discomfort. Figure 5 shows the resulting look-up tables (LUT) for the optimal control actions as a function of η values. The LUT are generated using Algorithm 1. Remark 2. The resulting optimal maintenance strategy can be seen to be qualitatively periodic within each heating season due to the periodic trend of the demanded output power (cf. (9)). However, this periodicity is only approximate, due to the differences in the initial η and Qout at the beginning of each heating season. In order to further clarify the effect of incorporating discomfort monetisation zoomed up versions of Figure 5 showing the resulting LUT for the heating season in 2014 and 2015 is presented. From Figure 6(a), 2 http://www.avebiom.org/es/noticias/News/show/precios-del-pellet-en-espana-653 3 http://www.tucalderabarata.es/reparacion-de-calderas/
10
η
η
0.8 0.69 0.59 0.49 0.38 0.28 0.18 0.08 0.03 2015
2016
2017 2018 Time (Years)
2019
2020
0.8 0.69 0.59 0.49 0.38 0.28 0.18 0.08 0.03 2015
2016
2017 2018 Time (Years)
2019
2020
(b) The resulting decision strategy when pdisc = e0/day.
(a) The resulting decision strategy when pdisc =e100/day
Figure 5: The resulting LUT for the optimal control actions when (a) discomfort costs are included and (b) not included. The control actions are colour coded using - Dark Blue: Replace boiler; Light Blue: Clean Boiler; White: No Action.
259 260 261 262 263 264 265 266 267
η
268
it can be seen that when we consider discomfort in the optimal policy computation, cleaning actions are only performed on weekends when it is expected that the boiler is operated throughout the rest of the week. This minimises the effect of discomfort experiencedhad boiler maintenance been performed when the building is in use. For weeks 2 to 7 and weeks 14 and 15, when 0.11 < η < 0.18 replacement is carried out during weekends. For weeks 10 to 13, this replacement is performed when 0.13 < η < 0.19. This is due to the higher expected Qout . When η ≤ 0.13 for weeks 10 to 13 and η ≤ 0.11 for the rest of the weeks excluding week 8, the cost of operation is much larger then the cost of discomfort and thus maintenance actions are performed on weekdays. On the other hand, from Figure 6(b) we deduce that when discomfort is not considered, cleaning actions are performed both on weekdays and weekends for all weeks excluding week 8. No maintenance actions are performed on Saturday due to the one step ahead prediction of a no power demand Qout since the boiler is switched off on Sunday. No maintenance actions are performed in week 8 for both scenarios as the boiler is switched off throughout the whole week. 0.8 0.69 0.59 0.49 0.38 0.28 0.18 0.08 0.03
η
258
1 2 3 4 5 6 7 8 9 10 11 12 13 14 15 1617 Time (Weeks)
0.8 0.69 0.59 0.49 0.38 0.28 0.18 0.08 0.03
1 2 3 4 5 6 7 8 9 10 11 12 13 14 15 1617 Time (Weeks)
(a) Optimal Maintenance strategy that incorporates discom- (b) Optimal Maintenance strategy that does not incorporate fort costs. All cleaning actions are carried out during week- discomfort costs. All cleaning actions can be performed both ends. during weekdays or weekends. Figure 6: Optimal Maintenance strategy that (a) presence vs (b) absence of discomfort costs over one heating season (from Monday of the first week of November 2014 up to Sunday of the last week of February 2015). The control actions are colour coded using - Dark Blue: Replace boiler; Light Blue: Clean Boiler; White: No Action. 269 270
For these two scenarios, we perform a set of 103 simulation runs where we obtain an initial efficiency 11
271 272 273 274 275 276 277 278 279
Reduction in total discomfort (%)
280
level by sampling a uniform distribution between the range [0.03, 0.8] and with Qout fixed to 1.183 ×10⁴ (corresponds to initial value found in Spanish school data set), are performed. For each run ((i) using LUT generated using pdisc = e100/day; (ii) using LUT generated using pdisc =e0/day), we further compute the total discomfort cost incurred when the optimal maintenance strategy is employed and the total reduction in discomfort cost achieved by the DP that considers the discomfort costs. The resulting total reduction in discomfort is shown in Figure 7. It can be seen that the total reduction in discomfort is a function of the initial efficiency level, η. For 0.11 < η < 0.14, we achieve higher discomfort savings , due to extra discomfort penalty associated with not replacing the boiler. We obtain no discomfort savings for the ranges η < 0.09 and 0.76 < η, as the same control actions are performed in both scenarios (cf. Figure 6). An overall average savings of 15.76% is also deduced.
80 60 40 20 0
0 5 · 10−2 0.1
0.15
0.2
0.25
0.3
0.35
0.4
0.45
0.5
0.55
0.6
0.65
0.7
0.75
0.8
Initial efficiency level, η
Figure 7: The resulting reduction in total discomfort costs for different initial η values. When 0.11 < η < 0.14, we achieve higher discomfort savings are achieved due to extra discomfort penalty associated with not replacing the boiler. For η < 0.09 and 0.76 < η, the same control actions are performed in both scenarios resulting in no discomfort savings. 281 282 283 284 285 286 287 288 289 290
291 292 293 294 295 296 297 298 299
Experiment 2: On-load cleaning (instantaneous) vs Off-load cleaning (1 day delay). A comparison is made between the two algorithms (Algorithm 2 and 1). Figure 8(a) and 8(b) depict zoomed up versions of the resulting LUT for 2015-2016 heating season when using Algorithm 1 and 2 respectively. From Figure 8(a), we deduce that when employing on-load cleaning , all cleaning actions are carried out during weekdays. An extra cleaning action is introduced for η ≤ 0.14 and is performed on Saturdays. In this case, the cost of discomfort has minimal effect on when to perform maintenance actions. On the other hand, from Figure 8(b) it is clear that the cost of discomfort directly limits when maintenance actions are performed. All cleaning actions are performed during weekends. This is desirable as performing cleaning during weekdays would result in discomfort as the heating zone is in use and would need to be taken off-load. 5.1. Energy savings We perform a comparison between the developed algorithm and standard cleaning policies carried out in the industrial practice, in order to estimate the total energy savings gained by the proposed algorithms, using a set of 103 simulations. In all instances, we obtain the initial degradation level from sampling a uniform distribution between the range [0.03, 0.8] and Qout is fixed to 1.183 ×10⁴ (corresponds to initial value found in Spanish school data set). We use a time horizon of N = 5 years and do not include the discomfort and the control action equivalent to a boiler replacement in order to be able to make a direct comparison with standard practices where replacement actions are only performed after a longer time horizon (typically N = 15 years). A condition-based function is extracted from the generated optimal policies ( Clean 0.76 ≤ η[n], u[n] = (23) No Action Otherwise. 12
η
η
0.8 0.69 0.59 0.49 0.38 0.28 0.18 0.08 0.03
1 2 3 4 5 6 7 8 9 10 11 12 13 14 15 1617 Time (Weeks)
0.8 0.69 0.59 0.49 0.38 0.28 0.18 0.08 0.03
1 2 3 4 5 6 7 8 9 10 11 12 13 14 15 1617 Time (Weeks)
(a) Resulting decision strategy when the instantaneous clean- (b) Resulting decision strategy when the delayed cleaning acing action is employed. For η ≤ 0.14 an extra cleaning action tion is employed. Cleaning actions carried out during weekends is performed on every Saturday during the heating season. due extra discomfort penalty introduced by Algorithm 2 (Line 7). Figure 8: The optimal maintenance strategies obtained when employing (a) Algorithm 1 and (b) Algorithm 2. In both figures, the control actions are colour coded using - Dark Blue: Replace boiler; Light Blue: Clean Boiler; White: No Action.
300 301
Here, η[n] = 0.76 is chosen as it is the maximum value beyond which no maintenance actions are performed as deduced from the resulting LUTs (Figure 6). Table 2: Energy Savings Comparison
Strategy
Total Costs
Off-load cleaning DP On-load cleaning DP Condition based Weekly cleaning during heating season Six Month cleaning Annual cleaning
2.175 2.171 2.191 3.105
Maintenance tions
×106 ×106 ×106 ×106
2.455 ×10⁶ 3.474 ×10⁶
Ac-
Savings compared to Off-load Cleaning DP
16 15 14 70
0% 0.15% 0.75 % 42.79%
9 5
12.89 % 59.73%
310
We tabulate the results obtained from this analysis in Table 2. From the outcomes, we confirm that the most effective energy policy is obtained when the DP algorithm is employed, with comparable energy savings between the on-load and off-load cleaning algorithms. The off-load strategy (introduces an additional cost during the off-load period which is only due to discomfort and the maintenance action being performed as the boiler is not operational) compared to the on-load strategy requires that an additional maintenance action is performed. This additional maintenance strategy keeps the boiler operating at higher efficiency levels and since the cost of maintenance and discomfort are much lower then the cost of degraded boiler operation, there is a slight reduction in the overall costs due to operation (C op (x[n])) which leads to more energy savings being gained by the off-load strategy.
311
6. Conclusions
302 303 304 305 306 307 308 309
312 313 314
The paper presents a methodology for quantifying discomfort due to boiler degradation, and a corresponding optimisation algorithm based on dynamic programming algorithm that schedules a strategy for optimal boiler maintenance. The work encompasses dynamics at two different time scales: (i) daily dynamics 13
322
for the prediction of discomfort, and (ii) long-term dynamics that are key for maintenance strategies. The resulting strategy allows for different actions based on the cleaning technique employed by contractors (partial cleaning vs replacement). This results in more realistic predictive maintenance strategies, with effective cost and energy savings. The presented framework can be further enhanced with a dynamic discomfort monetisation function, and by incorporating predictive models representing solar heat gain and building occupancy. The dynamic programming algorithm may also be enriched by incorporating time delays in the state evolution models to represent different time delays introduced by different cleaning and replacement maintenance methods.
323
Acknowledgements
315 316 317 318 319 320 321
326
This work has been funded by the European Commission in the Seventh Framework Programme project AMBI (Grant Agreement no. 324432). This work is in part supported by the Alan Turing Institute, London, UK and Malta’s ENDEAVOUR Scholarships Scheme.
327
References
324 325
328 329 330 331 332 333 334 335 336 337 338 339 340 341 342 343 344 345 346 347 348 349 350 351 352 353 354 355 356 357 358 359 360 361 362 363 364 365 366 367 368 369
[1] C. B¨ ohringer, A. L¨ oschel, U. Moslener, T. F. Rutherford, EU climate policy up to 2020: An economic impact assessment, Energy Economics 31 (2009) S295–S305. [2] N. S. Bentsen, M. W. Jack, C. Felby, B. J. Thorsen, Allocation of biomass resources for minimising energy system greenhouse gas emissions, Energy 69 (2014) 506–515. [3] D. Tonini, C. Vadenbo, T. F. Astrup, Priority of domestic biomass resources for energy: Importance of national environmental targets in a climate perspective, Energy 124 (2017) 295 – 309. [4] B. A. Qureshi, S. M. Zubair, Predicting the impact of heat exchanger fouling in power systems, Energy 107 (2016) 595 – 602. [5] L. Wang, J. Chu, J. Wu, Selection of optimum maintenance strategies based on a fuzzy analytic hierarchy process, International Journal of Production Economics 107 (1) (2007) 151–163. [6] V. Babishin, S. Taghipour, Optimal maintenance policy for multicomponent systems with periodic and opportunistic inspections and preventive replacements, Applied Mathematical Modelling 40 (2324) (2016) 10480 – 10505. [7] X. Zhou, L. Xi, J. Lee, Reliability-centered predictive maintenance scheduling for a continuously monitored system subject to degradation, Reliability Engineering & System Safety 92 (4) (2007) 530–534. [8] L. Pattanayak, S. P. K. Ayyagari, J. N. Sahu, Optimization of sootblowing frequency to improve boiler performance and reduce combustion pollution, Clean Technologies and Environmental Policy 17 (7) (2015) 1897–1906. [9] H. Zhao, F. Magoul` es, A review on the prediction of building energy consumption, Renewable and Sustainable Energy Reviews 16 (6) (2012) 3586–3592. [10] J. Berka, K. Macek, Effective maintenance of stochastic systems via dynamic programming, Proc. Technical Computing Prague 2011, Prague: Czech Republic. [11] K. Macek, P. Endel, N. Cauchi, A. Abate, Long-term predictive maintenance: A study of optimal cleaning of biomass boilers, Energy and Buildings 150 (2017) 111 – 117. [12] R. Valancius, A. Jurelionis, V. Dorosevas, Method for cost-benefit analysis of improved indoor climate conditions and reduced energy consumption in office buildings, Energies 6 (9) (2013) 4591–4606. [13] M. M. Tehrani, Y. Beauregard, M. Rioux, J. P. Kenne, R. Ouellet, A predictive preference model for maintenance of a heating ventilating and air conditioning system, IFAC-PapersOnLine 48 (3) (2015) 130 – 135. [14] K. Nikhil, M. C. Kurian, Selection of optimum maintenance approach based on analytic hierarchy process (AHP), International Journal of Engineering Development and Research 4 (2016) 454–459. ¨ [15] H. Maula, V. Hongisto, L. Ostman, A. Haapakangas, H. Koskela, J. Hy¨ on¨ a, The effect of slightly warm temperature on work performance and comfort in open-plan offices-a laboratory study, Indoor air 26 (2) (2016) 286–297. [16] W. Cui, G. Cao, J. H. Park, Q. Ouyang, Y. Zhu, Influence of indoor air temperature on human thermal comfort, motivation and performance, Building and environment 68 (2013) 114–122. [17] A. Aswani, N. Master, J. Taneja, A. Krioukov, D. Culler, C. Tomlin, Quantitative methods for comparing different hvac control schemes, in: Performance Evaluation Methodologies and Tools (VALUETOOLS), 2012 6th International Conference on, IEEE, 2012, pp. 326–332. [18] M. Maasoumy, A. Sangiovanni-Vincentelli, Total and peak energy consumption minimization of building HVAC systems using model predictive control, IEEE Design Test of Computers 29 (4) (2012) 26–35. [19] P. Bacher, H. Madsen, Identifying Suitable Models for the Heat Dynamics of Buildings, Energy and Buildings 43 (7) (2011) 1511–1522. [20] S. Baldi, S. Yuan, P. Endel, O. Holub, Dual estimation: Constructing building energy models from data sampled at low rate, Applied Energy 169 (2016) 81–92. [21] D. P. Bertsekas, Dynamic programming and optimal control, Vol. 1, Athena Scientific Belmont, MA, 1995.
14
370 371 372 373 374 375 376 377 378 379 380 381 382 383
[22] B. kugor, J. Deur, Dynamic programming-based optimisation of charging an electric vehicle fleet system represented by an aggregate battery model, Energy 92, Part 3 (2015) 456 – 465, sustainable Development of Energy, Water and Environment Systems. [23] M. Schmidt, M. V. Moreno, A. Sch¨ ulke, K. Macek, K. Maˇr´ık, A. G. Pastor, M. Schmidt, M. V. Moreno, A. Schlke, K. Macek, K. Mak, A. G. Pastor, Optimizing legacy building operation: The evolution into data-driven predictive cyberphysical systems, Energy and Buildings 148 (2017) 257 – 279. [24] R. H. Shumway, D. S. Stoffer, Time series analysis and its applications: with R examples, Springer Science & Business Media, 2010. [25] T. Morley, What you need to know about biomass boiler servicing., Greenpower Technology Online resource, accessed December 2016. [26] A. Valero, C. Cortes, Ash fouling in coal-fired utility boilers. Monitoring and optimization of on-load cleaning, Progress in energy and combustion science 22 (2) (1996) 189–200. [27] A. Bianchini, F. Cento, L. Golfera, M. Pellegrini, C. Saccani, Performance analysis of different scrubber systems for removal of particulate emissions from a small size biomass boiler, Biomass and Bioenergy 92 (2016) 31 – 39.
15