suggested that, during steady swimming, the red muscle fibers operate over a ..... of the fish's mass composed of red muscle and multiplying this by the mass ...
Modeling red muscle power output during steady and unsteady swimming in largemouth bass TIMOTHY P. JOHNSON, DOUGLAS A. SYME, BRUCE C. JAYNE, GEORGE V. LAUDER, AND ALBERT F. BENNETT Department of Ecology and Evolutionary Biology, University of California, Irvine, California 92717; and Department of Biological Sciences, University of Cincinnati, Cincinnati, Ohio, 45221-0006 Johnson, Timothy P., Douglas A. Syme, Bruce C. Jayne, George V. Lauder, and Albert F. Bennett. Modeling red muscle power output during steady and unsteady swimming in largemouth bass. Am. J. Physiol. 267 (Regulatory Integrative Comp. Physiol. 36): R481-R488, 1994.-We recorded electromyograms of slow-twitch (red) muscle fibers and videotaped swimming in the largemouth bass (Micropterus salmoides) during cruise, burst-and-glide, and C-start maneuvers. By use of in vivo patterns of stimulation and estimates of strain, in vitro power output was measured at 20°C with the oscillatory work loop technique on slow-twitch fiber bundles from the midbody area near the soft dorsal fin. Power output increased slightly with cycle frequency to a plateau of - 10 W/kg at 3-5 Hz, encompassing the normal range of tail-beat frequencies for steady swimming (-2-4 Hz). Power output declined at cycle frequencies simulating unsteady swimming (burst-and-glide, 10 Hz; C-start, 15 Hz). However, activating the muscle at 10 Hz did significantly increase the net work done compared with the work produced by the inactive muscle (work done by the viscous and elastic components). Thus this study provides further insight into the apparently paradoxical observation that red muscle can contribute little or no power and yet continues to show some recruitment during unsteady swimming. Comparison with published values of power requirements from oxygen consumption measurements indicates a limit to steady swimming speed imposed by the maximum power available from red muscle. swimming fish; electromyography; largemouth bass
oscillatory
work; red muscle;
USE DIFFERENT locomotor behaviors to swim at different speeds. For example, the largemouth bass (Micropter us salmoides) swims slowly (< 1 bodylength/s) using pectoral fin locomotion and switches to undulations of the body and caudal fin (subcarangiform) locomotion at higher speeds. The power required to achieve higher speedsincreases approximately as a cubic function of swimming speed (ZO), and this increasing demand for power is met partially by the sequential recruitment of faster muscle fiber groups (26, 30). Consequently, a key determinant of swimming performance is the power available from the muscle groups recruited during different locomotor behaviors. Rome et al. (25) found that carp (Cyprinus carpio) use steady subcarangiform swimming at speeds between 20 and 45 cm/s at 20°C and that burst-and-glide swimming is used at both faster and slower speeds. These authors suggested that, during steady swimming, the red muscle fibers operate over a narrow range of shortening velocities, where power output is at or near maximal. When fish are swimming at slow and high speeds, the burstFISH
0363-6119/94
$3.00
Copyright
o 1994
and-glide swimming style presumably allows the red (slow-twitch) and the white (fast-twitch) muscle fibers to operate at shortening velocities where power output is again near maximal. Thus Rome et al. concluded that the shortening velocity for maximal power output of muscle is a design constraint on swimming speed and a major determinant of swimming behavior in this fish. In the above study, Rome et al. (25) estimated red muscle power output using force-velocity measurements (isotonic shortening), which may be misleading if one is interested in normal muscle activity in vivo (33). The oscillatory work loop technique, which can more accurately impose the muscle’s in vivo patterns of strain and activation, has also been used to measure power output from fish muscle (2-4, 14, 15, 21, 28, 29). However, few studies (4,28,29) have attempted to approximate in vivo patterns of both activation and strain. Rome and Swank (28) measured red muscle power output at 10 and 20°C in scup (Stenotomus chrysops) using stimulation duration and strain amplitude obtained from swimming animals; stimulus duration was taken as the time from electromyogram (EMG) onset to offset; tail-beat frequency was taken as the frequency of EMG bursts; strain was obtained from kinematic studies on a separate group of animals, but stimulus phase was not available and was adjusted to maximize work. Using these in vivo and estimated parameters, Rome and Swank found that power output in vivo was maximal at 20°C (i.e., power output could not be increased by altering strain or stimulus duration); however, at 10°C the muscle produced less power using in vivo parameters than it was capable of producing (i.e., power could be increased above that obtained with in vivo parameters). Thus stimulation and strain parameters that produce maximum power in vitro and those during normal activity in the intact animal are not necessarily related. In this investigation, EMG and kinematic data were obtained during cruise, burst-and-glide, and C-start swimming in largemouth bass to obtain relevant parameters describing muscle activation in vivo. Red muscle power output was then measured with the oscillatory work loop technique by use of the experimentally measured in vivo parameters, which included muscle strain, duration of activation, and stimulus phase. Our goals were 1) to apply a complete set of in vivo strain and stimulation parameters to the study of force generated by red muscle during fish locomotion, and 2) to assess the importance of the power available from the red muscle in determining the transition in swimming behaviors as speed increases. the American
Physiological
Society
R481
R482
RED
MUSCLE
POWER
OUTPUT
DURING
FISH
SWIMMING
METHODS
Animals. Largemouth bass (Micropterus salmoides Lacepede) were collected from ponds in Fresno, CA in 1990 by seine net (California Fish and Game Collectors Permit no. 0164). Animals were maintained in aquaria at 20-22OC on a 12:12-h photoperiod and fed ad libitum with small goldfish. The fish used for EMG studies ranged in length from 20 to 24 cm and in weight from 110 to 260 g. EMG and kinematic data were collected as described below, and then six different fish (21-25 cm, 163-225 g), chosen at random from this same collection, were used in the in vitro muscle studies. All animals appeared healthy and had fed well in the laboratory for months before the experiments. EMG. Fish were anesthetized with a 0.06% buffered solution of tricaine methanesulfonate (MS-222); during electrode implantation, anesthesia was maintained with a 0.03% solution. Bipolar electrodes were similar to those described by Jayne (11). About 0.6 mm of insulation was stripped off the ends of stainless steel wire (0.051 mm diam, - 2 m long). The electrodes were implanted into the fish percutaneously by use of 26-gauge hypodermic needles. Electrodes were inserted into superficial red axial muscle approximately four vertebrae apart at a total of 13 sites along the body of the fish. Data from all these sites will be published elsewhere. EMGs from one site near the posterior margin of the soft dorsal fin [ - 0.70 body lengths (BL)] were used in this investigation (Fig. 1: emg). This site was chosen because previous work in other species showed that muscle fibers at this location do primarily negative work (34). Fish were allowed to recover for - 3 h before the experiments were started. All locomotor trials were conducted in a calibrated flow tank with a working section of 40 x 20 X 20 cm at a water temperature of 20°C. EMGs were amplified 10,000 or 20,000 times by use of preamplifiers (model P51 lK, Grass) with high and low bandpass filter settings of 100 Hz and 3 kHz and a 60-Hz notch filter. The EMGs were recorded with a TEAC XR-5000 FM data recorder with a tape speed of 9.5 cm/s. The EMGs were played back at one-eighth recording speed into a Keithley analog-to-digital converter that sampled data at 1 kHz, allowing an effective sampling rate of 8 kHz for the digital EMGs. Because the rapid movements of the unsteady swimming behaviors often caused considerable low-frequency artifacts, the digital EMGs were filtered using a finite impulse response filter that reduced the portion of the signal below 100 Hz to < 10% of its original amplitude. The times of onset and offset of muscle activity during each swimming behavior were quantified to the nearest millisecond with custom software. The onset time of muscle activity was compared with the strain pattern estimated for the same site (see below) to determine the phase of stimulation. Kinematics. Locomotor trials were videotaped with a NAC HSV-400 high-speed video system operating at either 200 or 400 images/s. Both lateral and ventral images of the fish during locomotion were obtained simultaneously. A pulse generator provided a lOO-Hz square-wave signal that was placed on both the video image and the FM tape recorder to allow synchronization of the video images and EMGs to within 2.5 ms. Four consecutive tail beats were digitized at each speed, and between 16 and 24 individual video images were digitized per tail beat. We used a custom video digitizing program to measure the x- and y-coordinates of - 25-30 points that were manually placed along both the right and left sides of the fish (Fig. 1). For each resulting digitized image, midlines were reconstructed by using an iterative computer algorithm. Initially, cubic splines were fitted to the (digitized) coordinates of
0 0
l l 0
0 a 0 0 0
the left and right sides, and then these functions were used to calculate the coordinates of 500 points along each side of the fish. As a first approximation, a line segment was constructed between points on the left and right sides (located 1/30th of a fish length posterior to the snout), and then the midpoint of this line segment was determined. The algorithm then searched for the one point (of the 500 points) on each side of the fish that was nearest the midpoint of the line segment. If the distances between the midpoint and the nearest points on the left and right sides were unequal, then another point on the line segment (connecting the left and right sides) was selected if it decreased the discrepancy between the distances to the nearest points on the left and right sides. For this new point between the left and right sides, another search procedure located the nearest point from the cubic splines of the left and right sides, and these procedures were repeated until they converged on a solution. These iterative procedures for finding the midpoint along a line connecting left and right sides were applied to 30 locations spaced at equal intervals along the left and right sides; hence 30 points formed the initial midline reconstruction (including the snout and the tail tip). Cubic spline functions were fitted to these initial 30 points and then were used to generate a high density of points (500) to form the final reconstructed midline. After completion of each experiment, an X ray was taken of that individual, and the lengths of each of the major axial structures (skull, vertebrae, and hypural bones) were measured. Using these anatomic measurements, each computed midline was then partitioned into line segments with lengths corresponding to that of the skull, indi-
RED
MUSCLE
POWER
OUTPUT
vidual vertebrae, the tail bones (hypurals), and the caudal fin divided into five equal segments. For each video image we were thus able to calculate the angle of lateral bending between all pairs of adjacent axial segments. Our values of lateral vertebral flexion (6), measured in degrees, were converted to estimates of the percentage of resting muscle length, with the assumption that the superficial, longitudinally oriented fibers, located at the widest part of the fish, were keeping pace with the changing curvature of the fish. The estimate is based on multiplying the ratio of the lateral-to-midline radii of curvature by 100, which equals 100 x [L/(2 x sin 6/2) - W/2]/[L/(2 x sin s/2)], where L is the average vertebral length of the pair of vertebrae, and W is the width of the body at that particular intervertebral joint. We quantitatively analyzed synchronized EMGs and kinematics for steady undulatory swimming (from 0.7 to -2.4 L/s), burst-and-glide swimming, and C-start escape responses. Four individual fish were analyzed for the steady-swimming experiments, and four different individual fish were analyzed for the burst-and-glide swimming. Values shown in Table 1 are within the range of values that we determined experimentally for steady undulatory and burst-and-glide swimming. Escape responses (C-starts) in fish can be divided into two separate stages (8); in stage 1 the fish bends into the characteristic “C shape”; stage 2 consists of the “return flip” of the tail. For the C-starts, we quantified only the duration of stage 1 muscle activity from experiments on two individual fish, and we estimated the lag time from the EMG onset to the first perceptible movement by qualitatively viewing a frame-byframe playback of the videotape (obtained at 400 fields/s) that was synchronized with the EMG recordings. We then assumed that the maximal bending at the end of the C-start was slightly greater than that which had been quantified for the burst-andglide swimming. Hence our estimates for strain and phase of muscle activity during escape behavior were less precise than those for the other behaviors. Work in isolated muscle fibers. Fish were killed by a blow to the head followed by decapitation. We used red muscle fibers from the midlateral region, the longitudinal position for which corresponded to the middle of the soft dorsal fin, where EMG measurements were also made (Fig. 1). A segment of muscle 4-5 cm long was dissected from one side of the fish, and the skin was removed. A thin strip of red muscle was then removed from around the lateral line. Fiber bundles 4-5 mm long [2.2 t 0.3 (SD) mg] were isolated by further dissection, and foil clips were attached around the myosepta (16). Dissections were made in Ringer solution at 10°C; its composition (in mM) was 119 NaCl, 2.7 KCl, 1 MgCIZ, 1.8 CaCIB, 20 NaHC03, and 10 sodium pyruvate. The pH was maintained at 7.4 by bubbling with 95% 025% COZ. The Ringer solution was a modification of that used by Langfeld et al. (19) for carp, the bicarbonate concentration being increased to yield pH 7.4 at the experimental temperature of 20°C. The preparations were attached via the foil clips to a force transducer (ESU-060-1000, Entran; sensitivity 1 g/V I~I0.02%) at one end and to the arm of a Cambridge ergometer (model 350) at the other. Force and length were monitored using an IBM computer, a Metrabyte analog-to-digital converter (17 kHz sampling rate), and custom software. Muscles were stimulated using a Grass S48 stimulator connected to a current amplifier with supramaximal stimuli (50 V, 0.5- to 1-ms pulse duration), with the frequency adjusted to produce a maximally fused tetanus. Resting muscle length was set at that required to achieve maximal isometric tetanic force. After dissection, preparations were given a l-h “recovery” period; during this time isometric twitch force increased significantly. At the full recovery of twitch force, the time to half-twitch
DURING
FISH
SWIMMING
R483
relaxation was 66.8 t 8.1 (SE) ms (n = 6), and time to peak tension was 42.6 * 3.2 ms (n = 6), whereas these times for a single fast-twitch (white) fiber preparation (from the same site) were 21 and 11 ms, respectively. During work measurements, muscle length was varied sinusoidally about its resting value by using the ergometer (to t 1 pm). We adjusted the cycle frequency, timing and duration of stimulation, and strain amplitude to match in vivo values of intact swimming animals (see above and Table 1). The timing of stimulation onset in relation to the strain cycle (phase) is presented in degrees (360” = cycle duration; 0” represents resting length halfway through the lengthening cycle). Strain, the amplitude of the length change imposed on the muscle, is presented as a peak-to-peak value (i.e., at a 12% strain, the preparation was subjected to 6% shortening and 6% stretching about the resting length). Work, the product of muscle force and displacement, was calculated by computer integration of the force and length recordings. Shortening work is the area under the curve formed by a plot of muscle force vs. length during muscle shortening, lengthening work is the area under the curve during muscle lengthening, and net work is equal to the area within the loop formed when force is plotted vs. length over a complete cycle (i.e., net work = shortening work lengthening work). For further details and justification of the work loop approach, see Josephson (18). Preparations were subjected to and stimulated on four consecutive strain cycles per trial. Work output was relatively stable, declining by a maximum of 10% from the first to last cycle of each trial. Work was calculated as the average over the four cycles. For each preparation, work output at each cycle frequency represented the average of at least two trials. Work loops were also collected during strain cycles when the muscle was not stimulated, to compare active work with the passive work done by the elastic and viscous components of the muscle. Our preliminary experiments found that work output was significantly reduced by subjecting muscles to strains > 20%. Thus trials for cycle frequencies simulating sustained swimming activities (l-5 Hz) were made first and in random order, followed by trials at higher cycle frequencies and higher strains (burst-and-glide, C-start). Following the experiments, preparations were dissected free of the foil clips and dead tissue and were weighed to the nearest 0.1 mg. Work and power measurements were normalized for preparation mass. Red muscle power vs. useful power from oxygen consumption. Beamish (6) found that the oxygen consumption of largemouth bass increased logarithmically with swimming speed and linearly with increasing temperature (see 22.5-cm specimen in Fig. 3 of Ref. 6). We estimated the “useful power” from oxygen consumption by combining the data from Beamish and the approach used by Alexander (l), outlined below. Useful power is the fraction of total power, available from aerobic sources, that contributes to forward locomotion of the fish (useful power = total chemical power x efficiency of conversion to mechanical work x propeller efficiency). We used Webb’s (35) data on trout as an estimate of the efficiency of conversion of chemical energy into mechanical work, which increases from 1 to 15% as speed increases from 0.1 to 0.6 m/s. Given the similarity of values for mechanical efficiency in many different species and muscle types (15, 2 1, 32), the application of data from trout to bass seems reasonable. Similarly, we used propeller efficiencies derived from the subcarangiform swimming of trout, in which values are similar to those of many other fish species (see Table 7 in Ref. 35). Estimates of power available from red muscle in the whole animal were made by determining the fraction of the fish’s mass composed of red muscle and multiplying this by the mass
R484
RED
MUSCLE
POWER
OUTPUT
specific power output measured from the muscle at each cycle frequency. To determine the percentage of red muscle mass, all the superficial red trunk muscle from three fish was removed, weighed, and expressed as a percentage of the total body mass. The values obtained (1.2, 1.4, and 1.6%), although somewhat low for many subcarangiform fish, are similar to values from marine teleosts that also use pectoral fin locomotion at low swim speeds (9). Estimates of swimming speed for a tail-beat frequency of 1 Hz were made by extrapolation from known swimming speeds and corresponding tail-beat frequenties. Statistics. A paired t test was used to compare power output in passive and active muscle preparations at each cycle frequency (31). Differences in normalized power output at consecutive frequencies were also compared using a paired t test. RESULTS
DURING
A
Table 1. Frequency and amplitude of strain cycles and stimulus duration and timing (phase) for red muscle activity measured in vivo at different swimming speeds Behavior
Hypothetical Cruise (0.7 Cruise (1.5 Cruise (2.4 Cruise (3.0 Burst-and-glide C-Start
( < 0.7 L/s)* L/s) L/s) L/s) L/s)
Tail-beat Frequency,
1 2 3 4 5 10 15
Hz
Strain, %
Stimulus Duration,
12 12 12 12 12 20 30
361 181 111 83 67 31 20
L, length. *Values extrapolated from actual measurements 0.7 and 3.0 L/s; largemouth bass do not swim at 1 Hz.
ms
Phase,
75 75 60 20 20 30 40 between
’
SWIMMING
6 4
0 ms -6
B
6 4
T
Electromyography and kinematics. Strain amplitudes, stimulation durations, and stimulation phases during cruise, burst-and-glide, and C-start swimming behaviors are shown in Table 1 and Fig. 2. Hypothetical parameters for cruise speed swimming at a tail-beat frequency of 1 Hz (below the normal range of swimming frequencies) were extrapolated from recorded data (assuming a phase and duty cycle similar to 2 Hz). These values were obtained to determine the importance of red muscle power output to the transition between swimming behaviors (finned to undulatory). For bass swimming at 5 Hz (- 3 L/s), we had only experimental observations of kinematics; hence, we used stimulation parameters based on the electromyographic results found for swimming at 4 Hz (2.4 L/s). Thorough analysis of the synchronized EMG and kinematic data for five steady swimming speeds (from 0.7 to 2.4 L/s) requires an analysis of variance accounting for variation attributable to both speed and different individual fish, and this will be presented elsewhere. The following are some relevant details for the single longitudinal location from which red muscle was taken for the work loop experiments described in the present paper. Relative EMG durations were unaffected by swimming speed (from 0.7 to 2.4 L/s) and averaged 33% of a cycle, with individual values ranging from 22 to 40% of a cycle. At the lowest (0.7 L/s) and highest (2.4 L/s) steady swimming speeds, the ranges in tail-beat frequency were from 1.5 to 2.7 Hz and from 3.3 to 5.3 Hz, respectively. Estimated strains of the red muscle at these lowest and highest steady
FISH
52 -5 0 -b -2 cD -4 -6
ms
10 q-5 L .E O 2 5
ms
-5 -10 -15
-L
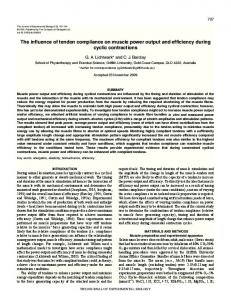
Fig. 2. EMGs and estimated strain of red muscle vs. time in bass Micropterus salmoides. Note that tic marks on all x-axes indicate lOO-ms intervals. EMGs at top and bottom of each plot are from right (R) and left (L) si‘d es of fish at longitudinal location shown in Fig. 1. All strains are %change in length relative to when fish was straight. Positive strains indicate shortening of red fibers on right side and lengthening of fibers on left side, whereas negative values indicate left side shortening and right side lengthening. Note that a nodal value of strain with negative slope indicates a phase of 180” with respect to left-side EMGs, whereas this phase of right side EMGs occurs at nodal values with a positive slope. Arrows pointing toward EMGs indicate approximate times of onset and offset. Data shown in A, B, and C are for steady swimming at speeds of 0.7, 1.6, and 2.4 body lengths (X)/s, respectively, in same individual fish. Note that EMGs at fastest steady swimming speed (C) occur only when muscle is longer than resting length, whereas latter portion of EMGs at slower speeds often occurs when muscle is shorter than resting length. In D, note highly variable amplitude and timing of kinematics and EMGs during unsteady, burst-and-glide swimming behavior; rapid tail flips (after 100 ms) during burst-and-glide swimming usually have EMGs occurring when muscle is longer than resting length.
RED
MUSCLE
POWER
OUTPUT
DURING
/)
0.1*
Bus
1
/J1 dL.9
1
0.7
BUS
1.5 BUS
L
I
SWIMMING
R485
swimming speeds ranged from 10.7 to 13.2% and from 11.4 to 14.7%, respectively. Phase of red EMG onset relative to the strain cycle at the lowest and highest steady speeds ranged from 46 to 89” and from -14 to 42”, respectively. Work loop measurements. Work loops from one preparation, shown in Fig. 3, were obtained using the stimulation and strain parameters from EMG and kinematic data (Table 1, Fig. 2). With these parameters, work output decreased as cycle frequency increased from 1 to 15 Hz (Fig. 4A; Table 2). At 1-5 Hz, activating the muscle resulted in net positive work output; the loops are counterclockwise, meaning more work was done by the muscle during shortening than was done on the muscle during lengthening. During burst-and-glide and C-start swimming (10 and 15 Hz), the net work output was near zero or negative; the loops are relatively narrow and not uniformly counterclockwise, meaning that during much of the cycle more work was required to lengthen the muscle than during shortening (Fig. 3). Despite the inaccuracy of EMG and kinematic data for C-starts, it is clear that muscle strain and cycle frequency are high during escape maneuvers (20-30% and 15 Hz, respectively); it is likely that varying phase and stimulation duration will have little or no effect on net work output because red muscle fibers will fail to relax between successive cycles. Power output increased slightly as frequency increased from 1 to 3 Hz (P < 0.05, t test) and reached a plateau of - 10 W/kg between 3 and 5 Hz (Table 2; Fig. 4B). At frequencies of 10 and 15 Hz and the corresponding strains simulating burst activity, 20 and 30%, power output declined below the maximum (P < 0.01, t test; Table 2, Fig. 4B). In some preparations, strain and stimulation parameters at l-5 Hz were adjusted to determine whether work output using in vivo parameters was maximal. Little, if any, additional work was obtained from the
1 OOms c;
FISH
5OmN 12%
Fig. 3. Graphs (left) show a single strain cycle for an in vitro muscle preparation at l-15 Hz (top to bottom). Swimming speeds that would occur in vivo at similar tail-beat frequencies are also shown (values have been extrapolated because fish do not swim at these tail-beat frequencies). Amplitude of cycle was 26% at 1-5 Hz, +lO% at 10 Hz, and *15% at 15 H z, corresponding to in vivo strain regimens shown in Table 1. Corresponding work loops from a single preparation have been drawn (right). Heavy lines drawn on sinusoids and work loops represent time during which muscle was stimulated (see Table 1).
B 1 0
Fig. 4. Work output per cycle (A) and power output (23) as functions of cycle frequency. Values were normalized to maximum value recorded for each preparation; data (means t SE; n = 6) were obtained during passive (unstimulated; O) or active (stimulated) trials (0).
-5
-6
0
I
I
I
I
2
4
6
8
I
IO
Cycle frequency
I
12
(Hz)
I
14
I
16
-7 0
I
I
I
I
2
4
6
8
I
IO
Cycle frequency
I
12
(Hz)
I
14
I
16
R486
RED
MUSCLE
POWER
OUTPUT
DURING
Table 2. Work and power output (normalized to preparation trials with (active) and without (passive) stimulation Work, Cycle
weight)
SWIMMING
at different
cycle frequencies,
J/kg
Power,
measured
in
W/kg
Frequency Active
1.02 2 0.01 2.03+0.01 3.03+0.01 4.1320.06 5.0320.02 10.24 2 0.05 15.13+0.04 Values
FISH
are means
4.28t 0.94 3.88*0.97 3.49 t 0.96 2.4820.74 1.94 + 0.63 0.13 + 0.29 -3.56kO.73
Passive
-0.15 + 0.02 -0.14+0.02 -0.15 + 0.01 -0.17* 0.01 -0.241tO.04 -0.8420.13 -3.1221.44
Active
Passive
4.372 1.08 7.9021.86 10.57k2.35 10.02 + 2.09 9.7921.77 1.4123.30 -54.5Ok27.01
-0.16 + 0.02 -0.29kO.03 -0.45 20.04 -0.70+0.06 -1.11+0.14 -8.1321.38 -46.34k22.30
+ SE; n = 6.
preparations with these adjustments (data not shown), suggesting that work output using in vivo parameters was maximal. This result is in agreement with observations on scup red muscle at 20°C (28). At cycle frequencies from 1 to 10 Hz, stimulating the muscle significantly increased work output compared with work from passive muscle (P < 0.01 at 1-5 Hz and P < 0.05 at 10 Hz, t test; Fig. 4A). Although active and passive work output per cycle were not significantly different at 15 Hz (Fig. 4A), stimulating the muscle did increase the maximum force produced during the sinusoidal length cycle at this frequency (P < 0.05, t test). DISCUSSION
Simultaneous activity of red and white muscle fibers. The dominant paradigm from electromyographic research in fish is that red muscle fibers are used for cruise or sustained swimming and white muscle fibers for burst activity. Furthermore, red muscle fibers remain active even at relatively high swimming speeds in many teleosts (this investigation and Refs. 10, 21, 23, 25, 26, 29). In addition, both red and white fibers are recruited during C-start escape behaviors (12) and during slowspeed kick and glide behavior, although red fibers may be inactivated during higher-speed unsteady swimming (13). On the basis of force velocity measurements and EMG data, Rome et al. (25) concluded that during high-speed tail movements, and therefore high shortening velocities, the red muscle would fail to provide adequate power for locomotion, necessitating the recruitment of faster white muscle. Additionally we have shown that, under burst-and-glide swimming regimens (high tail speed, 10 Hz), although red muscle power is indeed low, activating the muscle increases the net work done and power output of the muscle group more than if it were not activated (Fig. 4). Although we were unable to model red muscle activity during C-starts (30% strain, 15 Hz) accurately because of their nonsinusoidal nature, the muscle did not contribute any additional positive work or power when activated compared with the unstimulated condition (Fig. 4). However, significantly more force was produced by activating the muscle (see RESULTS). The delayed increased stiffness associated with the activity of the red muscle during stretching on the contralateral side to the bend may be important in overcoming the inertial forces involved in the return
stroke after the “C” portion of the start. In other words, the active red muscle may act as a “brake,” aiding the antagonistic motor units on the opposite side of the body and smoothing the transition between tail beats. The activity of the red muscle during high speeds may also simply represent a constraint imposed by the coupling of white and red muscle motor neurons in the central nervous system. Changes in muscle power along the body. It has generally been accepted that during steady swimming in teleost fish, the work produced by the lateral muscle is predominantly positive near the head and negative near the tail (34). However, recent studies on red muscle in scup have shown that, compared with posterior myotomes (0.5-0.7 BL), anterior myotomes (0.3-0.4 BL) generate significantly less work (29). Interestingly, in this study, muscle fibers dissected from 0.7 BL also produced large positive work loops using in vivo stimulation and strain parameters (see Fig. 1). Although anterior myotomes produce predominantly positive work (i.e., generate most of their force during shortening), Undulatory
Fin
0.3
Burst-and-glide
Useful power calculated from oxygen consumption
Red muscle
0.0
0.2
0.4 Swimming
0.6 0.8 speed (m/s)
power
1.0
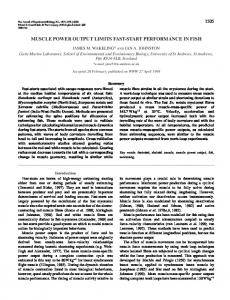
Fig. 5. Red muscle power output (means + SE, n = 6) and useful power calculated from oxygen consumption measurements (6) during cruise swimming (see text). Line for power output from oxygen consumption was fitted using a cubic polynomial curve fit. Nos. near top graph correspond to tail-beat frequency; swimming velocities shown for this graph (means t SE, zz. = 6) are calculated from speeds shown in Table 1 (in BL/s) for individual fish. Shaded areas represent swim speeds (obtained in this study) during pectoral fin and burst-andglide swimming behaviors.
RED
MUSCLE
POWER
OUTPUT
total work output in these myotomes is limited by strain (29). The or iginal model of power output during swimming in fish must clearly be reevaluated. The limits to undulatory swimming. To generate more power to be able to cruise at higher speeds, there are three options open to fish. 1) By adjusting the phase and duration of EMG activity and possibly tail-beat amplitude (i.e., muscle strain) at a given tail-beat frequency, power or work output for a given mass of muscle could be increased. 2) By swimming at a different tail-beat frequency to operate higher on the cycle frequency vs. power output curve, work or power per unit of muscle mass could be increased. 3) By sequentially recruiting more motor units, total power output (per unit body mass) could be increased. Under conditions simulating in vivo activity during steady swimming, the net work done by the red muscles used in this study (taken from a longitudinal position at the end of the soft dorsal fin) was positive and maximal (see RESULTS). Because work output at each frequency is maximal, the fish cannot increase power and therefore swimming speed by adjusting the timing and duration of muscle activity or muscle strain. However, the fish can adjust swimming speed by changing tail-beat frequency to increase or decrease muscle power output (Fig. 4B). In addition, fish may sequentially increase the proportion of red muscle fibers recruited as swimming speed increases (see below). It is also possible that fish adjust fin areas to change thrust and drag. However, a detailed study of the hydrodynamic effects of changing fin areas is beyond the scope of this investigation and therefore remains as an additional potential means of modifying swim speed. Muscle fiber types have characteristic ranges of shortening velocities over which they can generate maximum power efficiently (23); below this range, or at very low cycle frequencies or swimming speeds, work output per cycle is high but power output is considerably reduced below maximal (i.e., efficiency declines). The use of finned locomotion at very low speeds ( < 0.2 m/s) may therefore represent a constraint imposed by the lower limit of shortening velocities for red trunk muscle over which power output can be generated efficiently. Perspectives In Fig. 5, power available from red muscle in the whole animal has been compared with useful power available from oxygen consumption as a function of swimming speed. We have assumed that the useful power from oxygen consumption is a measure of the power required to swim at a given speed. Muscle power output is maximal at - 0.6-0.7 BL (28). Thus the value of red muscle power here (Fig. 5) is taken to represent the maximum potential power available from all red muscle fibers at different tail-beat frequencies. At tailbeat frequencies of 2-4 Hz, the potential power available from the red muscle exceeds the power requirements for swimming (Fig. 5). This suggests that only a proportion of red muscle fibers needs to be recruited to obtain a given speed (7,17).
DURING
FISH
R487
SWIMMING
If the required power for swimming (useful power) exceeds the maximum power output available from the red muscle, then the locomotor behavior and muscle recruitment pattern of the fish must change to allow them to swim faster. According to this premise, even if all slow-twitch fiber motor units were recruited at one time, generating maximal power, the red muscle would still be unable to generate sufficient power to enable fish to swim at speeds above -0.7 m/s or between 4- and ~-HZ tail-beat frequency in bass (Fig. 5). The fish can achieve no further increase in red muscle power output, and therefore speed, by increasing tail-beat frequency from 4 to 5 Hz (Fig. 5). Thus, to increase speed, bass must use unsteady locomotor (burst-and-glide) activities, with the recruitment of fast-twitch muscle fiber types. In light of these findings, we propose that the limit to cruise speed swimming is determined by the maximum power available from red muscle fibers. We thank Bob Josephson for technical support. This work was supported by National Science Foundation Grants IBN-9118346 to A. F. Bennett, BNS-8919497 to G. V. Lauder and B. C. Jayne, BSR-9007994 to G. V. Lauder, and DCB-9104170 to R. K. Josephson. Address for reprint requests: T. P. Johnson, Dept. of Ecology and Evolutionary Biology, Univ. of California, Irvine, CA 92717. Received
7 June
1993;
accepted
in final
form
28 February
1994.
REFERENCES 1. Alexander, R. M. Swimming. In: Mechanics and Energetics of Animal Locomotion, edited by R. M. Alexander and G. Goldspink. London: Chapman and Hall, 1977, p. 222-248. 2. Altringham, J. D., and I. A. Johnston. Modeling muscle power output in a swimming fish. J. Exp. BioZ. 148: 395-402, 1990. 3. Altringham, J. D., and I. A. Johnston. Scaling effects on muscle function: power output of isolated fish muscle fibers performing oscillatory work. J. Exp. Biol. 151: 453-467, 1990. 4. Altringham, J. D., C. S. Wardle, and C. I. Smith. Myotomal muscle function at different locations in the body of a swimming fish. J.Exp.BioZ. 182: 191-205,1993. 5. Anderson, M. E., and I. A. Johnston. Scaling of power output in fast muscle fibers of the Atlantic cod during cyclical contractions. J. Exp.BioZ. 170: 143~154,1992. 6. Beamish, F. W. H. Oxygen consumption of largemouth bass, Micropterus salmoides, in relation to swimming speed and temperature. Can. J. ZooZ. 48: 1221-1228, 1970. 7. Bone, Q., J. Kiceniuk, and D. R. Jones. On the role of different fiber types in fish myotomes at intermediate swimming speeds. Fish. BUZZ. Fish. Wildlife Serv. USA 76: 691-699, 1978. 8. Eaton, R. C., R. A. Bombardieri, and D. L. Meyer. The Mauthner-initiated startle response in teleost fish. J. Exp. BioZ. 66: 65-81,1977. 9. Greer-Walker, M., and G. A. Pull. A survey of red and white muscle in marine fish. J. Fish. BioZ. 7: 295-300, 1975. 10. Hudson, R. C. L. On the function of the white muscles in teleosts at intermediate swimming speeds. J. Exp. BioZ. 58: 509-522, 1973. 11. Jayne, B. C. Muscular mechanisms of snake locomotion: an electromyographic study of the lateral undulation of the Florida banded water snake (Nerodia fasciata) and the yellow rat snake (Elaphe obsoleta). J. Morphol. 197: 159-181, 1988. 12. Jayne, B. C., and G. V. Lauder. Red and white muscle activity and kinematics of the escape response of the bluegill sunfish during swimming. J. Comp. Physiol. 173: 495-508, 1993. 13. Jayne, B. C., and G. V. Lauder. How swimming fish use slow and fast muscle fibers: implications for models of vertebrate muscle recruitment. J. Comp. Physiol. In press. 14. Johnson, T. P., and I. A. Johnston. Power output of fish muscle fibers performing oscillatory work: effects of acute and seasonal temperature change. J. Exp. BioZ. 157: 409-424, 1991.
R488
RED
MUSCLE
POWER
OUTPUT
15. Johnson, T. P., I. A. Johnston, and T. W. Moon. Temperature and the energy cost of oscillatory work in teleost fast muscle fibers. PfZuegers. Arch. 419: 177-183, 1991. 16. Johnson, T. P., T. W. Moon, and I. A. Johnston. Actions of epinephrine on the contractility of fast and slow skeletal muscle fibers in teleosts. Fish Physiol. Biochem. 9: 83-89, 1991. 17. Johnston, I. A., W. Davison, and G. Goldspink. Energy metabolism of carp swimming muscle. J. Comp. Physiol. 114: 203-216,1977. R. K. Mechanical power output from striated muscle 18. Josephson, during cyclic contraction. J. Exp. Biol. 114: 493-512, 1985. 19. Langfeld, K. S., T. C. Crockford, and I. A. Johnston. Temperature acclimation in the common carp: force-velocity characteristics and myosin subunit composition of slow muscle fibers. J. Exp. Biol. 155: 291-304, 1991. 20. Lighthill, J. J. Large-amplitude elongated body theory of fish locomotion. Proc. R. EntomoZ. Sot. Lond. Ser. B. Taxon. 179: 125-138,197l. 21. Moon, T. W., J. D. Altringham, and I. A. Johnston. Muscle energetics and power output of isolated fish fast muscle performing oscillatory work. J. Exp. BioZ. 158: 261-273, 1991. 22. Rayner, M. D., and M. J. Keenan. Role of red and white muscles in the swimming of skipjack tuna. Nature Lond. 214: 392-393,1967. 23. Rome, L. C. Influence of temperature on muscle recruitment and muscle function in vivo. Am. J. Physiol. 259 (Regulatory Integratiue Comp. Physiol. 28): R210-R222, 1990. 24. Rome, L. C., I.-H. Choi, G. Lutz, and A. Sosnicki. The influence of temperature on muscle function in the fast swimming scup. I. Shortening velocity and muscle recruitment during swimming. J. Exp. BioZ. 163: 281-296, 1992.
DURING
FISH
SWIMMING
L. C., R. P. Funke, and R. M. Alexander. The influence 25. Rome, of temperature on muscle velocity and sustained performance in swimming carp. J. Exp. BioZ. 154: 163-178, 1990. L. C., R. P. Funke, R. M. Alexander, G. Lutz, 26. Rome, H. Aldridge, F. Scott, and M. Freadman. Why animals have different muscle fiber types. Nature Lond. 335: 824-827,1988. 27. Rome, L. C., P. T. Loughna, and G. Goldspink. Muscle fiber activity in carp as a function of swimming speed and muscle temperature. Am. J. Physiol. 247 (Regulatory Integrative Comp. Physiol. 16): R272-R279, 1984. 28. Rome, L. C., and D. Swank. The influence of temperature on power output of scup red muscle during cyclical length changes. J. Exp. BioZ. 171: 261-281, 1992. L. C., D. Swank, and D. Corda. How fish power 2g* Rome, swimming. Science Wash. DC 261: 340-343,1993. 30. Sisson, J. E., and B. D. Sidell. Effect of thermal acclimation on muscle fiber recruitment of swimming striped bass (Morone saxatilis). Physiol. ZooZ. 60: 310-320, 1987. 31. Sokal, R. R., and F. J. Rohlf. Biometry. San Francisco: Freeman, 1981. 32. Stevenson, R. D., and R. K. Josephson. Effects of operating frequency and temperature on mechanical power output from moth flight muscle. J. Exp. BioZ. 149: 61-78, 1990. S. J., T. P. Johnson, R. K. Josephson, and A. F. 33. Swoap, Bennett. Temperature, muscle power output and limitations on burst locomotor performance of the lizard Dipsosaurus dorsalis. J. Exp. BioZ. 174: 185-197, 1993. 34 Van Leeuwen, J. L., M. J. M. Lankheet, H. J. Akster, and . J. W. M. Osse. Function of red axial muscles of carp (Cyprinus carpio L.): recruitment and normalized power output during swimming in different modes. J. ZooZ. Lond. 220: 123-145, 1990. 35. Webb, P. W. The swimming energetics of trout. II. Oxygen consumption and swimming efficiency. J. Exp. BioZ. 55: 521-540, 1971.