Multi-time-scale traffic modeling using Markovian and L-Systems models Paulo Salvador1 , Ant´onio Nogueira1 , Rui Valadas1 , and Ant´onio Pacheco2 1
2
University of Aveiro / Institute of Telecommunications Aveiro Campus de Santiago, 3810-193 Aveiro, Portugal {salvador, nogueira}@av.it.pt,
[email protected] Instituto Superior T´ecnico - UTL / Department of Mathematics and CEMAT Av. Rovisco Pais, 1049-001 Lisboa, Portugal
[email protected]
Abstract. Traffic engineering of IP networks requires the characterization and modeling of network traffic on multiple time scales due to the existence of several statistical properties that are invariant across a range of time scales, such as selfsimilarity, LRD and multifractality. These properties have a significant impact on network performance and, therefore, traffic models must be able to incorporate them in their mathematical structure and parameter inference procedures. In this work, we address the modeling of network traffic using a multi-timescale framework. We evaluate the performance of two classes of traffic models (Markovian and Lindenmayer-Systems based traffic models) that incorporate the notion of time scale using different approaches: directly in the model structure, in the case of the Lindenmayer-Systems based models, or indirectly through a fitting of the second-order statistics, in the case of the Markovian models. In addition, we address the importance of modeling packet size for IP traffic, an issue that is frequently misregarded. Thus, in each class we evaluate models that are intended to describe only the packet arrival process and models that are intended to describe both the packet arrival and packet size processes: specifically, we consider a Markov modulated Poisson process and a batch Markovian arrival process as examples of Markovian models and a set of four Lindenmayer-Systems based models as examples of non Markovian models that are able to perform a multi-time-scale modeling of network traffic. All models are evaluated by comparing the density function, the autocovariance function, the loss ratio and the average waiting time in queue corresponding to measured traces and to traces synthesized from the fitted models. We resort to the well known Bellcore pOct traffic trace and to a trace measured at the University of Aveiro. The results obtained show that (i) both the packet arrival and packet size processes need to be modeled for an accurate characterization of IP traffic and (ii) despite the differences in the ways Markovian and L-System models incorporate multiple time scales in their mathematical framework, both can achieve very good performance. keywords: Traffic modeling, Markovian arrival processes, L-Systems.
1 Introduction In the Internet, the complexity associated to mechanisms for traffic generation and control, as well as the diversity of applications and services, have introduced several peculiar behaviors in traffic, such as self-similarity, long-range dependence and multifractality, which have a significant impact on network performance. These behaviors have in common a property of statistical invariance across a range of time scales. Thus, a suitable traffic model must be able to capture statistical behavior on multiple time scales. In order to completely characterize a traffic model, we have to specify the model structure and its parameter inference procedure. Multi-time-scale characteristics can be incorporated in the parameter fitting procedure or can be embedded in the model structure. Moreover, accurate modeling of IP traffic requires the characterization of both the packet arrival and packet size processes. Assuming that packet size is fixed and equal to the average packet size of the measured data trace may lead to large errors when packets have variable size. In this paper, we address the modeling of network traffic under a multi-time-scale framework. Our main goal is to evaluate and compare the performance of two classes of traffic models (based on Markovian and Lindenmayer-Systems models) that incorporate the notion of time scale using different approaches: directly in the model structure, in the case of Lindenmayer-Systems based models or indirectly via the fitting of the second-order statistics, in the case of Markovian models. In addition, we also address and evaluate the importance of modeling packet size in IP traffic, an issue that is frequently misregarded. Thus, we evaluate in each one of the selected classes, models that are intended to describe only the packet arrival process and models that are intended to describe both the packet arrival and packet size processes. The Markovian models considered in this study are a discrete time Markov modulated Poisson process (dMMPP), intended to describe only the packet arrival process, and a discrete time batch Markovian arrival process (dBMAP), that is intended to describe both the packet arrival and packet size processes. The use of Markovian models benefits from the existence of several mathematical tools for assessing queuing behavior, such as average waiting time and packet loss ratio. Besides, using appropriate parameters inference procedures it is possible to incorporate in their structure the multi-time-scale characteristics of the traffic while still maintaining their analytical tractability. The second class of traffic models considered in this paper is based on stochastic Lindenmayer-Systems (hereafter referred to as L-Systems). L-Systems are string rewriting techniques which were introduced by biologist A. Lindenmayer in 1968 as a method to model plant growth [1]. They are characterized by an alphabet, an axiom and a set of production rules, and can be used to generate fractals [2]. The alphabet is a set of symbols; the production rules define transformations of symbols into strings of symbols; starting from an initial string (the axiom), an L-System constructs iteratively sequences of symbols through replacement of each symbol by the corresponding string according to the production rules. If the production rules are random, the LSystem is called a stochastic L-System. Stochastic L-Systems are a method to construct recursively random sequences with multi-time-scale behavior. Four different variants
of L-Systems based traffic models will be proposed, one intended to describe only the packet arrival process and three destined to describe both the packet arrival and packet size processes. The performance of the different traffic models is evaluated by comparing the first and second order statistics and the queuing behavior (in terms of packet loss and average waiting time) of (i) original measured data traces and (ii) traces generated via discrete event simulation of the traffic models whose parameters are inferred from the measured data. The results obtained show that both the packet arrival and packet size processes need to be modeled in order to obtain an accurate and complete fitting of the measured data. Moreover, despite the differences in the way Markovian and L-System models incorporate multiple time scales, both can achieve very good performance. This can be attributed, on one hand, to the detail that is used in the fitting procedures of the Markovian models and to the technique used in the matching of the autocovariance function and, on the other hand, to the fact that the construction process of the L-System models is inherently performed on a time-scale basis. The paper is organized as follows. Section 2 presents the traffic models and inference procedures considered in this paper; in Section 3 we discuss the results of applying the proposed models and fitting procedures to measured and synthesized traffic traces. Finally, Section 4 presents the main conclusions.
2 Traffic models 2.1
Discrete-time Markovian models
The first Markovian model considered is a discrete-time Markov Modulated Poisson Process (dMMPP) with a parameter fitting procedure that leads to accurate estimates of queuing behavior for network traffic exhibiting LRD behavior. It addresses only the characterization of the packet arrival process. The model and the respective parameter inference procedure were proposed in [3]. The inference procedure matches both the autocovariance and marginal distribution of the counting process. A major feature of the model is that the number of states is not fixed a priori, but can be adapted to the particular trace being modeled. In this way, the procedure allows establishing a compromise between the accuracy of the fitting and the number of parameters, while maintaining a low computational complexity. The MMPP is constructed as a superposition of L 2-MMPPs and one M-MMPP. The 2-MMPPs are designed to match the autocovariance and the M-MMPP to match the marginal distribution. Each 2-MMPP models a specific time scale of the data. Here, the specific behavior of each time scale is incorporated through the fitting of the second-order statistics of the data. The procedure starts by approximating the autocovariance by a weighted sum of exponential functions that models the autocovariance of the 2-MMPPs. The autocovariance tail can be adjusted to capture the long-range dependence characteristics of the traffic, up to the time-scales of interest to the system under study. The next step is the inference of the M-dMMPP probability function and the stationary probabilities of the L 2-dMMPPs from the empirical probability function of the original data trace, within the constraints
imposed by the autocovariance matching. These parameters can be obtained through a constrained minimization process. At this point, all parameters of the 2-dMMPPs have been determined. The M-dMMPP probability function is then approximated by a weighted sum of Poisson probability functions, and the number of states (M) is determined as the number of Poisson functions necessary to perform the approximation. The mean and weight of the Poisson probability functions determine, respectively, the states arrival rates and the transition probabilities of the M-dMMPP. The final MMPP with M2L states is obtained by superposing the L 2-MMPPs and the M-MMPP (figure 1). The second Markovian model considered is a discrete-time batch Markovian arrival process (dBMAP), that is able to characterize both the packet arrival and packet size processes of IP traffic. This model was proposed in [4]. In the dBMAP model, packet arrivals occur according to a dMMPP and each arrival is characterized by a packet size with a general distribution that may depend on the phase of the dMMPP. Figure 2 illustrates an example of a dBMAP with four states. The fitting procedure is designed in order to provide a close match of both the autocovariance and the marginal distribution of the packet arrival process, using the dMMPP previously described; then, a packet size distribution is individually inferred for each state of the dMMPP in a such a way that gives the best fit to the size distribution of all packets that arrived during the time slots associated to that state. As in the case of the dMMPP, the number of states of the fitted dBMAP is not fixed a priori; it is determined as part of the inference procedure itself. The packet size characterization is independently performed for each state of the inferred M2L -dMMPP. This task involves two steps: (i) association of each time slot to one of the M2L -dMMPP states and (ii) inference of a packet size distribution for each state of the M2L -dMMPP. In the first step, we scan all time slots of the empirical data. A time slot is randomly assigned to a state, according to a probability vector that is calculated from the number of packets that arrived in that particular time slot and from the inferred dMMPP parameters. The inference of the packet size distribution in each state resorts to histograms. The construction of each histogram is only based on the packets that arrived during the time slots previously associated with the corresponding state of the dMMPP. 2.2
L-System models
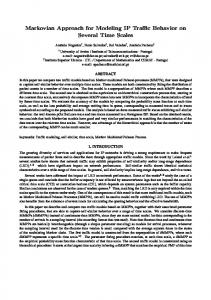
The application of stochastic L-Systems in the traffic modeling context was first introduced by the authors in [5]. The model proposed in that work only addressed the characterization of the packet arrival process. In this model, which will be called here Single L-System, iterations are interpreted as time scales, the symbols are arrival rates that are associated with time intervals and the production rules generate two arrival rates from a single one. Starting at the coarsest time scale with a single interval and a single arrival rate, the construction process iteratively generates two arrival rates from a single one, according to the stochastic production rules and, at the same time, halves the width of the time intervals associated with the new arrival rates. We allow the grouping of time scales in time scale ranges and the definition of different sets of production rules for each time scale range. The traffic process construction is illustrated in Figure 3, for the simple case of considering only four scales (j = 0, 1, 2, 3) grouped in two scale
λ
λ
+
λ
+
λ
+ −
λ
+
λ
λ
λ
Fig. 1. Superposition of one M-dMMPP and L 2-dMMPP processes.
Fig. 2. Example of a 4-dBMAP.
ranges (r = 1, 2). The inference procedure can then be divided in three major steps: (i) determination of the L-System alphabet and axiom, (ii) identification of the time scale ranges and (iii) inference of the L-System production rules. The alphabet of the L-System will consist in L equidistant arrival rate values, ranging from the minimum to the maximum values present in data. The axiom is inferred as the average arrival rate of the empirical data, rounded to the closest alphabet element. The identification of time scale ranges is based on wavelet scaling analysis. We use the method described in [6], which resorts to the (second-order) logscale diagram. A (second-order) logscale diagram is a plot of the energies against scales, together with confidence intervals about the energies, where these energies are a function of the wavelet discrete transform coefficients at a specific scale. The time scale ranges correspond to the set of time scales for which, within the limits of the confidence intervals, the energy values fall on a straight line, i.e., the scaling behavior is linear in a time scale range. The last step is the inference of the L-System production rules. First, data is rounded to the closest alphabet element in order to define the data sequence for each time scale. Finally, the production rules probabilities can be directly inferred from data inspection, specifically from the number of times that a particular pair of arrival rates was originated from a particular arrival rate located at the upper timescale. Three subsequent extensions addressed the characterization of both the packet arrival and packet size processes. The first extension corresponds to a model with two independent L-Systems, one for the packet arrival and the other for the packet size process, called Double L-System model [7]. Due to the independence of the two LSystems, this model is not able to capture the correlations between packet arrivals and sizes, although it captures multifractal behavior on both the packet arrival and packet sizes processes. The second extension is based on a single bi-dimensional L-System and is called Joint L-System [8]. In this model, the alphabet elements are pairs of arrival rates and mean packet sizes and the production rules generate two pairs, each one consisting of an arrival rate and a mean packet size, from a single pair. Opposite to the previous model, this one is able to capture correlations between arrivals and sizes.
(λ
=
j =3
j = 0 λ1
)
(2) p21
λ1 p11(1)
λ1
=
(2) p32
λ2
j=2 j =1
γ
λ3
λ2
p
(2) p45
λ5
λ3 (1) 32
λ4
r=2
λ4
λ5
(1) 55
p
λ5
λ3 λ4
(1) p34
λ2
r =1
(λ
=
=
(λ
γ
)
γ
(λ
)
(λ
γ
)
(λ γ )
γ
)
(λ γ ) =
=
(λ γ ) (λ γ ) (λ γ ) (λ γ ) (λ γ ) (λ γ ) (λ γ ) (λ γ )
Fig. 3. Construction of a Single L-System based traffic model.
Fig. 4. Construction of a Joint L-System based traffic model.
Trace name Capture period pOct UA
Trace size Mean rate Mean pkt size (pkts) (byte/s) (bytes) Bellcore trace 1 million 362750 568 12.41pm to 14.27pm, July 6th 2001 7 millions 654780 600 Table 1. Main characteristics of measured traces.
The traffic process construction is illustrated in Figure 4, once again for the simple case of considering only four scales (j = 0, 1, 2, 3) grouped in two scale ranges (rb = 1, 2). One potential disadvantage of this model is that it may require a large number of parameters. The third extension, which was proposed in [9], was devised in order to allow a lower number of parameters and also to provide a more detailed modeling of the packet size. In this case, only the packet arrival process is modeled through an L-System and the characterization of the packet size is performed by associating, at the finner time scale, a probability mass function (PMF) of packet sizes to each packet arrival rate. In this way, the model is able to capture correlations between packet arrivals and packet sizes, and multifractal behavior on packet arrivals (but not on packet sizes). Note that in this extension the packet sizes are characterized individually, whereas in the previous ones only the mean packet sizes were modeled. This model is called L-System with PMFs.
3 Numerical results We have applied our fitting procedures to two traces of IP traffic: (i) the well known pOct Bellcore trace and (ii) one trace measured at the University of Aveiro (UA). The UA trace is representative of Internet access traffic produced within a University campus environment. University of Aveiro is connected to the Internet through a 10 Mb/s ATM link and the measurements were carried out in a 100 Mb/s Ethernet link connecting the border router to the firewall, which only transports Internet access traffic. The main characteristics of the used traces are summarized in Table 1. The parameter estimation took, in all cases, less than 2 minutes, using a MATLAB implementation running in
Fig. 5. Density functions approximation, pOct
Fig. 6. Autocovariance approximation, pOct
a 1.2 GHz AMD Athlon PC, with 1.5 Gbytes of RAM. This shows that all fitting procedures are computationally very efficient. The suitability of the traffic models and the accuracy of the fitting procedures was assessed using several criteria. For the original data traces and for traces synthesized according to the inferred models, we compare both the probability mass and autocovariance functions of the packet arrival process. For the same two traces, we compare queuing behavior as assessed by packet loss ratio and average waiting time estimated through trace-driven simulation. In the case of the Single L-System and dMMPP models, we have considered a fixed packet length equal to the mean packet size of the original data. Figure 5 shows that, for the case of the pOct trace, all models were able to match relatively well the PMF of the original data. This agreement is not so good in the case of the autocovariance function (Figure 6). The dMMPP was able to closely match the autocovariance function and the Single L-System has also performed quite well. Similar results were obtained for the other trace. To assess queuing behavior, the buffer size was varied from 10 Kbytes to 70 Mbytes. The service rate was 518 Kbytes/s for the pOct trace and for an utilization ratio (ρ) of 0.7, 403 Kbytes/s in order to have an utilization ratio of 0.9 for the same trace, and 666 Kbytes/s for the UA trace (corresponding to an utilization ratio of 0.98). Figures 7, 9, 11, 13, 15 and 17 show that the Single L-System and the dMMPP model are able to reproduce the queuing behavior of the empirical traffic when the packet size is considered as a fixed value, but both models failed to reproduce the queuing behavior of the traffic when the variable packet size of the IP traffic is considered. In Figures 8, 10, 12, 14, 16 and 18 it is possible to observe the queuing results corresponding to the traffic models that include the ability to reproduce the arrival and packet size processes. The fitting of the queuing behavior was very good for all considered models. From these results, we first conclude that it is important to characterize both the packet arrival and packet size processes. In general, the three L-System based traffic models and the BMAP model that incorporate these characteristics achieve good fitting performance. The best one, which was able to track almost perfectly the queuing behavior of all traces, is the Joint L-System. This can be attributed to its ability of capturing correlations in and
Fig. 7. Packet loss ratio, trace pOct ρ = 0.7 Fig. 8. Packet loss ratio, trace pOct ρ = 0.7 (without packet size modeling) (with packet size modeling)
! "" # $
Fig. 9. Average waiting time, trace pOct ρ = Fig. 10. Average waiting time, trace pOct ρ = 0.7 (with packet size modeling) 0.7 (without packet size modeling)
between the packet arrival and packet size processes, as well as multifractal behavior on the byte arrival process. The Double L-System is somewhat impaired by its inability to capture the correlation between arrivals and sizes and the L-System with PMFs by its inability to capture correlations and multifractal behavior on the packet size process. However, the L-System with PMFs has a lower number of parameters and therefore can be considered a good alternative.
4 Conclusion Time scales are an important ingredient for the modeling of today’s Internet traffic. In this paper, we addressed the modeling of network traffic using a multi-time-scale framework by evaluating and comparing two classes of traffic models: Markovian models and models based on Lindenmayer-Systems. We also addressed the importance of modeling the packet size for IP traffic, an issue that is frequently misregarded. Our results indicate that both the packet arrival and packet size processes need to be modeled
Fig. 11. Packet loss ratio, trace pOct ρ = 0.9 Fig. 12. Packet loss ratio, trace pOct ρ = 0.9 (without packet size modeling) (with packet size modeling)
!! " #
Fig. 13. Average waiting time, trace pOct ρ = Fig. 14. Average waiting time, trace pOct ρ = 0.9 (with packet size modeling) 0.9 (without packet size modeling)
for an accurate characterization of IP traffic and that, despite the differences in the way Markovian and L-System models incorporate multiple time scales in their mathematical frameworks, both can achieve very good performance. Acknowledgements: This research was supported in part by Fundac¸a˜ o para a Ciˆencia e a Tecnologia, the project POSI/42069/CPS/2001, and the grant BD/19781/99.
References 1. Lindenmayer, A.: Mathematical models for cellular interactions in development II. Simple and branching filaments with two-sided inputs. Journal of Theoretical Biology 18 (1968) 300–315 2. Peitgen, H., Jurgens, H., Saupe, D.: Chaos and Fractals: New Frontiers of Science. SpringerVerlag (1992) 3. Salvador, P., Pacheco, A., Valadas, R.: Multiscale fitting procedure using Markov modulated Poisson processes. Telecommunications Systems 23 (2003) 123–148
Fig. 15. Packet loss ratio, trace UA ρ = 0.98 Fig. 16. Packet loss ratio, trace UA ρ = 0.98 (without packet size modeling) (with packet size modeling)
! "" # $
Fig. 17. Average waiting time, trace UA ρ = Fig. 18. Average waiting time, trace UA ρ = 0.98 (with packet size modeling) 0.98 (without packet size modeling)
4. Salvador, P., Pacheco, A., Valadas, R.: Modeling IP traffic: Joint characterization of packet arrivals and packet sizes using BMAPs. Computer Networks Journal 44 (2004) 335–352 5. Salvador, P., Nogueira, A., Valadas, R.: Modeling multifractal traffic with stochastic LSystems. In: Proceedings of GLOBECOM 2002. (2002) 6. Abry, P., Flandrin, P., Taqqu, M., Veitch, D.: Wavelets for the analysis, estimation and synthesis of scaling data. in Self-Similar Network Traffic Analysis and Performance Evaluation, K. Park and W. Willinger Eds (1999) 7. Salvador, P., Nogueira, A., Valadas, R.: Modeling multifractal IP traffic: Characterization of packet arrivals and packet sizes using stochastic L-Systems. In: 10th International Conference on Telecommunication Systems, Modeling and Analysis. (2002) 577–587 8. Salvador, P., Nogueira, A., Valadas, R.: Joint characterization of the packet arrival and packet size processes of multifractal traffic based on stochastic L-Systems. In: 18th International Teletraffic Congress, ITC 18. (2003) 9. Salvador, P., Nogueira, A., Valadas, R.: Framework based on stochastic L-Systems for modeling IP traffic with multifractal behavior. In: SPIE Conference on Performance and Control of Next Generation Communication Networks, ITCom 2003. (2003)