metals Article
Numerical Simulation of Transient Multiphase Flow in a Five-Strand Bloom Tundish during Ladle Change Hua Zhang 1 , Ronghua Luo 2 , Qing Fang 1 1 2
*
ID
, Hongwei Ni 1, * and Xiao Song 1
The State Key Laboratory of Refractories and Metallurgy, Wuhan University of Science and Technology, Wuhan 430081, China;
[email protected] (H.Z.);
[email protected] (Q.F.);
[email protected] (X.S.) Valin Xiangtan Iron and Steel Co., Ltd., Xiangtan 411101, China;
[email protected] Correspondence:
[email protected]; Tel.: +86-027-6886-2811
Received: 30 December 2017; Accepted: 13 February 2018; Published: 23 February 2018
Abstract: The steel-slag-air multiphase flow in a bloom tundish with five strands during the transient casting of the ladle change was simulated using the Volume of Fluid (VOF) model, and the formation mechanisms of macro-inclusions and the behavior of the steel-slag-air interface during the filling process were investigated. Water model experiments were conducted to validate the multiphase model. The results showed that the numerical results of slag entrapment behavior and the exposed area of steel are basically consistent with the experimental results. The flow of molten steel in the tundish is weak except for the region around the stopper rods at the end of the emptying process. Strong fluctuations in liquid level were formed during the filling process, showing two wave crests in front of and behind the shroud in the impact zone, which intensified with the increase in filling time and then declined gradually. Entrapment phenomena and exposure of liquid steel could not be observed before the filling stage. While the entrapped slag droplets mostly float up and can be removed within 40 s during the filling process, the remainder enters the casting zone through the baffle. The maximum exposed area of molten steel is 252 cm2 when the filling time is 4.0 s. Keywords: tundish; ladle change; numerical simulation; multiphase VOF model; transient flow
1. Introduction A transient casting process refers to a casting process in which the flow rates at the inflow and outflow differ (e.g., a ladle change) [1], and has become a key method for obtaining high-quality clean steel in continuous casting. Unfortunately, re-oxidation and the entrapment of slag during transient-state casting are much more serious issues than in steady-state casting, and lead to the number of billet quality defects being significantly higher [2,3]. The inlet/outlet conditions of the tundish change greatly during the ladle change period, leading the liquid level of the bath to rise and fall rapidly. The steel-slag interface fluctuations show instability, and the flow pattern changes significantly, meaning it has the apparent characteristics of transient flow. In particular, the ladle change operation between the previous and the next ladle of steady casting occurs repeatedly in a complete casting process, which is detrimental to overall quality control of continuous casting. During the ladle change of the continuous casting process, minimizing the negative effects at the transient casting stage is a challenge faced by the world’s metallurgists [4,5]. At present, most numerical investigations of the tundish have only considered the steady casting process using flow field modeling. Simulations of transient casting [6–13] are still only rarely undertaken. Takahashi et al. [7] simulated the velocity field in slab tundish during the ladle change, and provided a basis for predicting the change of the floating condition of inclusions. Bolling et al. [1] and Warzecha [8] studied the transient fluid flow and thermal distribution for a single-strand tundish by numerical simulation during the ladle change and steady-state casting. The Computational Fluid Dynamics (CFD) results
Metals 2018, 8, 146; doi:10.3390/met8020146
www.mdpi.com/journal/metals
Metals 2018, 8, 146
2 of 13
were verified using a water model experiment with Laser Doppler Anemometry (LDA) and Digital Particle Image Velocimetry (DPIV) measurements. Zhang et al. [4,9–11] studied fluid flow, heat transfer, and inclusion removal in a 2-strand 60 t slab tundish in the steady state and transient state by isothermal and non-isothermal numerical simulations . This study included cast start, sudden cast stop, ladle change, and the sudden closing of one strand, and gives us some valuable information on improving the cleanliness of molten steel. However, the liquid level fluctuation and the slag-gas two-phase behaviors in the bath were not considered. Fernandez et al. [12] calculated the steel-gas two-phase flow in an industrial tundish during grade transition casting by using a three-dimensional, unsteady Volume of Fluid (VOF) model. The changes in liquid level and flow field in the tundish during the ladle change were investigated. The simulation considered the relationship between the intermixed concentration distribution of steel and the duration of the filling stage, but the slag phase was ignored. At present, to the authors’ knowledge, the understanding of transient flow in the tundish is still lacking. Investigations relating to steel-slag-air three-phase behaviors in simulations of multi-strand tundish during ladle change have rarely been reported. The three-dimensional multiphase (air-slag-steel) flow during the ladle change process of a five-strand bloom tundish was simulated by a multiphase VOF model in this paper. The changes of flow field before and after the ladle change were investigated in order to deepen our understanding of the behavior of the air-slag-steel interface, and provide a theoretical basis for adjusting the transient-state casting operation and improving the quality of the billet. Additionally, water model experiments of slag entrapment behavior and the exposed area of steel in the impact zone were conducted and computed to validate the numerical multiphase model. 2. Model Descriptions 2.1. Basic Assumptions The actual fluid flow in a tundish is a complicated physical and chemical process. The principal assumptions made in the modeling of the transient fluid flow during the ladle change are as follows: (1) (2) (3) (4) (5)
There are no chemical reactions among the phases in a molten bath; The cover slag is regarded completely as a liquid in the tundish; Air, slag and molten steel are treated as incompressible viscous fluids with the fixed physical properties; There is no slip and interpenetration among the fluids; The influence of temperature on the flow field in the tundish is ignored.
2.2. Governing Equations In order to accurately investigate the dynamic behavior of the three phases flow in the tundish during the ladle change, a multiphase VOF model is applied to calculate the behavior of the steel-slag-air interfaces. Since a void region is not allowed in this model, the volume fractions of all phases sum to unity in each control volume. n
∑ αi = αair + αslag + αsteel = 1
(1)
i =1
The fields for all variables and properties are shared by the phases and represent volume-averaged values, as long as the volume fraction of each of the phases is known at each location. Thus, the volume fraction average properties in any given control cell are computed in the following form, such as for volume fraction average density (ρm ) and viscosity (µm ): n
ρm =
∑ αi ρi , µ m =
i =1
n
∑ αi ρi
i =1
(2)
Metals 2018, 8, 146
3 of 13
where αi and ρi are the volume fraction and density of phase i, respectively. (1)
The multiphase VOF model [1] can be expressed as follows: Continuity equation: n → 1 ∂ [ (αi ρi ) + ∇(αi ρi v m ) = ∑ (m→ − m→ ) ij ji ρi ∂t i =1
(3)
where m→ is the mass of phase i flow into phase j; and m→ is the mass of phase j flow into phase i, ij
→
ji
v m is the velocity of mixture. Momentum equation: →
→ → → → →T → ∂(ρm v m ) + ∇·(ρm v m v m ) = −∇p + ∇[µm (∇ v m + ∇ v m )] + ρm g + F ∂t
(4)
→
where F is the surface tension force item: →
n
F = 2σt ρm k i ∇αi / ∑ ρi
(5)
i =1
where σt is the surface tension coefficient, and k i is the curvature, the surface tension coefficient value between steel and slag is 1.4. (2)
The fluid flow in the tundish is a complicated turbulent flow, and turbulence modeling is expressed through the standard k-ε model. Turbulence kinetic energy equation: → ∂(ρm k ) µt,m ∇k) + Gk,m − ρm ε + ∇·(ρm v m k) = ∇·( ∂t σk
(6)
Rate of dissipation equation: → ∂(ρm ε) µt,m ε + ∇·(ρm v m ε) = ∇·( ∇ε) + (Cl,s Gk,s − c2,s ρm ε) ∂t σε k
(7)
In these equations, the effective viscosity µt,m and the generation of turbulence energy Gk,m can be calculated as follows: µt,m = µm + µt = µm +
ρm cµ k2 → → →T , Gk,m = µt ∇ v m (∇ v m + ∇ v m ) ε
(8)
where Cl,s , c2,s , cµ , σk and σε are the empirical constants of the k-ε model. The values of these constants are 1.43, 1.92, 0.09, 1.0 and 1.3, respectively; µt is the turbulent viscosity. 2.3. Boundary Conditions The transient casting of the ladle change in the tundish can be divided into two processes (Figure 1), in which the W tundish is the weight of liquid steel, and the Qsteady (2.66 × 10⁻³ m3 /s) refers to the flow rate of liquid steel at steady state. The first process involved the level of molten steel dropping at the emptying stage when the slide gate of the ladle was closed. The second involved the liquid level rising during the filling process while the slide gate was open.
Metals 2018, 2018,8,8,x146 Metals Metals 2018, 8, x
of 13 13 44 of 4 of 13
Figure 1. Process diagram of the ladle change in the tundish. Figure Figure 1. 1. Process Process diagram diagram of of the the ladle ladle change change in in the the tundish. tundish.
According to actual fluid flow in the tundish, the boundary conditions of the model can be According to actual fluid flow in the tundish, the boundary conditions of the model can be According to actual fluid flow in the tundish, the boundary conditions of the model can be determined as follows: determined as follows: determined as follows: (1) The shroud was given the pressure-inlet in the emptying process and velocity-inlet in the (1) The shroud was given the pressure-inlet in the emptying process and velocity-inlet in the The shroud was givenThe the pressure-inlet in thefor emptying and velocity-inlet in the filling(1)process, respectively. boundary values k and ε process at the inlet were calculated asfilling k = filling process, respectively. The boundary values for k and ε at the inlet were calculated as k = process, respectively. calculatedand as k diameter = 0.01 u2inlet 0.01 , ε = 2k .. /The boundary , where values the for k and andε at the inlet are were the velocity of, 0.01 1.5 , ε = 2k / , where the and are the velocity and diameter of ε = 2k /dinlet ,inlet. where the uinlet and dinlet are the velocity and diameter of computational inlet. computational computational inlet. (2) The The outlet outlet of of the the tundish tundish was was set set as as the velocity-outlet, velocity-outlet, and and the the velocity velocity could could be calculated (2) (2) The outlet of the tundish was set as the velocity-outlet, and the velocity could be calculated from the casting speed and section size. from the casting speed and section size. (3) The The top top surface surface of of the the tundish tundish was was used used as the pressure-inlet, and standard atmospheric (3) (3) The top surface of the tundish was used as the pressure-inlet, and standard atmospheric pressure was chosen for the pressure value. pressure was chosen for the pressure value. (4) The The horizontal horizontal components components of of the the velocity velocity and and horizontal horizontal gradient gradient of of all all the the gradients gradients of the (4) (4) The horizontal components of the velocity and horizontal gradient of all the gradients of the symmetry plane were set at zero. symmetry plane were set at zero. (5)The Thesolid solidwall wallof ofthe thetundish tundish was was considered considered aa no-slip no-slip boundary boundary condition condition and and the the near-wall near-wall (5) (5) The solid wall of the tundish was considered a no-slip boundary condition and the near-wall region was treated as a standard wall function. region was treated as a standard wall function. 2.4. Numerical Numerical Method Method 2.4. 2.4. Numerical Method A three-dimensional three-dimensional mathematical mathematical model model was was established established according according to to the the real real size size of of the the A A three-dimensional mathematical model was established according to the real size of the industrial tundish tundish (Figure (Figure 2), 2), and and considering considering the the symmetry symmetry of of the the tundish, tundish, half half of of the the real real tundish tundish industrial industrial tundish (Figure 2), and considering the symmetry of the tundish, half of the real tundish was taken as the computational domain. The main process parameters of the continuous caster are was taken as the computational domain. The main process parameters of the continuous caster are was taken as the computational domain. The main process parameters of the continuous caster are listed in Table 1. After the shroud was inserted into the molten bath, a layer of slag would float on the listed in Table 1. listed in Table 1. liquid level and the air would fill up thethe rest of thebath, spacea in the of shroud beforefloat opening theliquid ladle level slide After the shroud was inserted into molten layer slag would on the After the shroud was inserted into the molten bath, a layer of slag would float on the liquid level gate in the ladle change process. To truly model the ladle change process, the solution initialization of and the air would fill up the rest of the space in the shroud before opening the ladle slide gate in the and the air would fill up the rest of the space in the shroud before opening the ladle slide gate in the the model took into consideration thatthe theladle slag change layer and air column existed in the shroud,ofasthe shown in ladle change process. To truly model process, the solution initialization model ladle change process. To truly model the ladle change process, the solution initialization of the model Figure 3. took into consideration that the slag layer and air column existed in the shroud, as shown in Figure 3. took into consideration that the slag layer and air column existed in the shroud, as shown in Figure 3.
Figure Figure 2. 2. Configuration Configuration of of the the industrial industrial tundish. tundish. Figure Configuration of
Metals 2018, 8, 146 Metals 2018, 8, x
5 of 13 5 of 13
Figure 3. Schematic of solution initialization during the ladle change. Figure 3. Schematic of solution initialization during the ladle change. Table 1. Main process parameters. Table 1. Main process parameters. Casting Condition Casting Condition Working capacity of tundish, t Bloom cross section, mm2 t Working capacity of tundish, Casting speed, m/min Bloom cross section, mm2 Height of molten steel, mm Casting speed, m/min Height of molten steel, mm Inner diameter of nozzle, mm Inner diameter of nozzle, mmmm Submergence depth of nozzle, Submergence nozzle, Thickness depth of slagoflayer, mmmm Thickness of slag layer, mm
Value Value35 280 35 × 380 280 × 0.63 380 0.63800 800 81 81 310 310 40 40
The mathematical model was solved by CFD commercial software FLUENT 12.1 (Ansys Inc., The mathematical was(Pressure solved by CFD commercial software FLUENT 12.1 (Ansys Inc., Canonsburg, PA, USA). model The PISO Implicit with Splitting of Operators) algorithm was used Canonsburg, PA,pressure USA). The PISO (Pressure with Splitting of Operators) wasbyused for coupling the and velocity terms.Implicit Additionally, the interface of fluidsalgorithm was tracked the for coupling themethod pressure andTovelocity terms. Additionally, the interfaceinterface of fluidsand wasimpact tracked by Geo-reconstruct [14]. simulate the behavior of the steel-slag-air zone the Geo-reconstruct method [14]. To simulate the behavior of the steel-slag-air interface and impact more accurately, local grid refinement technology was applied, and the meshes of the FLUENT zone more accurately, grid refinement technology was applied, andcells, the meshes of the FLUENT computational domainlocal included non-uniform grids with about 300,000 as shown in Figure 4. computational domain included non-uniform grids with about 300,000 cells, as shown in Figure 4. Simultaneously, mesh refinement of the steel-slag interface was considered. Under the precondition Simultaneously, mesh speed, refinement of theofsteel-slag was 3considered. Under precondition of of unchanged casting the time the ladleinterface change was min from the gatethe closing in the last heat to the gate opening inthe thetime nextof heat. fieldwas at the endfrom of emptying was initial unchanged casting speed, the The ladleflow change 3 min the gate process closing in thethe last heat period of the fillinginprocess, theThe steel flow rate was 2 process times that normal to the gate opening the nextand heat. flow field at of thethe endshroud of emptying wasofthe initialsteadyperiod state The convergence criterion wasofestablished the sum residuals for the of thecasting. filling process, and the steel flow rate the shroud when was 2 times thatofofall normal steady-state dependent is less criterion than 10−4.was Moreover, the under of moment, pressure, k, ε casting. Thevariable convergence established whenrelaxation the sum offactors all residuals for the dependent and energy were reduced values between 0.2relaxation and 0.6 to factors improve convergence history. A typical variable is less than 10−4 . to Moreover, the under of the moment, pressure, k, ε and energy calculation fortothe simulation of0.2 360and s, with conditions of the starting zeroAvelocity and a were reduced values between 0.6 tothe improve the convergence history. typical field calculation time step of 0.005 s,ofrequired 600 h computational using anzero Intelvelocity Core i5 field CPU and 2.8 GHz with 4.00 for the simulation 360 s, with the conditions oftime the starting a time step of GB ofs,RAM. The 600 physical parameters time of theusing fluidsanused thei5transient are presented in 0.005 required h computational Intelfor Core CPU 2.8simulation GHz with 4.00 GB of RAM. Table 2. The physical parameters of the fluids used for the transient simulation are presented in Table 2.
Metals 2018, 8, 146
6 of 13
Metals 2018, 8, x
6 of 13
Metals 2018, 8, x
6 of 13
Figure 4. Computational mesh.
Figure 4. Computational mesh. Table 2. Physical parameters of fluid used in simulation.
Table 2. Physical parameters of fluid used in simulation. Slag 2700 Slag 0.6
Steel 7000 Steel 0.0065
mesh. 1.225 2700 Density, kg/m3 Figure 4. Computational 0.6 1.79 × 10⁻⁵
7000 0.0065
Property Density, kg/m3 Property Viscosity, pa∙s
Air 1.225 Air 1.79 × 10⁻⁵
3. Results and Discussion Viscosity, pa·s
Table 2. Physical parameters of fluid used in simulation.
3.1. Model Validations
3. Results and Discussion
Property
Air
Slag
Steel
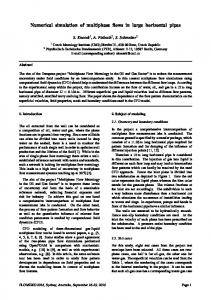
3 Density, 1.225 7000 by the 1:3 water model The simulation results of kg/m the multiphase flow field 2700 were verified Viscosity, pa∙s × 10−5 0.6 for the 0.0065 experiments. Detailed information about the1.79 equipment used water model experiments can 3.1. Model Validations be found elsewhere [15]. The vacuum pump oil in yellow on the top of the water model was used to 3. Results andslag Discussion The simulation results of the multiphase flow(We) fieldcriteria wereare verified the 1:3 water represent the phase. The Froude (Fr) and Weber suitable by for investigations of model surface waves and interaction of interfaces, in which the real Froude andthe Weber numbers are experiments equal experiments. Detailed information about the equipment used for water model 3.1.the Model Validations to Froude and Weber numbers of thepump water model [16]. Theon ratio flowofvelocity, flowmodel rate, and can be found elsewhere [15]. The vacuum oil in yellow theoftop the water was used duration of time between the of water model and numerical model were calculated to 1:3 be 0.577, 0.06145 The simulation results the multiphase flow field were verified by the water model to represent the slag phase. The Froude (Fr) and Weber (We) criteria are suitable for investigations of and 0.577, respectively, based on theabout geometric ratio and similarity exposed area of steel experiments. Detailed information the equipment used for number. the waterThe model experiments can surface waves and interaction of interfaces, in which the real Froude and Weber numbers are equal in impact zone and slag entrapment was filmed and calculated to of validate the model simulation bethe found elsewhere [15]. The vacuum pump oil in yellow on the top the water was results. used to to the Froude Weber numbers ofthe thesimulation water model [16]. The ratioresults of flow velocity, flow at rate, and Figure 5and shows thephase. comparison of and the experimental offor slag entrapment represent the slag The Froude (Fr) and Weber (We) criteria are suitable investigations of duration of time between the water model and numerical model were calculated to be 0.577, 1.3 s (a) waves and theand exposed area of in the in impact at 12Froude s (b), respectively, in whichare theequal dark 0.06145 surface interaction of steel interfaces, whichzone the real and Weber numbers blue areas in the left of Figure 5a,b represent the slag phase; the color change of the slag phase means and 0.577, respectively, on the geometric and similarity The exposed to the Froude and based Weber numbers of the waterratio model [16]. The ratio number. of flow velocity, flow rate,area and of steel aduration change of time slag volume fraction. Table 3 lists the statistical comparisons between exposed area results. between the water model and numerical model were to calculated tothe be 0.577, 0.06145 in the impact zone and slag entrapment was filmed and calculated validate the simulation of steel in the impact zone andonthe experimental results at different moments. can 0.577, respectively, based thenumerical geometricand ratio and similarity number. The exposed areaentrapment ofItsteel Figure 5and shows the comparison of the simulation and the experimental results of slag at be seen from zone Figure 5 and 3 that was the simulated of slag entrapment behavior and the in the impact and slag Table entrapment filmed andresults calculated to validate the simulation results. 1.3 s (a) exposed and thearea exposed area of steel inconsistent the impact zone at 12 s (b), respectively, in which the dark blue ofthe steel are basically with the theentrapment errors of the Figure 5 shows comparison of the simulation and theexperimental experimentalresults, results and of slag at areas incomputed the left of Figure 5a,b represent the slag phase; the color change of the slag phase exposed area ofarea steelofinsteel the impact zone byzone the numerical at different moments aremeans a 1.3 s (a) and the exposed in the impact at 12 s (b), model respectively, in which the dark change within of slag volume fraction. 3 lists the exposed 5% of experimental results. blue areas in the left of FigureTable 5a,b represent thestatistical slag phase; comparisons the color changebetween of the slagthe phase means area of
change of slag volume fraction. Table 3 lists statistical comparisons themoments. exposed area steel in athe impact zone and the numerical andthe experimental results atbetween different It can be of steel in the impact zone and the and experimental at different moments. canexposed seen from Figure 5 and Table 3 that thenumerical simulated results of slag results entrapment behavior andItthe seen from Figure 5 and Table 3 that the simulated results of slag entrapment behavior and the area of be steel are basically consistent with the experimental results, and the errors of the computed exposed area of steel are basically consistent with the experimental results, and the errors of the exposedcomputed area of steel in the impact zone by the numerical model at different moments are within 5% of exposed area of steel in the impact zone by the numerical model at different moments are the experimental results. within 5% of the experimental results.
(a)
(b)
Figure 5. Comparison of the simulation and experimental results of slag entrapment at 1.3 s (a) and the exposed area of steel in the impact zone at 12 s (b).
(a)
(b)
Figure 5. Comparison of the simulation and experimental results of slag entrapment at 1.3 s (a) and
Figure 5. Comparison of the simulation and experimental results of slag entrapment at 1.3 s (a) and the the exposed area of steel in the impact zone at 12 s (b). exposed area of steel in the impact zone at 12 s (b).
Metals 2018, 8, 146
7 of 13
Table 3. Statistical comparison of the numerical and experimental results of the exposed area of steel in Metals 2018,zone. 8, x 7 of 13 the impact Table 3. Statistical comparison of the numerical and experimental results of the2exposed area of steel Time, s Errors, % Numerical Results, cm2 Experimental Results, cm in the impact zone.
1.3 5Time, s 20 1.3 5 20
167 Numerical 188Results, cm2 167 163 188 163
3.2. The Flow Field of Molten Steel in the Tundish
174 Experimental Results, cm2 197 174 168 197 168
4.2 Errors,4.6 % 4.2 3.0 4.6 3.0
3.2.variation The Flow Field of Molten Steel field in the in Tundish The of the steel flow the tundish is shown in Figure 6. Figure 6a shows the flow field of molten steel at an emptying time of (filling timeinofFigure 0 s), which suggests the liquid The variation of the steel flow field in3.0 the min tundish is shown 6. Figure 6a showsthat the flow field of molten at anposition, emptyingand timethe of 3.0 min (filling 0 s),very which suggests that the liquid level dropped to thesteel lowest molten steel time flowofwas weak throughout the whole level dropped to thethe lowest position, the molten flow was very throughout the whole tundish, except around region of theand stopper rods. steel From Figure 6a–d,weak it can be seen that the molten tundish, except around thestrengthened, region of the stopper rods. From Figureof6a–d, can be seen that the steel flow in the tundish was apparently because the itsteel jets stirring atmolten high speed steel flow in the tundish was strengthened, apparently because of the steel jets stirring at high speed during the filling process. In particular, the flow speed of the impact zone is higher. As the filling during the filling process. In particular, the flow speed of the impact zone is higher. As the filling time increased, the stronger flow volume of the molten steel continued to expand and the liquid level time increased, the stronger flow volume of the molten steel continued to expand and the liquid level rose dramatically. The The “dead zone” ininthe almostdisappeared disappeared by the the filling rose dramatically. “dead zone” thetundish tundish had had almost by the end end of theoffilling time (180.0 s), and surface returned toto approximately steadycasting castingheight, height, shown in time (180.0 s),the andliquid the liquid surface returned approximately the the steady as as shown Figurein6d. Figure 6d.
Figure 6. Change of the steel flow field before and after the filling of the tundish. (a) 0 s; (b) 60 s; (c)
Figure 6. Change of the steel flow field before and after the filling of the tundish. (a) 0 s; (b) 60 s; 120 s; (d) 180 s. (c) 120 s; (d) 180 s. Figure 7 shows the velocity vector (left) and the turbulent kinetic energy distribution (right) of the molten steel level in steadyvector and unsteady casting a fillingkinetic time of energy 60 s), which was calculated Figure 7 shows the velocity (left) and the(with turbulent distribution (right) of using the standard k-ε model. The steel flow of the surface in the impact zone is obviously stronger the molten steel level in steady and unsteady casting (with a filling time of 60 s), which was calculated than that in the casting zone, and the turbulent kinetic energy is higher in the impact zone. using the standard k-ε model. The steel flow of the surface in the impact zone is obviously stronger than Simultaneously, the molten steel flow is stable and uniform in the casting zone close to the baffle, but that initthe casting zone, and the turbulent kinetic energy is higher in the impact zone. Simultaneously, is too slow on both sides of the tundish. In transient casting, during the filling process, the steel the molten steelinflow is stableisand uniform in thethan casting zone close to theand baffle, but it isvelocity too slow on level flow the tundish obviously stronger in steady-state casting, the highest both sides of the tundish. In transient casting, during the filling process, the steel level flow in the tundish is obviously stronger than in steady-state casting, and the highest velocity exceeds 0.24 m/s in
Metals 2018, 8, 146 Metals Metals2018, 2018,8,8,x x
8 of 13 8 8ofof1313
exceeds 0.24 m/s Additionally, turbulent kinetic energy maximum exceeds 0.24 m/sin inthe theimpact impactzone. zone. Additionally, the turbulent kinetic energyreaches reaches the0.04 maximum the impact zone. Additionally, the turbulent kineticthe energy reaches the maximum valuethe of m2 /s2 , 2 2 2 2 2 2 2 2 2 2 value /s/s, ,which isismuch than casting (0.002 mm/sfor The for valueofis of0.04 0.04mmhigher which much higher thanthat thatofofthe thesteady steady casting (0.002 /s).).this Thereason for which much than that ofhigher the steady casting (0.002 m /s ). The reason isreason that the this is that the molten steel in the impact zone achieves a greater stirring power under the impact of this is that the molten steel in the impact zone achieves a greater stirring power under the impact molten steel in the impact zone achieves a greater stirring power under the impact of the steel jet fromof the the ladle the filling process, causes the molten surface totofluctuate atat thesteel steeljet jetfrom fromthe thefilling ladleduring during the filling process, which causes theto molten surface fluctuate the ladle during process, which causes thewhich molten surface fluctuate at different levels. different the interface ininthe zone aacontinuously unsteady state, different levels.Then, Then, thesteel-slag steel-slag interface impact zoneisisinin continuously unsteady state, Then, thelevels. steel-slag interface in the impact zone isthe inimpact a continuously unsteady state, which can easily which can easily lead to entrapment and steel re-oxidation. Therefore, the steel level fluctuations which can easily lead to entrapment and steel re-oxidation. Therefore, the steel level fluctuations lead to entrapment and steel re-oxidation. Therefore, the steel level fluctuations cannot be neglected in cannot be ininthe zone during the cannot beneglected neglected theimpact impact zone during thetransient transientcasting castingprocess. process. the impact zone during transient casting process.
Figure Velocity Figure7. Velocityvectors vectorsand andthe theturbulent turbulentkinetic kineticenergy energydistribution distributionof ofthe themolten moltensteel steellevel levelin Figure 7.7.Velocity vectors and the turbulent kinetic energy distribution of the molten steel level inin steady and unsteady casting (filling time ofof60 s): (a) steady casting; (b) unsteady casting. steady and unsteady casting (filling time 60 s): (a) steady casting; (b) unsteady casting. steady and unsteady casting (filling time of 60 s): (a) steady casting; (b) unsteady casting.
Figure Figure8a–d 8a–dshows showsthe thesteel steellevel levelfluctuations fluctuationsofofthe thex-direction x-directionsection sectionininthe theimpact impactzone zoneatat Figure 8a–d shows thes, steel level fluctuations of the x-direction section in theinimpact zone atsurface filling filling times of 5.0 s, 60.0 120.0 s, and 180.0 s, respectively. Two wave crests the molten filling times of 5.0 s, 60.0 s, 120.0 s, and 180.0 s, respectively. Two wave crests in the molten surface times of 5.0 s, 60.0 s,from 120.0 s, and 180.0 s, back respectively. shroud Two wave crests in the molten surface about 0.2the m about about0.2 0.2mmaway away fromthe thefront frontand and backofofthe the shroudininthe theimpact impactzone zonecan canbe beseen, seen,and and the away from the front and back of the shroud in the impact zone can be seen, and the fluctuation of the fluctuation fluctuationofofthe thesymmetry symmetryplane plane(section (sectionxx==0)0)isisthe thelargest largestand andhighest highestininthe theimpact impactzone. zone.As Asthe the plane (section the x = 0) is the largest and highest in the impact zone. As the xand coordinate increases, xsymmetry coordinate increases, fluctuation of the steel level decreases gradually, the wave crests x coordinate increases, the fluctuation of the steel level decreases gradually, and the wave crests the fluctuation of thesection steel level decreases gradually, and filling the wave crests disappearheight when the section is disappear disappearwhen whenthe the sectionisisbeyond beyondxx==0.25 0.25m. m.As Asthe the fillingtime timeincreases, increases,the the heightofofthe theliquid liquid beyond x = 0.25 m. As the filling time increases, the height of the liquid level rises gradually, but the level level rises rises gradually, gradually, but but the the fluctuation fluctuation range range decreases decreases gradually gradually inin the the impact impact zone. zone. fluctuation range decreases gradually in the impact zone. Simultaneously, the area of the fluctuation Simultaneously, Simultaneously,the thearea areaofofthe thefluctuation fluctuationregion regionfirst firstincreases increasesand andthen thendecreases decreasesininthe theimpact impact regionasfirst increases and then decreases in the impact zone as time increases, as shown in Figure 8. zone zone astime timeincreases, increases,asasshown shownininFigure Figure8.8.
Figure 8.8.Level Level fluctuation x-axis sections times ininthe impact Figure8. Level fluctuation ofthe the x-axis sections withdifferent different fillingin times thezone. impact zone. Figure fluctuation ofof the x-axis sections withwith different fillingfilling times the impact (a)zone. 5.0 s; (a) 5.0 s; (b) 60.0 s; (c) 120.0 s; (d) 180.0 s. (a)60.0 5.0 s; 60.0 s;s;(c) (b) s; (b) (c) 120.0 (d)120.0 180.0s;s.(d) 180.0 s.
Metals 2018, 8, 146
9 of 13
Metals 2018, 8, x
9 of 13
The fluctuation fluctuation of of the the molten molten surface surface in in the the impact impact zone zone during during the the filling filling process process is is shown shown in in The Figure 9. In the early stage of the filling process, due to the steel jet strongly impacting on the tundish, Figure 9. In the early stage of the filling process, due to the steel jet strongly impacting on the tundish, the fluctuation fluctuation range range in in the the impact impact zone zone rises rises sharply, sharply, and at aa filling filling the and reaches reaches the the maximum maximum of of 36 36 mm mm at time of 5.0 s. Thereafter, the fluctuation range in the impact zone begins to drop, but the change is not time of 5.0 s. Thereafter, the fluctuation range in the impact zone begins to drop, but the change is obvious at filling times between 5.0 s and 150.0 s, with a minute drop of 5 mm. When the filling time not obvious at filling times between 5.0 s and 150.0 s, with a minute drop of 5 mm. When the filling exceeds 150.0 150.0 s, thes,fluctuation of theof molten surface declines more quickly, and it drops 19 mm at time exceeds the fluctuation the molten surface declines more quickly, and it to drops to 19 the end of the filling process. mm at the end of the filling process.
Figure level in in the the impact impact zone. zone. Figure 9. 9. Height Height difference difference with with filling filling time time of of the the steel steel level
Based on the analysis above, the flowing state of molten steel in the tundish varies obviously Based on the analysis above, the flowing state of molten steel in the tundish varies obviously during the ladle change, reflecting a classical transient flow. In particular, the speed variation is faster during the ladle change, reflecting a classical transient flow. In particular, the speed variation is faster and the fluctuation range of the molten surface is greater in the impact zone, both before and after and the fluctuation range of the molten surface is greater in the impact zone, both before and after the filling period, than that of steady-state casting. These flow patterns will cause the slag or air to be the filling period, than that of steady-state casting. These flow patterns will cause the slag or air to be entrapped in the molten steel in the impact zone. Additionally, it may cause the exposure of molten entrapped in the molten steel in the impact zone. Additionally, it may cause the exposure of molten steel if the slag layer is broken by the strong impact. Therefore, it is necessary to analyze the interface steel if the slag layer is broken by the strong impact. Therefore, it is necessary to analyze the interface behaviors of the steel-slag-air three-phase to get further information on the filling process. behaviors of the steel-slag-air three-phase to get further information on the filling process. 3.3. Steel-Slag-Air Multiphase Behavior 3.3. Steel-Slag-Air Multiphase Behavior The air distribution in the molten bath of the impact zone is shown in Figure 10. It can be seen The air distribution in the molten bath of the impact zone is shown in Figure 10. It can be seen that the air in the shroud is brought into the molten bath by the steel jet after opening the shroud. that the air in the shroud is brought into the molten bath by the steel jet after opening the shroud. Due to the effect of the buoyancy force, most of the gas breaks away from the steel jet and quickly Due to the effect of the buoyancy force, most of the gas breaks away from the steel jet and quickly floats around the shroud. Then, most of the gas escapes to the atmosphere through the slag layer, and floats around the shroud. Then, most of the gas escapes to the atmosphere through the slag layer, and the rest of the gas disperses in the molten bath as smaller bubbles. With the large difference in density the rest of the gas disperses in the molten bath as smaller bubbles. With the large difference in density between the air and the steel, the bubbles remaining in the molten steel can be almost entirely between the air and the steel, the bubbles remaining in the molten steel can be almost entirely removed removed within 4.0 s during the filling period, as shown in Figure 10d. within 4.0 s during the filling period, as shown in Figure 10d. The distribution of slag in the tundish during the filling process is shown in Figure 11. Figure The distribution of slag in the tundish during the filling process is shown in Figure 11. Figure 11a 11a shows that the interface of the steel-slag is smooth and stable, and there isn’t the phenomenon of shows that the interface of the steel-slag is smooth and stable, and there isn’t the phenomenon of steel-slag entrapment or molten steel exposure before re-filling casting (the filling time). Figure 11b steel-slag entrapment or molten steel exposure before re-filling casting (the filling time). Figure 11b shows that the slag in the nozzle is brought into the molten bath by the steel jet, impacting at the shows that the slag in the nozzle is brought into the molten bath by the steel jet, impacting at the beginning of the filling stage. Then the slag is broken up into lots of slag droplets distributed through beginning of the filling stage. Then the slag is broken up into lots of slag droplets distributed through the molten steel, as illustrated in Figure 11c, arrow 1. Since there is a smaller difference in density the molten steel, as illustrated in Figure 11c, arrow 1. Since there is a smaller difference in density between the slag and molten steel, the entrapped slag droplets are hardly reduced at all in a short between the slag and molten steel, the entrapped slag droplets are hardly reduced at all in a short time time period, even though some of the droplets are brought into the casting zone through the diversion period, even though some of the droplets are brought into the casting zone through the diversion hole hole of the baffle, as shown by arrow 3 of Figure 11c. It is far more likely that droplets of small size of the baffle, as shown by arrow 3 of Figure 11c. It is far more likely that droplets of small size will will become entrapped in the mold and form macro-inclusions. Figure 11d shows that slag droplets become entrapped in the mold and form macro-inclusions. Figure 11d shows that slag droplets of of larger size are almost all removed within 40.0 s of the filling process and just a few smaller droplets larger size are almost all removed within 40.0 s of the filling process and just a few smaller droplets remained in the bath. remained in the bath.
Metals 2018, 8, 146 Metals 2018, 8, x Metals 2018, 8, x
10 of 13 10 of 13 10 of 13
Figure liquid atat thethe beginning of of recasting. (a) (a) 0.1 s; (b) s; (c)s;2.0 (d)s; Figure 10. 10. Air Airdistribution distributionin liquidsteel steel beginning recasting. s; 0.5 (b) (c)s;s; 2.0 Air distribution ininliquid steel at the beginning of recasting. (a) 0.10.1 s; (b) 0.5 0.5 s; (c) 2.0 (d) 4.0 s. (d) 4.0 4.0 s. s.
Figure 11. Slag distribution in the tundish bath. (a) 0 s; (b) 0.5 s; (c) 5.6 s; (d) 40 s. Figure 11. Slag bath. (a) s; (d) (d) 40 40 s. s. Figure 11. Slag distribution distribution in in the the tundish tundish bath. (a) 00 s; s; (b) (b) 0.5 0.5 s; s; (c) (c) 5.6 5.6 s;
During During the the filling filling process, process, the the nozzle nozzle jet jet from from the the ladle ladle is is rebounded rebounded and and forms forms up-stream, up-stream, while while During the filling process, theturbulence nozzle jet controller. from the ladle isthat, rebounded and forms up-stream, while the jet reaches to the bottom of the After two wave crests are the jet reaches to the bottom of the turbulence controller. After that, two wave crests areformed formedin infront front theand jet reaches the to the bottom of the turbulence which controller. caused After that,the two wave crests are formed in front of of and behind behind the nozzle nozzle in in the the impact impact zone, zone, which are are caused by by the impingement impingement of of the the up-stream. up-stream. of and behind the nozzlespreads in the impact zone, which are caused by the impingement of the up-stream. Finally, Finally, the the molten molten steel steel spreads around around to to aa surface surface flow. flow. Therefore, Therefore, the the cover cover slag slag layer layer is is pushed pushed Finally, the molten steel spreads around to athe surface flow. Therefore, the cover and slagthe layer is pushed open, and the molten steel is exposed due to intense impact of the up-stream strong open, and the molten steel is exposed due to the intense impact of the up-stream and the strong shear shear open,of and the molten steel is exposed due to the intense impact2of the up-stream and the strongof shear stress the surface flow in the impact zone (as shown by arrow in Figure 11c). The distribution stress of the surface flow in the impact zone (as shown by arrow 2 in Figure 11c). The distribution ofthe the stress of the the surface flow in thefilling impact zoneof(as shown120.0 by arrow 2shown in FigureFigure 11c). The distribution of slag slag layer layer in in the impact impactzone zone at at filling times times of 0.8 0.8 ss and and 120.0 ssare are shown in in Figure 12. 12. the slag layer in the impact zone at filling times of 0.8 s and 120.0 s are shown in Figure 12.
Metals 2018, 8, 146 Metals 2018, 8, x Metals 2018, 8, x
11 of 13 11 of 13 11 of 13
Figure 12. Slag layer shape in the impact zone. Figure Figure 12. 12. Slag Slag layer layer shape shape in in the the impact impact zone. zone.
According to the behaviors of the steel-slag-air three-phases at different times, illustrated in According According to to the the behaviors behaviors of of the the steel-slag-air steel-slag-air three-phases three-phases at at different different times, times, illustrated illustrated in in Figures 10 and 11, molten steel exposure in the impact zone is divided into two cases. In the first case, Figures Figures 10 10 and and 11, 11, molten molten steel steel exposure exposure in in the the impact impact zone zone is is divided divided into into two two cases. cases. In the first case, it is distributed mainly around the nozzle wall, which is caused by the gas brought through the slag itit is is distributed distributed mainly mainly around around the the nozzle nozzle wall, wall, which which is is caused caused by by the the gas gas brought brought through through the the slag slag layer in the beginning of the filling process, as shown in Figures 10b and 12a. In the second case, it is layer the filling filling process, process,as asshown shownin inFigures Figures10b 10band and12a. 12a.InInthe thesecond second case, layer in the beginning of the case, it it is distributed in the area in the front and back of the nozzle, which is due to the intense impact of the is distributed area front and back of the nozzle, which is due to the intense impact of distributed in in thethe area in in thethe front and back of the nozzle, which is due to the intense impact of the up-stream and the strong shear stress of the surface flow during the filling process, as shown in the up-stream strong shear stress thesurface surfaceflow flowduring duringthe thefilling filling process, process, as shown in up-stream andand thethe strong shear stress ofof the in Figures 11c and 12b. Figures Figures 11c 11c and and 12b. 12b. Based on the statistics of the area of the exposed region during the filling time, the relationship Based Based on on the the statistics statistics of of the the area area of of the the exposed exposed region region during during the the filling filling time, time, the the relationship relationship between the area of the exposed region and time in the two cases above is shown in Figure 13. between between the the area area of of the the exposed exposed region regionand andtime timein inthe thetwo twocases casesabove aboveisisshown shownin inFigure Figure13. 13.
Figure 13. The exposed area with the filling time. (a) 0~2.0 s; (b) 2.0~180 s. Figure13. 13. The The exposed exposed area areawith withthe thefilling fillingtime. time.(a) (a)0~2.0 0~2.0 s; s; (b) (b) 2.0~180 2.0~180 s. s. Figure
For the bubbles floating up through the slag layer, the exposure of the molten steel in case one For the bubbles floating up through the slag layer, the exposure of the molten steel in case one For the bubbles through slagreaches layer, the of area the molten in 0.8 cases,one begins appearing at afloating filling up time of 0.5 the s, and its exposure maximum of 124 steel cm2 at as begins appearing at a filling time of 0.5 s, and reaches its maximum area of 124 cm22 at 0.8 s, as begins appearing a filling time of 0.5 s, and reaches its maximum of air 124passing cm at through 0.8 s, as presented in Figureat13a. The duration of the exposure remained at 0.6 s area for the presented in Figure 13a. The duration of the exposure remained at 0.6 s for the air passing through presented in Figure The duration of the exposure remained 0.6 s 13b for the air passing through slag layer quickly, so13a. the influence on re-oxidation can be ignored.at Figure shows that in case two, slag layer quickly, so the influence on re-oxidation can be ignored. Figure 13b shows that in case two, slagexposure layer quickly, soatthe onofre-oxidation can exposed be ignored. 13b shows in case the begins a influence filling time 3.0 s, and the areaFigure increases quickly,that reaches a the exposure begins2 at a filling time of 3.0 s, and the exposed area increases quickly, reaches a two, the exposure begins a filling time of 3.0 to s, and the2 exposed area increases quickly, reaches a maximum of 252 cm ,2 and at then declines quickly 173 cm at a time of 6.0 s. Between the times of 6.0 maximum of 252 cm 2, and then declines quickly to 173 cm2 at a time of 6.0 s. Between the times of 6.0 2 at 252exposed cm , andarea then declines quickly to 173 cmfrom a148 time times of smaximum and 120.0 of s, the remains steady in the range to of 1766.0 cms.22.Between After thethe filling time s and 120.0 s, the exposed area remains steady in the range from 148 2to 176 cm . After the filling time 2 . After 6.0 s beyond and 120.0 s, the exposed areaarea remains steadydecreases in the range from to 176s.cm goes 120.0 s, the exposed apparently to 42 cm 148 at 180.0 The reasonthe forfilling such 2 goes beyond 120.0 s, the exposed area apparently decreases to 42 cm at 180.0 s. The reason for such goes beyond 120.0 s,tothe exposed resistance. area apparently to of 42 casting cm2 at 180.0 s. The reason for atime phenomenon is related up-stream With decreases the increase time and depth of the a phenomenon is related to up-stream resistance. With the increase of casting time and depth of the such a phenomenon is related to up-stream resistance. With the increase of casting time and depth molten bath, the resistance of the up-stream increases gradually, the fluctuation range of the steel molten bath, the resistance of the up-stream increases gradually, the fluctuation range of the steel of the molten the resistance of theflow up-stream increases theforce fluctuation of the levels, and thebath, velocity of the surface declines. Thus, gradually, the imp act and therange horizontal levels, and the velocity of the surface flow declines. Thus, the imp act force and the horizontal shearing stress declined accordingly, which leads to the slag layer gradually closing up. shearing stress declined accordingly, which leads to the slag layer gradually closing up.
Metals 2018, 8, 146
12 of 13
steel levels, and the velocity of the surface flow declines. Thus, the imp act force and the horizontal shearing stress declined accordingly, which leads to the slag layer gradually closing up. According to the analysis above, the fluid flow is a transient state in the tundish during the ladle change. The strong impact of the steel jet, steel/air entrapment, steel/slag entrapment and the exposure of molten steel occurring in the impact zone lead to quality defects of the billet that are more serious than those occurring in steady-state casting. To investigate the effect of secondary cooling types on the temperature field more specifically, the solidification process and structure in the continuous casting bloom, and the numerical results of the heat transfer and structure under the two cases mentioned above, are discussed and compared statistically. 4. Conclusions This work investigated the transient fluid flow phenomena in a five-strand bloom tundish during the ladle change of the continuous casting process. A three-dimensional mathematical model was developed with VOF to track the interface between different phases in the transient casting period. The main conclusions can be summarized as follows: (1) The simulated results of slag entrapment and the exposed area of steel in the impact zone are basically consistent with water model experiments. The VOF model is suitable for modeling the multiphase flow in tundish. The changing character of flow and the steel-slag-air phase’s interface behaviors can be predicted by numerical simulation during the ladle change process. (2) At the end of emptying process, the molten steel flow is very weak except in the region around the stopper rods in the tundish. However, during the filling process, the molten steel flows and stirs strongly, and the liquid level fluctuates obviously, with two wave crests in the front of and behind the shroud in the impact zone. As the filling time increases, the fluctuation area expands, and the range increases rapidly before later declining gradually. (3) The steel-slag interface is stable, and entrapment between different phases was not observed before the filling stage. However, it was found that slag entrapment occurred between steel and slag, between steel and air, and at the exposure area of steel. Most of the entrapped slag droplets rise up to be removed within 40 s and small parts enter into the casting area through the baffle. In addition, the area of molten steel exposed to air reaches its maximum value of about 252 cm2 at a filling time of 4.0 s, and then gradually declines. Acknowledgments: The authors would like to express their gratitude for the financial support by the National Natural Science Foundation of China No. 51471122, 51604200 and 51774217. Author Contributions: Hongwei Ni and Hua Zhang conceived and designed the study. Ronghua Luo performed the experiments and simulations. Hua Zhang and Qing Fang contributed to the result analysis and paper preparation. Ronghua Luo and Xiao Song wrote the manuscript. Conflicts of Interest: The authors declare no conflict of interest.
References 1. 2. 3. 4. 5.
Bolling, R.; Odenthal, H.; Pfeifer, H. Transient fluid flow in a continuous casting tundish during ladle change and steady-state casting. Steel Res. Int. 2005, 76, 71–80. [CrossRef] Sahai, Y. Tundish technology for casting clean steel: A review. Metall. Mater. Trans. B 2016, 47, 2095–2106. [CrossRef] Liu, Z.; Li, B.; Zhang, L.; Xu, G. Analysis of transient transport and entrapment of particle in continuous casting mold. ISIJ Int. 2014, 54, 2324–2333. [CrossRef] Ling, H.; Zhang, L. Numerical simulation of the growth and removal of inclusions in the molten steel of a two-strand tundish. JOM 2013, 65, 1155–1163. [CrossRef] Cho, S.M.; Kim, S.H.; Thomas, B.G. Transient fluid flow during steady continuous casting of steel slabs: Part I. Measurements and modeling of two-phase flow. ISIJ Int. 2014, 54, 845–854. [CrossRef]
Metals 2018, 8, 146
6. 7. 8. 9. 10.
11. 12.
13.
14. 15.
16.
13 of 13
Alaei, A.R.; Edris, H.; Shirani, E. Upward molten flow for optimization of fluid flow in continuous casting tundish. J. Iron Steel Res. Int. 2010, 17, 34–39. [CrossRef] Takahashi, K.; Ando, M.; Ishii, T. Numerical investigation of unsteady molten steel flow and inclusion behavior in the tundish in the ladle change period. ISIJ Int. 2014, 54, 304–310. [CrossRef] Warzecha, M. Numerical and physical modelling of steel flow in a one-strand continuous casting tundish. Metalurgija 2011, 50, 147–150. Zhang, L. Transient fluid flow phenomena in continuous casting tundishes. Iron Steel Technol. 2010, 7, 55–69. Ling, H.; Zhang, L.; Li, H. Mathematical modeling on the growth and removal of non-metallic inclusions in the molten steel in a two-strand continuous casting tundish. Metall. Mater. Trans. B 2016, 47, 2991–3012. [CrossRef] Ling, H.; Zhang, L.; Wang, H. Effect of different removal conditions on the growth and removal of inclusions in the molten steel in a two-strand tundish. Metall. Res. Technol. 2017, 114, 516. [CrossRef] Fernandez, J.M.O.; Morros, C.S.; Somoano, J.R.; Ordieres, M.A. Multiphase modelling of the steel grade transition in a continuous casting tundish. In Proceedings of the ASME 2009 Fluids Engineering Division Summer Meeting, Vail, CO, USA, 2–6 August 2009; pp. 2183–2194. Siddiqui, M.I.H.; Jha, P.K. Multi-phase analysis of steel-air-slag system during ladle change-over process in CC tundish steelmaking process. In Proceedings of the Asia Steel International Conference, Yokohama, Japan, 5–8 October 2015. Youngs, D.L. Time-dependent multi-material flow with large fluid distortion. In Numerical Methods in Fluid Dynamics; Morton, K.W., Baines, M.J., Eds.; Academic Press: Cambridge, MA, USA, 1982; pp. 273–285. Odenthal, H.J.; Bölling, R.; Pfeifer, H. Three-dimensional LDA and DPIV investigations of tundish water models. In Proceedings of the 2nd International Conference on the Science & Technology of Steelmaking, Swansea, UK, 10–11 April 2001; pp. 499–517. Sahai, Y.; Emi, T. Physical modeling of melt flow in continuous casting tundishes. In Proceedings of the International Conference on Modelling and Simulation in Metallurgical Engineering and Materials Science, Beijing, China, 11–13 June 1996. © 2018 by the authors. Licensee MDPI, Basel, Switzerland. This article is an open access article distributed under the terms and conditions of the Creative Commons Attribution (CC BY) license (http://creativecommons.org/licenses/by/4.0/).