Aug 27, 2007 - arithmetic unit structures (e.g., ripple-carry adder, carry-lookahead adder ... at the normal 0.9V supply voltage and all the synthesized adders.
On the Selection of Arithmetic Unit Structure in Voltage Overscaled Soft Digital Signal Processing Yang Liu and Tong Zhang
Electrical, Computer, and Systems Engineering Department Rensselaer Polytechnic Institute, Troy, NY 12180 {liuy8,
zhangt4}@rpi.edu
ABSTRACT A soft digital signal processing (DSP) design paradigm has been recently proposed to reduce the energy consumption of DSP systems through voltage overscaling. This paper shows that the selection of arithmetic unit structure can be an important and non-trivial issue in soft DSP system design. We present an optimal formulation and propose sub-optimal low-complexity approximations for selecting the appropriate arithmetic unit structure in voltage overscaled signal processing systems. We further present a case study on choosing the appropriate MAC (multiply-accumulate) structure in voltage overscaled FIR (finite impulse response) filter.
Categories and Subject Descriptors B.2.4 [High-Speed Arithmetic]: Cost/performance
General Terms Algorithms, Design
Keywords voltage overscaling, signal processing, low power
1.
INTRODUCTION
Voltage scaling is very effective to reduce the energy consumption in CMOS integrated circuits (IC) [1, 2]. In conventional practice, voltage scaling is lower bounded by Vdd-crit under which the critical path delay equals the target clock period. It has been recently pointed out [3, 4] that voltage overscaling (i.e., overscale the supply voltage below Vdd-crit ), if used appropriately, may provide a promising potential to further reduce the energy consumption of various IC systems. The key of voltage overscaled IC design is how to maintain the satisfactory functionality in presence of the transient logic errors due to voltage overscaling while ensuring the overall system energy consumption is reduced. The Razor technique [4] tackles this issue by using a detect-then-recover mechanism. It can be very effective for applications such as general purpose computing that may tolerate the latency overhead due to the
Permission to make digital or hard copies of all or part of this work for personal or classroom use is granted without fee provided that copies are not made or distributed for profit or commercial advantage and that copies bear this notice and the full citation on the first page. To copy otherwise, to republish, to post on servers or to redistribute to lists, requires prior specific permission and/or a fee. ISLPED’07, August 27–29, 2007, Portland, Oregon, USA. Copyright 2007 ACM 978-1-59593-709-4/07/0008 ...$5.00.
error recovery operation. However, this technique may not be applicable to many digital signal processing (DSP) functions that typically perform real-time continuous data processing, which makes it difficult to support such detect-then-recover flow. Furthermore, as pointed out in [3], most DSP functions mainly concern certain quantitative performance criteria (e.g., signal to noise ratio (SNR)) and operations with such transient logic errors may not necessarily make the signal processing performance unacceptable. Therefore, it may not be necessary to always recover from such logic errors. In the context of signal processing, Shanbhag [3, 5] proposed a framework, referred to as soft DSP, that intends to compensate the signal processing performance degradation induced by voltage overscaling from the algorithm perspective at minimal energy cost. This may be realized by applying voltage overscaling on the original DSP block and compensating the resulted performance degradation with a separate and much simpler error control block. Shanbhag and his colleagues developed various error control block design schemes for linear filters [5–7] and fast Fourier transform (FFT) [8]. In most DSP functions, arithmetic units (i.e., adders and multipliers) are the major building blocks and typically constitute the critical paths. Therefore, the signal processing performance degradation heavily depends on the output errors of those arithmetic units. We note that, in all the prior work [5–8] on soft DSP, only ripple-carry adder structure is considered. Intuitively, different arithmetic unit structures (e.g., ripple-carry adder, carry-lookahead adder, and carry-select adder) may respond to the overscaled voltage differently, which will result in different signal processing performance degradation and hence different energy saving potential. Therefore, the selection of arithmetic unit structure in soft DSP system design may be a non-trivial issue, which nevertheless has never been addressed in the open literature. This paper presents an attempt to elaborate on this issue. In conventional design scenario without the use of voltage overscaling, the selection of arithmetic unit structure can be relatively straightforward, e.g., given a set of available arithmetic unit structures, we simply select the one that can meet the critical path requirement at the minimum energy consumption. However, in the context of soft DSP, different arithmetic unit realizations with the same critical path may result in different error characteristics and hence different signal processing performance degradation vs. power savings characteristic. Intuitively, we should select the arithmetic structures that lead to the minimum average power consumption under typical signal processing performance degradation scenario. This makes the appropriate selection of arithmetic unit structures inherently more complex. In this paper, we present the optimal formulation for searching the best arithmetic unit structures, which nevertheless tends to incur prohibitive computational complexity. Accordingly, we further propose two sub-optimal approaches by
trading the optimality for significant computational complexity reductions. Finally, we present a case study on FIR (finite impulse response) filter design by applying the proposed approach to select the appropriate MAC (multiply-accumulate) structure, which is further verified by comprehensive computer simulations. For all the experimental studies presented in the paper, we use Synopsys DesignWare to generate the arithmetic units without any manual optimization in order to ensure a reasonably fair comparison among different arithmetic unit structures.
A MOTIVATING EXAMPLE
With 16-bit adder design as an example, this section shows that different arithmetic unit structure may respond to the voltage overscaling in a (largely) different manner, leading to (largely) different error characteristics. We considered three adder structures including carry-ripple adder, carry-lookahead adder, and carry-select adder. We use Synopsys DesignWare to generate these adders using TSMC 65nm CMOS standard cell library (with 0.9V supply voltage) without any manual optimizations. The timing constraint is set 1.25ns (i.e., 800MHz) at the normal 0.9V supply voltage and all the synthesized adders have zero timing slack. Hence, they have the same critical voltage Vdd-crit of 0.9V. When operating at 0.9V and 800MHz, the carryripple adder consumes 0.556mW, the carry-lookahead adder consumes 0.498mW, and the carry-select adder consumes 0.557mW. Therefore, in conventional practice, we may want to choose the carry-lookahead adder. In the following, we will show that a different choice may be preferred in the context of voltage overscaled DSP system. We use the Synopsys Composite Current Source (CCS) model [9] to enable the simulations under voltage overscaling. The CCS model is a complete open-source current based modeling solution for timing, noise, and power analysis. Because CCS is currentbased, it can enable both temperature and voltage scaling of the cell behavior and achieve the timing analysis accuracy within 2% of SPICE, which is better than the conventional Non-Linear Delay and Power Models (NLDM/NLPM) [10]. 0.6
Porpagation Delay (ns)
0.55 0.5 0.45 0.4 0.35 0.3 0.25 0.8
0.85
0.9
0.95
1
Voltage Overscaling Factor K
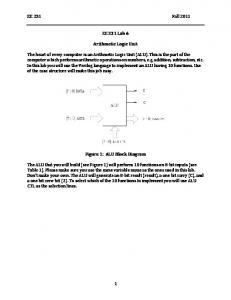
Figure 1: Simulated propagation delay vs. supply voltage for 1-bit full adder. During the simulation, we set the voltage overscaling factor K in the range of 0.8 ∼ 1 (i.e., the voltage ranges between 0.72V and 0.9V). To illustrate the propagation delay vs. supply voltage characteristic of the TSMC 65nm standard cell library being used, we carried out the simulations on a 1-bit full adder (with the load
500 Carry−Ripple Adder Carry−Lookahead Adder Carry−Select Adder
450
Average Error Magnitude
2.
of an inverter with 10 times of minimum size) as shown in Fig. 1. It shows that the propagation delay is almost linearly proportional to the supply voltage. We further carried out simulations on the above three 16-bit adders under different supply voltages, while keeping the frequency as 800MHz. We randomly generated 106 pairs of 16-bit input data (each bit has equal probability to be 0 or 1 and all the bits are randomly generated independent from each other). Fig. 2 shows the simulated average error magnitude vs. normalized power consumption.
400 350 300 250 200 150 100 50 0 0.65
0.7
0.75
0.8
0.85
0.9
0.95
1
Normalized Power Consumption
Figure 2: Simulated average error magnitude vs. normalized power consumption for the three 16-bit adders operating at 800MHz. Fig. 3 further shows the relations between the error occurrence probability for each bit and the supply voltage for these three adders, where VOS stands for voltage overscaling. The bit 0, 15, and 16 correspond to the Least Significant Bit (LSB), Most Significant Bit (MSB), and adder carry out, respectively. Such further information provided in Fig. 3 can approximately explain the different average error magnitude vs. supply voltage characteristic among the three adders. The different error distribution characteristics as shown in Fig. 3 may be intuitively explained as follows: 1) In the carry-ripple adder, the more significant bit has longer worst-case delay and hence can be more subject to errors. On the other hand, for more significant bits, their worst-case-delay paths tend to be activated less frequently. As the results of these two somehow conflicting trends, the error occurrence probabilities of those more significant bits tend to be similar as shown in Fig. 3(a). 2) The carry-lookahead adder consists of several segments that form a carry-lookahead chain and within each segment a carryripple adder should be used. As a result, the MSBs of each segment tend to have similar worst-case delay that are the same or close to the overall adder critical path. Therefore, these MSBs within all the segments are more subject to the errors, as illustrated in Fig. 3(b). 3) The carry-select adder also consists of several segments. But the two possible addition results of each segment (corresponding to the two scenarios that the carry input to this segment is 0 and 1) are pre-computed and are simply selected by the carry input. Therefore, the less significant bits within each segments may be more subject to errors compared with more significant bits in the same segment. Since the adder is generated using DesignWare, the segment partition information is not readily available. From the Fig. 3(c), we guess that the bits around the position 8 and 12 are
LSBs within two adjacent segments. The above results suggest that, even though the carry-lookahead adder has the minimum power consumption under normal supply voltage, the carry-select adder may be preferred in voltage overscaled DSP system design since the average error magnitude may directly affect the signal processing performance degradation.
It is desirable to have a systematic framework to provide quantitative comparison among different arithmetic unit structures for voltage overscaled system design. This section first presents the optimal formulation for such a framework, which nevertheless tends to incur prohibitive computational complexity. Then we propose two sub-optimal formulations that may dramatically reduce the complexity. In a DSP system, we define an arithmetic unit as an indivisible arithmetic block that spans over at least one pipeline stage, e.g., if one pipeline stage contains one multiplier followed by an adder, this multiplier-adder concatenation will be considered as one arithmetic unit. Let N represent the total number of arithmetic units in the DSP system, and each arithmetic unit Ui may (1) (2) (k ) choose from ki different structures {Ui , Ui , · · · , Ui i }. Assume the DSP system is measured by a single performance metric (e.g., the SNR), and let δ denote the signal processing performance degradation incurred by voltage overscaling. Let pd (δ) represent the desired probability distribution function of δ during the operation of the DSP system. Subject to a certain performance degradation δ, different arithmetic unit structures may allow different degree of voltage scaling and hence different power consumption. Therefore, the DSP system power consumption can be expressed as a function of δ and the set of arithmetic unit structures being (j ) (j ) (j ) used, i.e., ge (δ, U1 1 , U2 2 , · · · , UN N ). Given the maximum allowable performance degradation δmax , we would like to select the structure set {j1 , j2 , · · · , jN } that can minimize Z δmax (j ) (j ) (j ) pd (δ) · ge (δ, U1 1 , U2 2 , · · · , UN N ) dδ.
Error Probability (%)
PROPOSED ARITHMETIC UNIT STRUCTURE SELECTION APPROACHES
6 4 2 0 0
4
0.8 8
12
Bit Position
0.9 16
1.0
VOS Factor K
(b) Error Distribuitions of Carry−Lookahead Adder
Error Probability (%)
3.
(a) Error Distribuitions of Carry−Ripple Adder
6 4 2 0 0
4
Bit Position
0
0.8 8
12
0.9 16
1.0
VOS Factor K
Error Probability (%)
(c) Error Distribuitions of Carry−Select Adder Such optimally formulated approach for arithmetic unit strcture selection clearly is subject to a very high computational complexity for two reasons: (i) We have to exhaustively search in the N dimensional space, where N can be large in practical DSP sys6 tems. (ii) Given each set of arithmetic unit structures, the value of (j ) (j ) (j ) ge (δ, U1 1 , U2 2 , · · · , UN N ) should obtained through computer 4 simulations on the entire DSP system. In the following, to largely reduce the computational complexity 2 at the cost of optimality, we propose two sub-optimal approaches, 0 where the second approach is essentially a further approximation of the first one. Among all the arithmetic units in the DSP system, 0 0.8 we first categorize those arithmetic units with the same functional4 ity into the same type. Suppose the DSP system contains t different 8 0.9 12 types of arithmetic units, and each type of arithmetic unit, denoted (1) (2) (si ) 16 as Ai , may choose from si different structures {Ai , Ai , · · · , Ai }. 1.0 Bit Position VOS Factor K Since many DSP systems have very regular and uniform structure, the value of t typically is not big and much less than N . We assume that the same type of arithmetic units tend to have the same (or simFigure 3: Error occurrence probability of each bit of the three ilar) input data characteristics and always use the same structure. different adders. (j ) (j ) (j ) Hence, the function ge (δ, U1 1 , U2 2 , · · · , UN N ) in the above (j ) (j ) (j ) can be reduced to a function fe (δ, A1 1 , A2 2 , · · · , At t ), and the objective becomes to select the structure set {j1 , j2 , · · · , jt }
0
Clearly, this approach reduces the dimension of the structure search space from N to t, which may result in a large complexity reduction. Nevertheless, even the t-dimension search space may be too big for many practical systems and this approach still needs to perform the simulations on the entire DSP systems in order to obtain (j ) (j ) (j ) the function fe (δ, A1 1 , A2 2 , · · · , At t ). Therefore, we propose to further approximate the above approach in order to further reduce the complexity. This proposed second approach is based on the following assumption: The errors of the arithmetic units are independent random variables and certain statistical characteristic of the errors (such as the expectation and variance) additively determine the signal processing performance degradation. We denote such error statistical characteristic as φ. We note that such an assumption can be reasonably valid for many linear DSP systems such as FIR and FFT. Based upon this assumption, we can individually evaluate the impact of different structures for each type of arithmetic units, i.e., the above t-dimensional optimization problem can be further decomposed into t 1-dimensional optimization problems. Moreover, since the same type arithmetic units have the same or similar input data statistical characteristics, we assume that their output errors have the same value of φ and hence the same impact on the signal processing performance. For Ai -type arithmetic unit, we define a function φ(i) = Γi (δ) that (approximately) translates the desired signal processing degradation δ to the value of error statistical characteristic φ(i) . Given the maximum allowable (i) signal processing performance degradation δmax , we have φmax = Γi (δmax ). Let ni denote the number of Ai -type arithmetic units (i) in the DSP system, we use φmax /ni to estimate the maximum allowable value of the error statistical characteristic φ for each Ai type arithmetic unit if only Ai -type arithmetic units contribute to the signal processing performance degradation. Moreover, for each Ai -type arithmetic unit, its average power consumption can be ex(i) (j) pressed as a function of φ and the selected structure, i.e., fe (φ, Ai ). Accordingly, we define a metric called IUPP (Integration of Unit Performance and Power) for the Ai -type arithmetic unit as follows: Z IU P Pi (j) =
(i)
φmax /ni 0
pd (Γ−1 i (ni
· φ)) ·
(j) fe(i) (φ, Ai ) dφ.
(1)
Therefore, for each Ai -type arithmetic unit, we simply select the structure ˜ji that can minimize the corresponding IUPP metric without considering the overall DSP system, i.e., ` ´ IU P Pi (˜j) = min IU P Pi (j) , j∈[1,si ]
and use the set of {˜j1 , · · · , ˜jt } as the approximation of the structure set obtained by solving the above t-dimensional optimum problem. Realization of the above proposed approaches in practice will involve certain trade-offs and design decisions. We can only estimate (j ) (j ) (j ) (i) (j) the functions fe (δ, A1 1 , A2 2 , · · · , At t ) and fe (φ, Ai ) through sampled numerical simulations. This clearly involves a trade-off between the accuracy and computational complexity. When using the second approach, in the simulations, we need to feed the arithmetic unit with input data whose statistical characteristics should be close to that in real DSP system. This may not be always feasible and we may rely on some further system-wise simulations to extract the appropriate input data characteristics. Moreover, the function φ(i) = Γi (δ) that relates the signal processing performance degra-
dation to the arithmetic unit error statistical characteristic may also depend on some run-time environmental parameters of the DSP systems (e.g., the power of the noise from other resources). Therefore, we have to make some decisions on the appropriate setup of these parameters. Finally, the desired distribution of the signal processing performance degradation can also be heavily dependent on the DSP run-time environment. Hence certain further assumptions may be necessary. All these factors will inevitably affect the accuracy of the above two sub-optimal approaches. Nevertheless, since we may only be interested in the relative comparisons of various arithmetic unit structure options and practical design may be more concerned of how to avoid the use of those relatively very bad structures, the above proposed approaches may provide reasonably good frameworks for selecting appropriate arithmetic unit structures in voltage overscaled DSP systems.
4.
A CASE STUDY ON FIR FILTER
This section presents a case study on voltage overscaled FIR filter to further illustrate the impact of various arithmetic unit structures and the use of the above proposed second approach. We considered a 19-tap low-pass FIR filter with (0 ∼ 0.3)·ω/2π passband as illustrated in Fig. 4. This FIR filter intends to extract the desired signal within (0 ∼ 0.25) · ω/2π from the interfering signals within (0.35 ∼ 1) · ω/2π and additive white Gaussian noise (AWGN). Its filtering performance is measured in terms of SNR. For the finite word-length configuration, we use 17-bit fixed-point representation for the filter input/output, filter coefficients, and all the intermediate data, where the point sits between the MSB and second MSB. 0 Desired Signals
Magnitude (dB)
that can minimize Z δmax (j ) (j ) (j ) pd (δ) · fe (δ, A1 1 , A2 2 , · · · , At t ) dδ.
Interfering Signals
-40
-80
-120
Lowpass Filter
0.0
0.2
0.4
0.6
0.8
1.0
Normalized Frequency (Z / 2S )
Figure 4: FIR filter frequency response and run-time environment setup. This FIR filter has a transposed structure, hence it only contains one type of arithmetic unit, i.e., MAC. For the design of MAC, as pointed out in prior work [5, 11], using sign-magnitude input data representation may reduce the dynamic power consumption and, more importantly, reduce the error occurrence on more significant bits of the MAC output when the voltage overscaling is being used. Therefore, we use the sign-magnitude data representation for the input/output of the MACs in the FIR filter, as illustrated in Fig. 5. Let mag(·) and sign(·) represent the magnitude and sign of the data, respectively. As illustrated in Fig. 5, the Carry-Save Adder followed by the Merge Adder calculate mag(A)·mag(B)+ mag(C) if sign(A·B) equals to sign(C), or mag(A)·mag(B)− mag(C) otherwise, and the calculation is realized by internally representing mag(A) · mag(B) and ±mag(C) with 2’s complement format. The output of the Merge Adder is D = mag(A) · mag(B) ± mag(C) in 2’s complement representation. To obtain the magnitude of D, we should XOR its MSB with all the other
mag ( A) mag ( B ) r mag (C ) Magnitude of A
Carry-Save Adder (Wallace Tree)
Magnitude of B
Partial Sums
Magnitude of Output
Merge Adder
B
Residual LSB
MSB
A
MAC
Sign of A Sign of B
C 0
Sign of Output
1
Magnitude of C
Output
Residual LSB
Sign of C
Figure 5: Structure of MAC (A · B + C) with sign-magnitude data input/output. bits and meanwhile add its MSB to the LSB position. To remove the overhead incurred by such an extra addition in each MAC, we can delay it to the final FIR filter output and refer the MSB of D as the residual LSB output, as illustrated in Fig. 5. Accordingly, we have the overall FIR filter structure as shown in Fig. 6.
can calculate the IUPP metric for each MAC based on (1) by re(i) 2 /19. Table 1 placing φ with σe2 and replacing φmax /ni with σe,max lists the IUPP metrics, which suggests that the BK-MAC may be a good choice. −5
2 B
0
C
A
h17
B
D
C
MAC
A
h0
...
MAC
Output
Residual LSB
Output
Residual LSB
D
B
A
MAC C
Output
D
Figure 6: Structure of the FIR filter. We are interested in selecting the appropriate MAC structure for voltage overscaled FIR filter. Using Synopsys DesignWare with TSMC 65nm CMOS standard cell library, we obtained four different MACs, which only differ at the Merge Adder that is ripple-carry adder, carry-lookahead adder, carry-select adder, or Brent-Kung (BK) adder. We denote these four different MACs as RC-MAC, CL-MAC, CS-MAC, and BK-MAC, respectively. Synthesized under the timing constraint of 2.8ns (i.e., 357MHz), the four MACs have the same timing slack of 0. In the following, we will use the above proposed second approach to select the appropriate MAC among these four options by calculating IUPP metric for each MAC. In this context, we first need to determine the specific statistical characteristic of the MAC output error. Since the performance of the FIR filter is measured in terms of SNR, the variance of the MAC output error should be used. Let σe2 denote the error variance, i.e., φ = σe2 in the formulations (i) (j) presented in the above. The function fe (σe2 , Ai ) for each MAC can be obtained from the simulations, as shown in Fig. 7. The function δ = Γ−1 (σe2 ) that maps error variance to SNR degradation can be approximately represented as δ=Γ
−1
(σe2 )
1.6
D
Residual LSB
D
CR−MAC CL−MAC CS−MAC BK−MAC
1.8
σ2 σ2 = 10 log10 ( s2 ) − 10 log10 ( 2 s 2 ) σn σn + σe σ2 + σ2 = 10 log10 ( n 2 e ), σn
where σs2 is the signal variance, σn2 is the variance of the AWGN, and σe2 is the total variance of the MAC errors. In the simulation setup, the power of AWGN is -38dB, corresponding to σn2 = 1.56×10⁻⁴ . Furthermore, we assume the desired SNR degradation δ has a uniform distribution between 0dB and 5dB, i.e., δmax =5dB. 2 Accordingly, we can obtain σe,max = 3.37 × 10⁻⁴ . Therefore, we
Error Variance
h18
x 10
1.4 1.2 1 0.8 0.6 0.4 0.2 0 0.5
0.6
0.7
0.8
0.9
1
Normalized Power Consumption Figure 7: Simulated curves of error variance vs. normalized power consumption for each MAC.
Table 1: Normalized IUPP Metrics of the Four MACs CR-MAC CL-MAC CS-MAC BK-MAC Normalized 1 0.75 0.85 0.73 IUPP To further testify this conclusion, we conducted the much more time-consuming simulations on the entire FIR filter using these four different MACs, and Fig. 8 shows the simulated SNR vs. normalized power consumption, which agrees with the above conclusion that BK-MAC may be preferred. The relative comparisons among different MACs shown in Table 1 also agrees with the comprehensive simulation results in Fig. 8. Moreover, the results in Fig. 8 suggest that voltage overscaling may also be considered even though no performance degradation is allowed, e.g., we may use voltage overscaling to reduce the power consumption by about 13% when using either BK-MAC or CL-MAC at no noticeable SNR degradation.
22
redundancy,” IEEE Transactions on Very Large Scale Integration (VLSI) Systems, vol. 12, pp. 497–510, May 2004. [9] SYNOPSYS Composite Current Source, http://www.synopsys.com/. [10] George Mekhtarian, “Composite Current Source (CCS) Modeling Technology Backgrounder,” Nov. 2005. [11] A.P. Chandrakasan and R.W. Brodersen, “Minimizing power consumption in digital cmos circuits,” Proceedings of the IEEE, vol. 83, pp. 498–523, Apr. 1995.
CR−MAC CL−MAC CS−MAC BK−MAC
20
SNR(dB)
18
16 14
12
10 0.7
0.75
0.8
0.85
0.9
0.95
1
Normalized Power Consumption Figure 8: Performance with voltage over-scaling.
5.
CONCLUSIONS
This paper addresses the issue of arithmetic unit selection in voltage overscaled soft DSP system design. For the first time, we show that different arithmetic unit structures can respond to the voltage overscaling very differently, which may result in largely different design effectiveness of soft DSP system. The optimal formulation for searching the best arithmetic unit structures is presented, which nevertheless tends to incur prohibitive computational complexity. Therefore, we further propose two sub-optimal approaches that may realize reasonably good results at largely reduced computational complexity. Finally, we present a case study on choosing the appropriate MAC structures for voltage overscaled FIR filter.
6.
REFERENCES
[1] A. P. Chandrakasan and R. W. Brodersen, “Minimizing power consumption in digital CMOS circuits,” Proceedings of the IEEE, vol. 83, pp. 498–523, April 1995. [2] R. Gonzalez, B.M. Gordon, and M.A. Horowitz, “Supply and threshold voltage scaling for low power CMOS,” IEEE Journal of Solid-State Circuits, vol. 32, pp. 1210–1216, Aug. 1997. [3] N. R. Shanbhag, “Reliable and energy-efficient digital signal processing,” in Proc. of Design Automation Conference, June 2002, pp. 830–835. [4] S. Das, D. Roberts, S. Lee, S. Pant, D. Blaauw, T. Austin, K. Flautner, and T. Mudge., “A self-tuning DVS processor using delay-error detection and correction.,” IEEE Journal of Solid-State Circuits, vol. 41, pp. 792–804, April 2006. [5] R. Hegde and N. R. Shanbhag, “Soft digital signal processing,” IEEE Transactions on Very Large Scale Integration (VLSI) Systems, vol. 9, pp. 813–823, Dec. 2001. [6] L. Wang and N. R. Shanbhag, “Low-power filtering via adaptive error-cancellation,” IEEE Transactions on Signal Processing, vol. 51, pp. 575–583, Feb. 2003. [7] R. Hegde and N. R. Shanbhag, “A voltage overscaled low-power digital filter IC,” IEEE Journal of Solid-State Circuits, vol. 39, pp. 388–391, Feb. 2004. [8] B. Shim, S. R. Sridhara, and N. R. Shanbhag, “Reliable low-power digital signal processing via reduced precision